Sticker price is the worst way to compare tire brands, and most fleets still buy that way. A tire that costs $120 less at purchase but delivers 40,000 fewer miles before scrapping is not the cheaper tire — it is the more expensive one, once cost per mile is calculated instead of cost per unit. This page walks through how to build a real brand-versus-brand comparison across casings like Michelin, Bridgestone, Goodyear, and Continental, using the data your fleet already generates, and where a maintenance platform like Oxmaint fits into tracking it by position and casing rather than by invoice.
TIRE MANAGEMENT · CASING PERFORMANCE · COST PER MILE BY BRAND
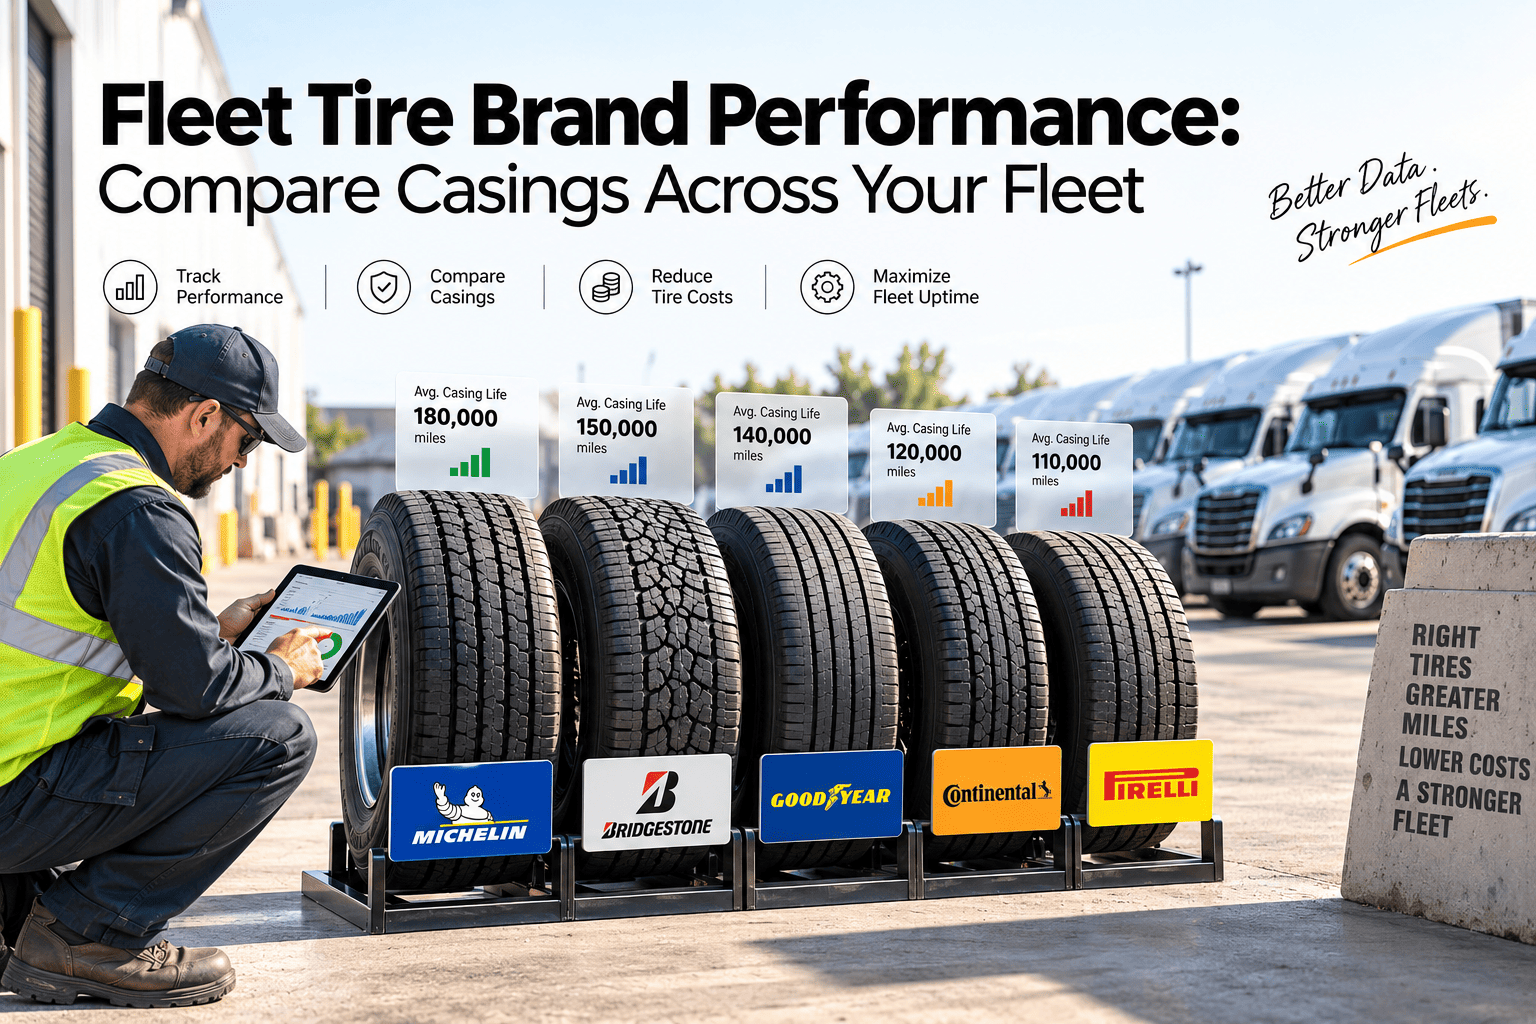
Fleet Tire Brand Performance: Compare Casings Across Your Fleet
Sticker prices don't tell you which tire brand is actually cheaper. This guide shows the cost-per-mile method that ranks Michelin, Bridgestone, Goodyear, and Continental on real fleet routes — by position, not by invoice.
Why Brand Comparisons Fall Apart Without A Cost-Per-Mile Baseline
Ask five fleet managers which tire brand performs best and you will get five different answers, because most of those answers are based on purchase price, dealer relationship, or a handful of memorable failures rather than a consistent dataset.
The only comparison that holds up is cost per mile: total cost of the tire — purchase price, mounting labor, and any retread investment — divided by the total miles it delivered before being pulled. Calculated this way, a premium-priced tire from a brand with strong casing retreadability frequently beats a cheaper tire that scraps after one life, even though the invoice said otherwise on day one.
The Data Most Fleets Are Already Collecting But Not Using
Almost every fleet running a modern shop already generates the raw data a brand comparison needs — it just lives scattered across purchase invoices, DVIR inspection reports, and separate retread vendor billing rather than in one place tied to the individual tire.
The gap is rarely data collection. It is data connection. A purchase order shows what was bought and at what price. A DVIR shows a tread depth reading on a given date. A retread invoice shows a casing went out and came back. None of those records, on their own, tells you the cost per mile of a specific casing across its full life — that only appears once all three are tied together against a single tire identifier and tracked through every position change, inspection, and retread event.
What Actually Separates The Major Brands
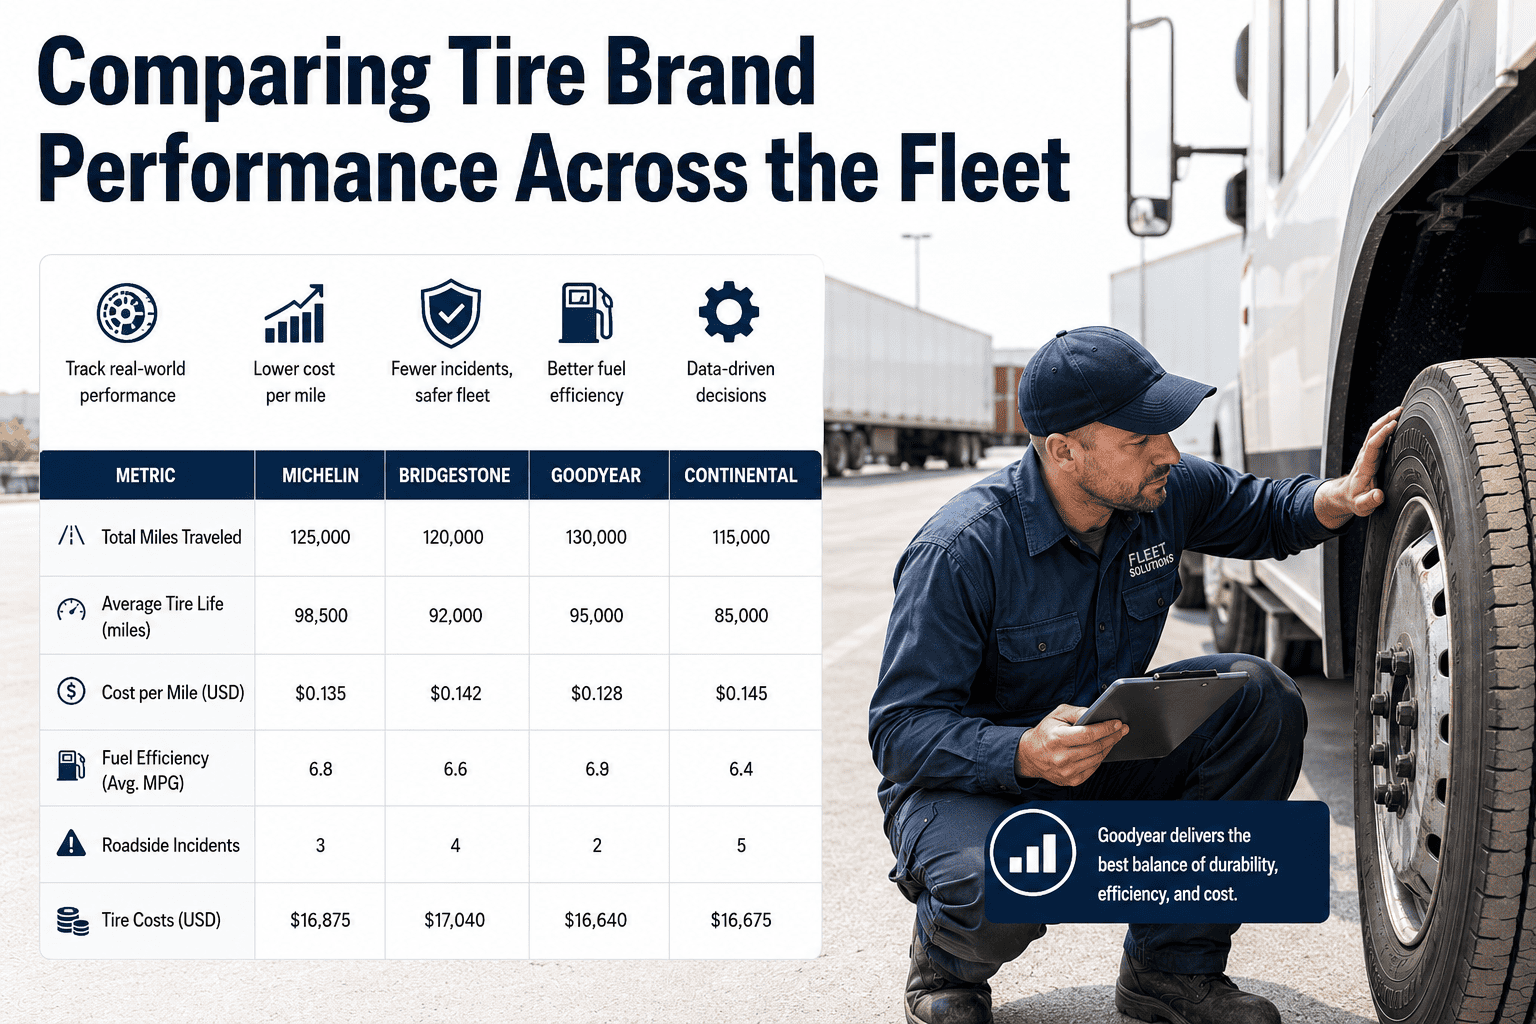
Michelin, Bridgestone, Goodyear, and Continental are all credible choices at the premium end of the market, and the marketing gap between them is often larger than the real performance gap on a comparable application. The differences that matter for fleet CPM show up in three places: casing durability across retread generations, dealer and service network depth, and how well a given tread pattern matches your specific duty cycle.
Casing Retreadability
Premium casings from the major brands are commonly rated for multiple retread generations when inspection and repair discipline is followed — this is where most of the real cost-per-mile advantage is won or lost, far more than the brand name on the sidewall.
Rolling Resistance / Fuel Impact
Fuel-efficient tread lines from each major brand are SmartWay-verified and land close together on rolling resistance — the fuel savings are real but the brand-to-brand gap within this category is small.
Dealer & Service Network
Network depth affects downtime, not just tire wear. A brand with denser regional coverage on your specific routes can lower total cost even if the tire itself performs identically to a competitor.
Application Fit
Long-haul, regional, and vocational duty cycles favor different tread designs within each brand's own lineup — the brand comparison matters less than matching the specific model to the mission.
The CPM Comparison Worksheet Fleets Should Be Running
Rather than trust a single published benchmark, run your own brand comparison against these four inputs for every casing in your data, tracked separately by axle position since steer, drive, and trailer positions wear at completely different rates.
Purchase Price
What you actually paid per unit, including any national account or volume pricing — not list price.
Miles Delivered
Total miles from mount to pull, tracked per casing serial or barcode, not averaged across a batch.
Retread Generations
How many times that casing was successfully recapped before scrap — this is the single biggest CPM lever.
Road Call Rate
Failures per thousand units in service, since one roadside blowout can erase an entire year of CPM savings.
A Worked Example: Same Fleet, Three Casing Strategies
The table below illustrates the CPM method using representative figures for a mixed 150-truck fleet running steer, drive, and trailer positions. Use it as a template — the actual numbers should come from your own casing records, not this example.
| Casing Strategy | Position | Avg. Life (mi) | Total Cost | CPM |
|---|---|---|---|---|
| Premium, 2 retread generations | Drive | 250,000 | $700 | $0.0028 |
| Mid-tier, 1 retread generation | Drive | 145,000 | $450 | $0.0031 |
| Premium, new only | Steer | 135,000 | $560 | $0.0041 |
| Premium, 2 retread generations | Trailer | 210,000 | $410 | $0.0020 |
| Budget, no retread program | Drive | 110,000 | $320 | $0.0029 |
Notice the budget casing lands close to premium on raw CPM in this example — but with zero retread cycles logged, it has no upside left. The premium casing with two retread generations still has capacity to lower its CPM further; the budget tire's number is already final.
Track Every Casing By Barcode, Not By Batch
Oxmaint logs each tire's purchase, position, inspection history, and retread generation against the vehicle record, so your brand comparison is built from real fleet data instead of a published benchmark.
Industry CPM Benchmarks By Fleet Type
Before comparing brands, compare your fleet against its own duty-cycle peer group — a long-haul CPM and a vocational CPM are not the same scale, and grading your brand comparison against the wrong benchmark will produce the wrong conclusion.
Long-Haul
$0.020–$0.035 / mi
Interstate routes at moderate loads on highway surface generate the longest tire life of any duty cycle.
Regional
$0.024–$0.038 / mi
Frequent stops and mixed urban/highway surface typically raise wear rate 15–20% above long-haul.
Vocational
$0.035–$0.060 / mi
Severe-duty applications and off-highway surfaces drive the widest CPM range of any fleet type.
Common Mistakes That Skew A Brand Comparison
01Comparing purchase price alone without factoring in miles delivered or retread value
02Blending steer, drive, and trailer data into one fleet-wide CPM number, which hides which position is actually underperforming
03Leaving out road call and downtime cost, which flatters brands with a higher early-failure rate
04Judging a brand off a small sample size — a handful of early failures on one route is not a fleet-wide verdict
05Ignoring inflation and alignment discipline, which affects wear rate more than brand choice in many fleets
Inflation And Alignment: The Variable That Skews Every Brand Test
Before crediting or blaming a brand for a wear result, rule out the two variables that distort tire life more than casing quality in most fleets: inflation discipline and alignment. A tire running consistently 10 PSI under spec wears unevenly and scraps early regardless of which manufacturer built it, and the same is true of a trailer running out of alignment tolerance.
Fleets that skip this step end up crediting or discrediting a brand for a problem that was actually a maintenance gap. Pull inflation and alignment history alongside the CPM data before drawing a brand conclusion — a casing that underperformed on one route with a known alignment issue is not evidence against the brand fleet-wide.
Building A Standardized Inspection Workflow Around Casing Data
CPM data is only as good as the inspection discipline feeding it. A casing pulled for a repairable puncture and scrapped unnecessarily never gets the retread generations it was rated for, quietly inflating that brand's CPM with a failure that had nothing to do with the tire itself.
1
Mount & Barcode
Every tire gets a unique identifier at mount, tying purchase price and DOT date directly to the vehicle and position.
2
Routine Inspection
Tread depth and pressure logged at every PM interval, not only when a driver flags a visible problem.
3
Repair Decision
A consistent repairable-versus-scrap standard applied fleet-wide, not left to individual technician judgment per yard.
4
Retread Or Scrap
Casing sent for retread or scrapped, with the outcome and reason logged back against the same barcode record.
5
Lifecycle Close-Out
Final miles, total retread generations, and total cost roll up automatically into the brand-level CPM report.
Turning The Comparison Into An Ongoing Spec Decision
A one-time brand comparison goes stale the moment a manufacturer updates a tread compound or a dealer changes pricing. The fleets that get lasting value from this exercise run it continuously, not as an annual project.
Oxmaint attaches a barcode or serial record to each tire at mount, tracks its position, inspection history, and pressure checks through its service life, and logs every retread event against the same casing record. When a tire is pulled, its full lifecycle — purchase cost, miles delivered, retread generations, and any road call history — rolls up automatically into a fleet-wide CPM report by brand, model, and position. That turns the brand-versus-brand question from a quarterly guess into a live number that updates every time a tire comes off a truck, and it flags underperforming SKUs for removal from spec before they drag the fleet average down further.
How Duty Cycle Should Change Which Brand And Model You Spec
The best casing for a long-haul steer position is rarely the best casing for a vocational drive position running off-highway surfaces daily. Matching the right tread compound and pattern to the actual duty cycle moves CPM more than switching brands within the same category ever will.
Long-haul fleets generally benefit most from low rolling-resistance tread lines built for sustained highway speed and predictable loads, where fuel savings compound over hundreds of thousands of miles. Regional fleets running frequent stops need a compound that tolerates more scrubbing without accelerating tread wear. Vocational fleets on rough or unpaved surfaces need casing reinforcement and cut resistance more than they need the lowest rolling resistance number — chasing a fuel-economy tread on a gravel route usually produces a shorter-lived tire, not a cheaper one.
Setting Up A Fair Brand Test On Your Own Fleet
Fleets that want a genuine answer, not an assumption carried over from a sales rep's pitch, should run a controlled comparison rather than trusting scattered anecdotal results from drivers and yard managers.
01Match test vehicles by route, load, and duty cycle so the comparison isolates the tire, not the application
02Run each brand across a large enough sample per position to avoid one early failure skewing the entire result
03Hold inflation and alignment practices identical across the test group for the full comparison period
04Track the full lifecycle through at least one retread generation before drawing a conclusion, since original-tread-only data misses the biggest CPM lever
05Review results by position separately — a brand can win on trailer and lose on drive within the same fleet
Fleet Tire Brand Comparison Questions
Is Michelin or Bridgestone objectively cheaper per mile for fleets?+
Neither wins universally — both are credible premium casings, and the real gap depends on your application, retread discipline, and regional dealer support more than the brand name itself.
How many retread generations should a premium casing realistically deliver?
Major-brand casings are commonly rated for up to three retread cycles with proper inspection and repair discipline, though actual results vary by position and duty cycle.
Should we track CPM separately for steer, drive, and trailer positions?
Yes — blending positions into one number hides which position is actually underperforming and can mask a brand or SKU that should be dropped from spec. Start a free trial to track CPM by position automatically.
How much does a road call actually cost compared to the tire itself?
Tire-related roadside failures commonly run $500 to $1,000 per event once load delays and driver overtime are included, which can outweigh the entire purchase-price difference between brands.
Is a budget or imported tire ever the right choice for a fleet?
It can be, for lower-mileage or shorter-lifecycle vehicles where a retread program was never realistic. For high-mileage drive and steer positions, the retreadability gap usually favors premium casings.
Where This Leaves A Fleet Manager Choosing Between Brands Today
If there is one takeaway from running this comparison properly, it is that the brand name on the sidewall explains less of your fleet's tire cost than purchase discipline, retread program maturity, inflation compliance, and application fit combined. Michelin, Bridgestone, Goodyear, and Continental can all be the right answer depending on position and duty cycle — and all four can be the wrong answer if the casing is scrapped early from a maintenance gap that had nothing to do with the tire itself.
Treat the brand decision as one input into a larger tire lifecycle program rather than the whole program. Get the tracking right first, and the brand comparison answers itself from data instead of opinion.
Stop Comparing Tire Brands By Invoice — Compare Them By Casing
The brand that wins on your fleet is the one your own CPM data says wins, tracked by position and retread generation. Oxmaint builds that record automatically from the first mount forward.



.png)
