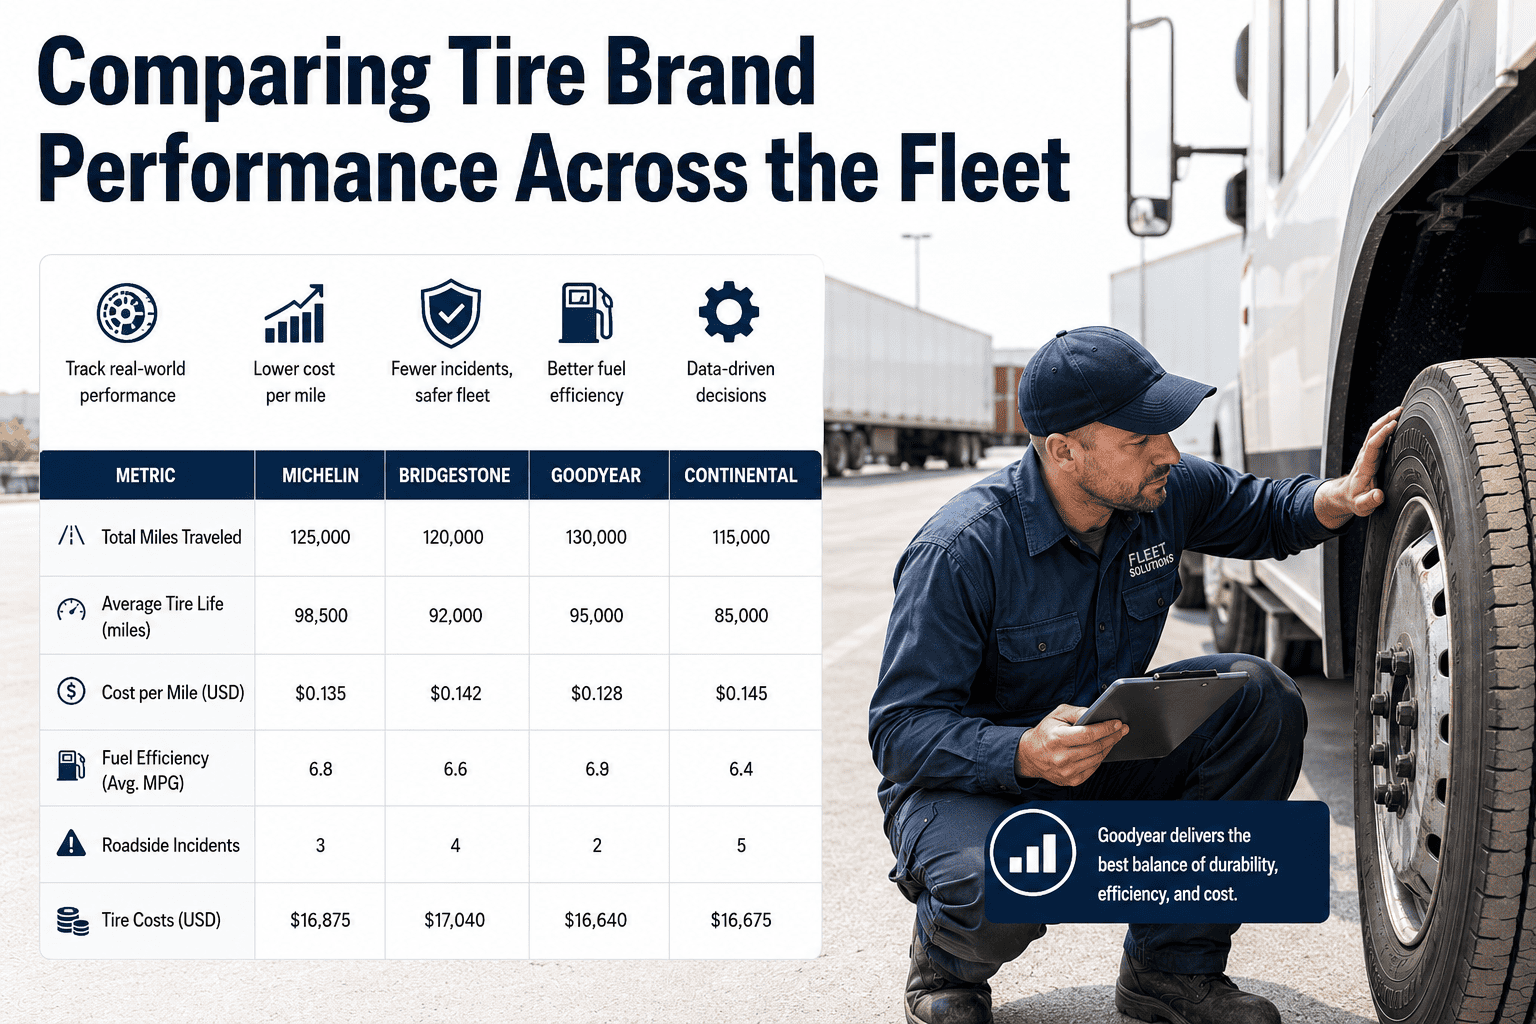
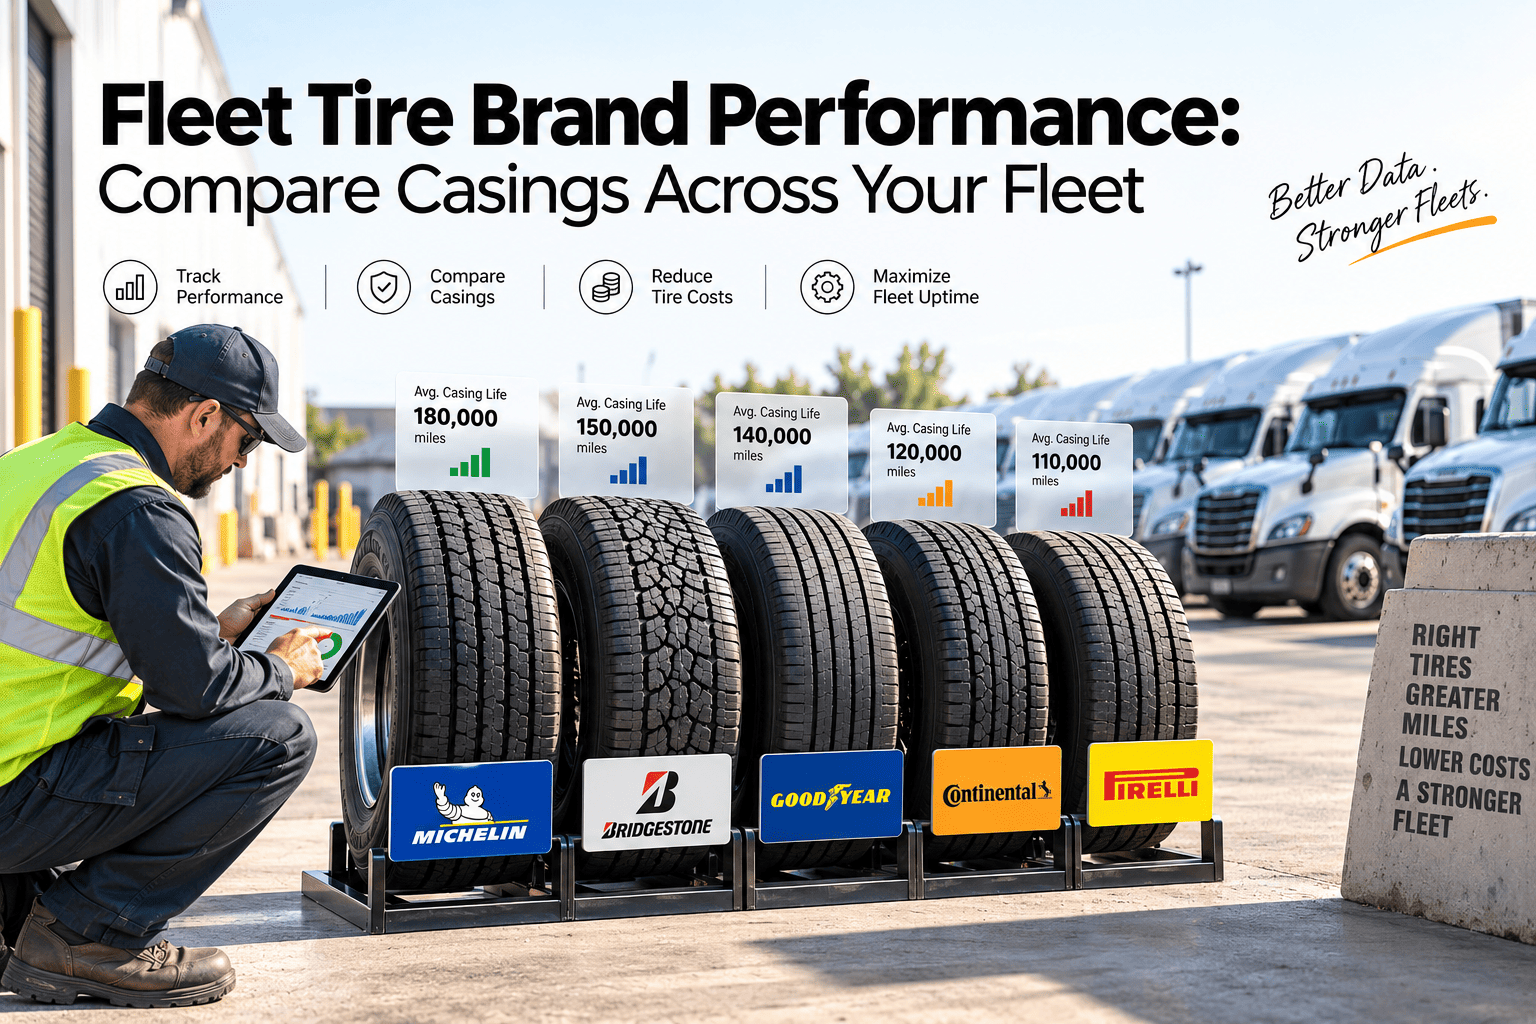
Commercial tire manufacturers publish aggressive performance claims, but those spec-sheet numbers rarely survive contact with your fleet's actual routes, loads, and duty cycles. A structured tire brand performance comparison changes that by turning your own lifecycle data — miles to removal, cost per mile, retread yield, blowout frequency — into head-to-head evidence across brands and models. Run peer-group comparisons the right way and most fleets uncover 10–20% in tire spend savings without touching safety margins or uptime. Ready to see your numbers? Start Free Trial and let your fleet's own data do the talking.
Are you paying tier-one prices for tier-two results?
Manufacturer claims tell you what a tire can do in a lab. Your lifecycle data tells you what it actually does on your routes — in your weather, with your loads, across your drivers. Structured peer-group comparison is how fleets stop guessing and start saving.
Stop comparing stickers. Start comparing outcomes.
A tire is not "good" or "bad" in the abstract — it is good or bad at producing a specific outcome under specific conditions. These are the five metrics a serious brand comparison must track across every tire in your fleet.
Cost per Mile
Total tire spend (purchase + retread + repair + disposal) divided by miles run before removal. The single most honest number in fleet tire management.
Miles to Removal
Average mileage at pull — original tread. Low miles to removal on steer positions is a red flag even when cost per mile looks acceptable.
Retreadability Rate
Percentage of casings that pass inspection and re-enter service. A $400 tire that retreads twice often beats a $300 tire that retreads zero times.
Blowout Frequency
Road failures per 100 tires per 100,000 miles. The safety metric that also drives CSA scores, tow bills, and cargo claims.
Fuel Efficiency Contribution
Measured indirectly via MPG delta on trucks running specific tire specs against a control set. Low-rolling-resistance tires can swing MPG by 1.5–3%.
Apples to apples, or the comparison is worthless
Comparing a Bridgestone R268 drive tire on highway lanes against a Michelin XDN2 drive on regional lanes tells you nothing about the tires — it only tells you about the routes. Fair comparison requires controlling every variable except the tire itself.
Only when all four conditions are held constant can you attribute performance differences to the tire brand or model rather than to operating conditions.
Axle position
Steer, drive, and trailer positions wear differently. Never cross-compare a steer tire against a drive tire — even within the same brand.
Vehicle class
Day-cab, sleeper, heavy-haul, and straight trucks impose different loads and pressures. Match GVWR classes before drawing conclusions.
Route profile
Highway, regional, mixed-service, and urban routes destroy tread at different rates. A long-haul drive tire can look twice as good as a regional one.
Duty cycle
Average speed, load factor, idle time, and brake frequency all shape wear. Similar duty cycles are the final gate before a comparison is valid.
The patterns most fleets never see
Once the peer-group filter is applied and 12–24 months of tire history is in hand, consistent patterns emerge — and they frequently contradict the price tags on the tires.
Some name-brand tires don't earn their premium
Tier-one positioning does not guarantee tier-one performance in every application. When a $480 premium steer tire delivers the same miles to removal as a $360 mid-tier steer in the same lane, the premium is pure cost — not value.
Second-tier brands often match on drive, not on steer
A recurring pattern: second-tier brands match or beat tier-one brands on drive positions but underperform on steer positions. The implication is strategic — split your brand mix by axle, not by fleet.
Regional brands beat the top three on specific applications
Continental, Hankook, Yokohama, and Sumitomo sometimes outperform Bridgestone, Michelin, and Goodyear on specific applications — at 15–25% lower cost per mile. The savings live in the details, not the marketing deck.
Sample size is everything
A single bad batch or one rough driver can distort a small sample. The analysis must run over 12–24 months of tire history across enough assets to be statistically meaningful — anything less produces confidently wrong conclusions.
A 220-truck regional fleet finds $184K on the table
Consider a 220-power-unit regional fleet running mixed-service lanes, spending roughly $1.2M per year on tires (purchase, retread, repair, disposal). Here is what a structured peer-group comparison surfaced over 18 months.
| Brand & Model | Position | Miles to Removal | Cost per Mile | Retread Yield | Blowouts / 100 Tires |
|---|---|---|---|---|---|
| Bridgestone R268 | Drive · Highway | 312,000 | $0.0141 | 78% | 1.2 |
| Michelin XDN2 | Drive · Highway | 328,000 | $0.0158 | 84% | 0.8 |
| Hankook AH35 | Drive · Highway | 301,000 | $0.0119 | 71% | 1.6 |
| Goodyear FuelMax SS | Steer · Regional | 168,000 | $0.0202 | 62% | 0.9 |
| Yokohama 101ZL | Steer · Regional | 171,000 | $0.0171 | 66% | 1.1 |
| Continental HS3 | Drive · Regional | 247,000 | $0.0133 | 74% | 1.3 |
The Hankook AH35 drive tire ran within 4% of the Bridgestone R268 on miles to removal but delivered a 15.6% lower cost per mile. Retread yield was lower, but net cost per mile still favored Hankook by a wide margin on highway drive positions.
On steer positions, the Yokohama 101ZL matched the Goodyear FuelMax SS on miles to removal while cutting cost per mile by 15.3% — a direct peer-group win in the regional steer lane.
By reallocating steer spend to Yokohama and drive spend to a Hankook / Michelin split, the fleet reduced annual tire spend by an estimated $184,000 — a 15.3% reduction — with zero change in blowout frequency and no uptick in roadside events.
Your tire data is already sitting in your shop. Let's turn it into leverage.
See your brand and model performance roll up across the fleet with peer-group filtering and statistical confidence indicators — in Oxmaint.
Tire brand comparison, answered
How many tires do I need in a peer group before the comparison is statistically valid?
A useful rule of thumb is at least 30 removals per brand per position per route profile over a 12-month window — ideally 24 months. Below that threshold, a single bad batch, one abusive driver, or a seasonal route change can swing the numbers enough to produce a confidently wrong conclusion. Oxmaint flags peer groups with low sample sizes so you do not act on noise.
Should I just buy the cheapest tire that meets the spec?
No. Purchase price is typically less than half of total tire cost per mile once retread yield, repair frequency, and fuel efficiency contribution are factored in. A $360 tire that retreads zero times can cost more per mile than a $480 tire that retreads twice. The goal is lowest cost per mile with acceptable safety — not lowest sticker price.
Can I compare brands across different route profiles if I normalize the data?
Normalization helps, but it cannot fully isolate the tire variable when operating conditions differ materially. A highway lane and a regional lane impose fundamentally different wear patterns — heat cycles, brake frequency, curb impacts. Hold the route profile constant, then compare. To set up your peer groups properly, Book a Demo and we will walk through your fleet's structure.
How does Oxmaint handle retread tracking across brands?
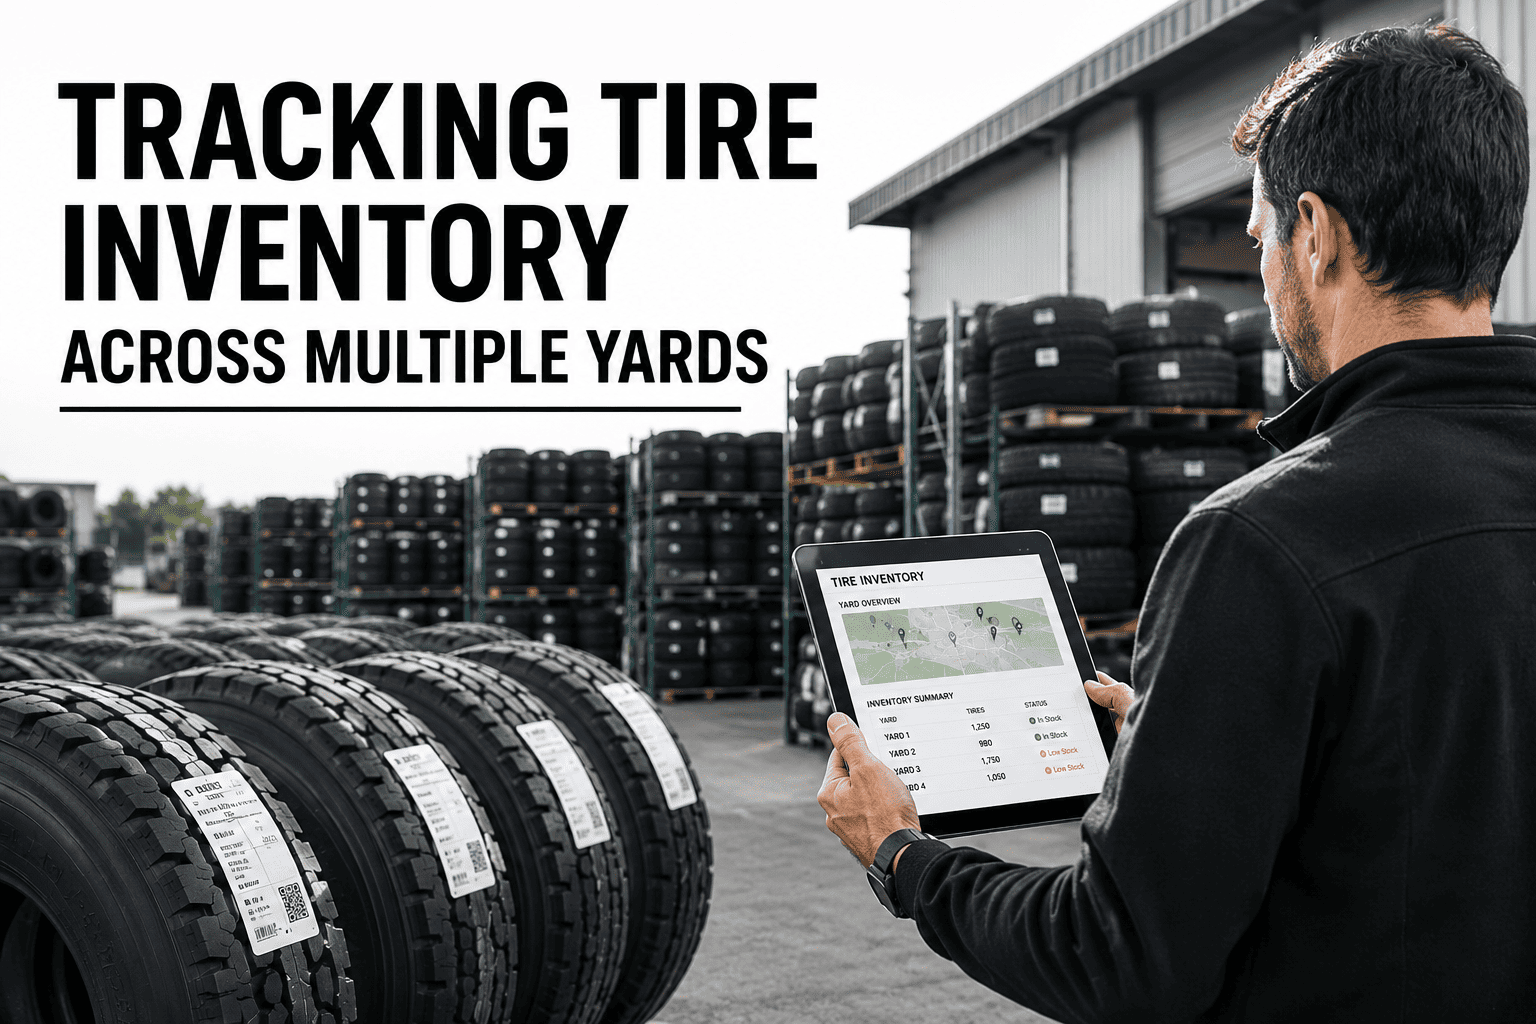
Every casing is tracked from new-tire installation through each retread cycle, with brand, model, position, route, and removal reason recorded at every step. Retread yield, casing rejection reasons, and post-retread miles to removal all roll up into the brand performance view — so you see the full lifecycle cost, not just first-life tread wear.
What if my fleet is too small to generate meaningful brand comparisons?
Small fleets can still benefit by narrowing the comparison to one or two high-volume positions and extending the analysis window to 24–36 months. You can also benchmark against industry peer data for similar route profiles and vehicle classes. The key is to avoid over-rotating on a single season's results — small samples lie loudly.
Stop trusting the spec sheet. Start trusting your fleet.
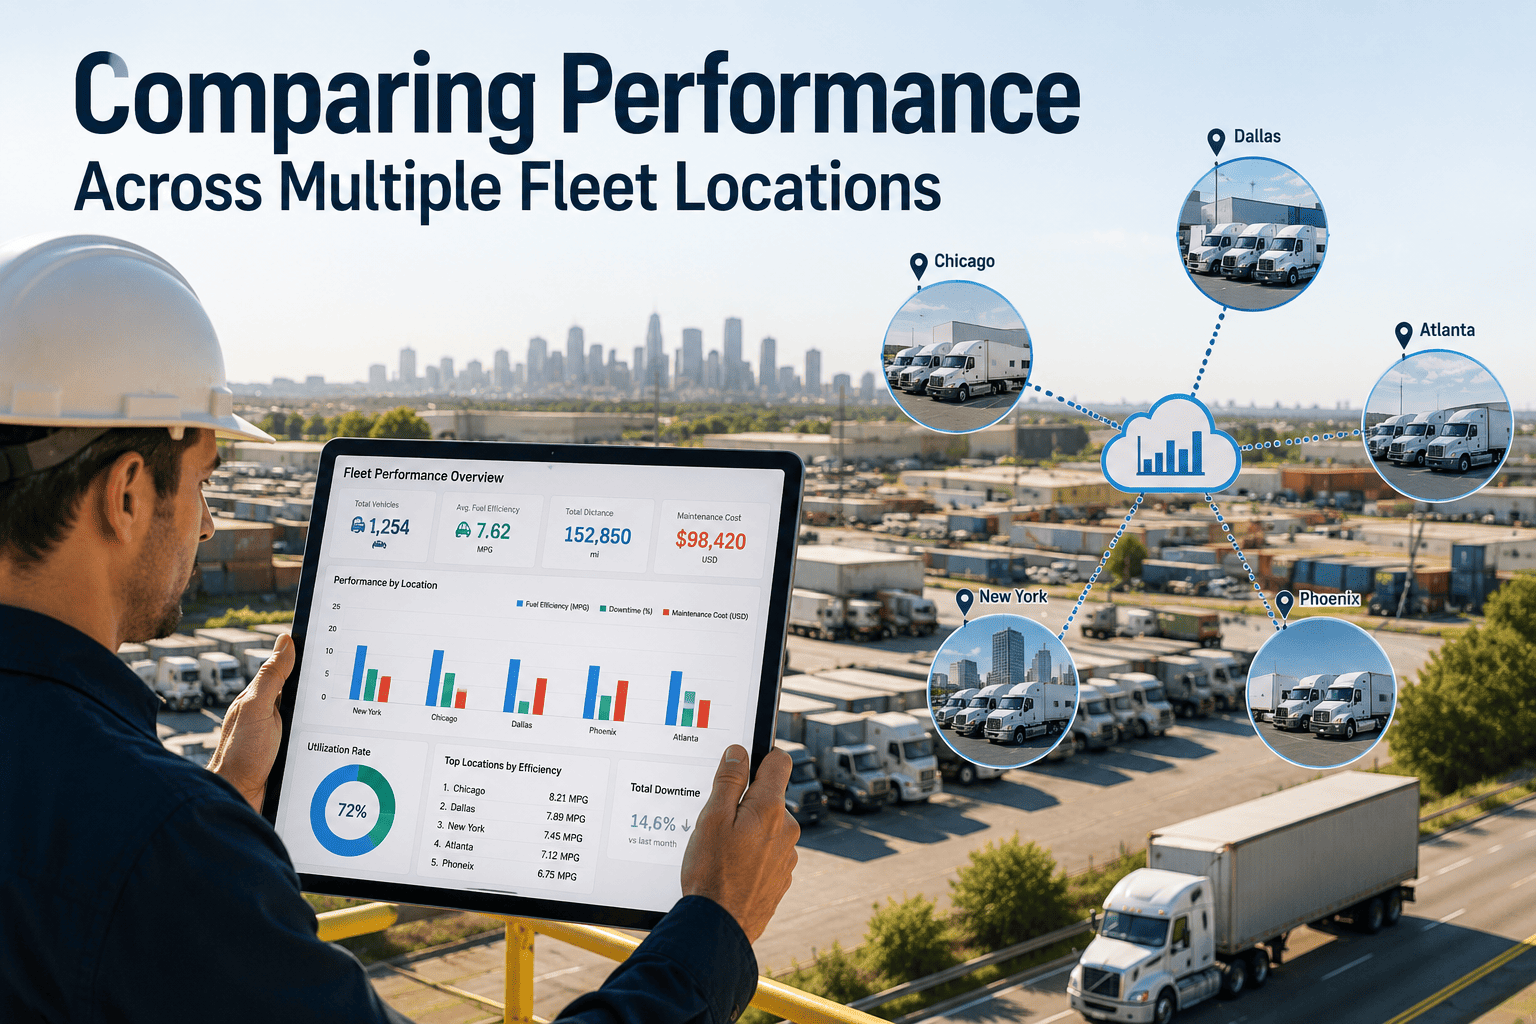
Brand and model performance rolls up across your fleet with peer-group filtering and statistical confidence indicators — built for fleet managers who make decisions with data, not marketing.
Free 14-day trial · No credit card
.png)