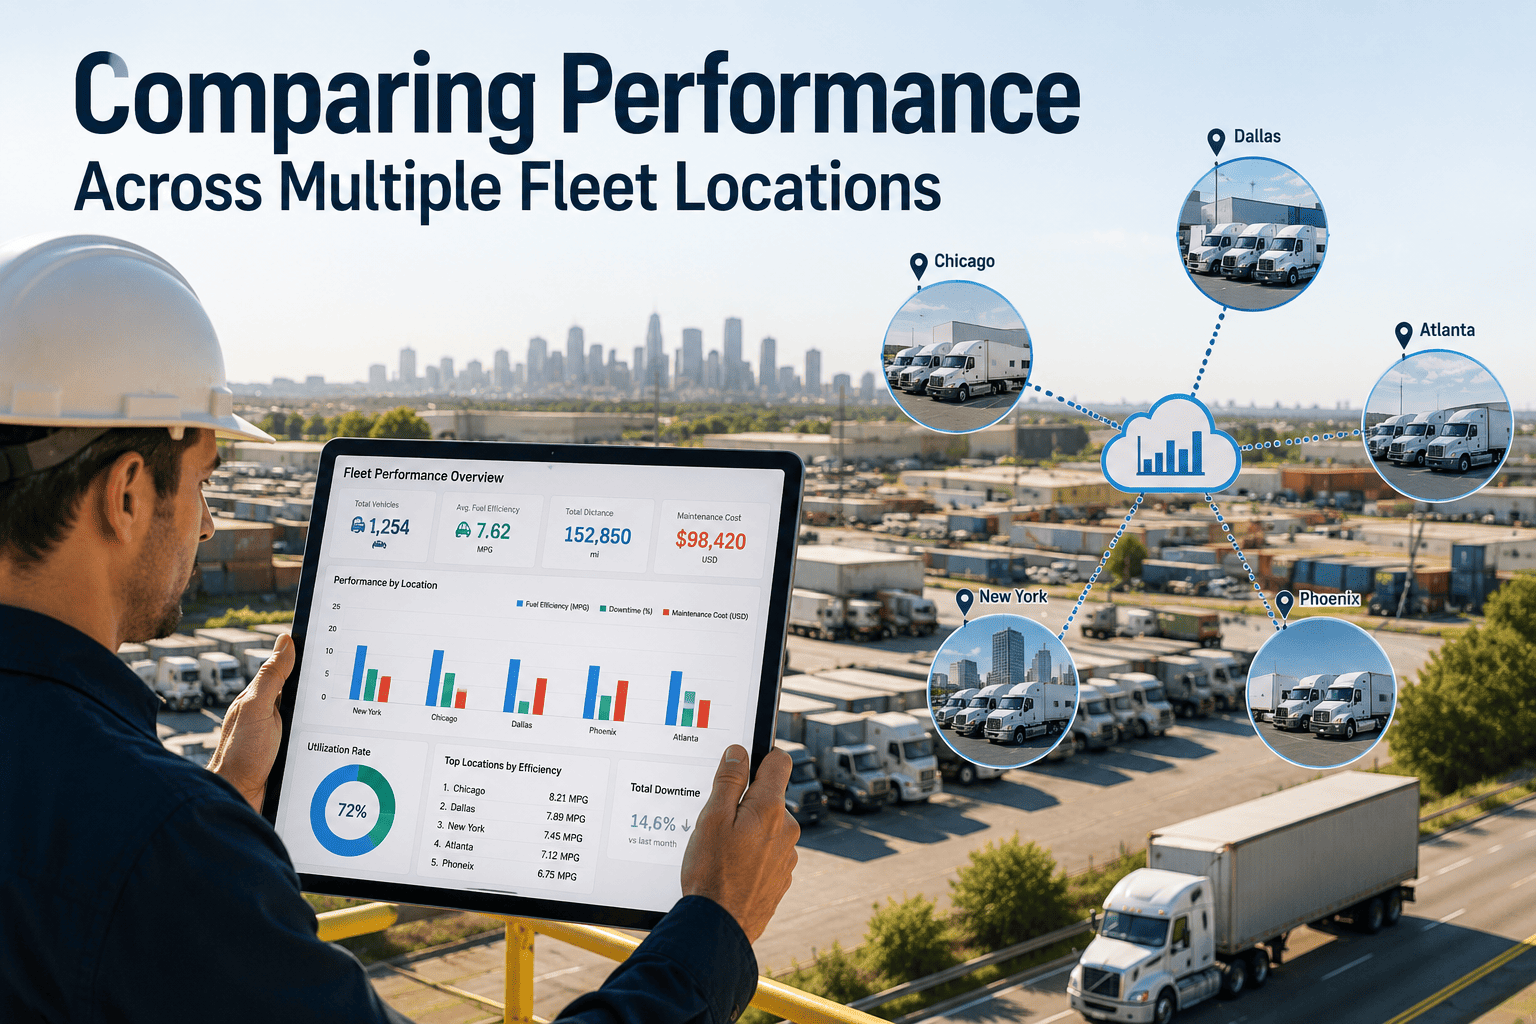
Running a fleet across multiple depots, terminals, or regions means aggregate numbers can mask serious localized problems — one underperforming yard can quietly inflate cost-per-mile, drive up unscheduled downtime, and erode compliance across the entire operation. Multi-location fleet comparison surfaces exactly which yards lead and which lag by normalizing PM compliance, breakdown frequency, MTTR, shop utilization, technician productivity, and cost-per-mile against true peer groups. This guide walks through the six dimensions that matter, how to normalize for age and duty cycle, and how to propagate best practices from your top yard to your tail. Ready to rank your locations? Start Free Trial and get a multi-location dashboard live in days.
Which of your yards is quietly dragging the fleet down?
A 25-truck variance in unscheduled breakdowns between your best and worst depot is a repairable gap — not a coincidence. Internal benchmarking across your own locations controls for spec, customer mix, and policy, making the comparison sharper than any external industry dataset.
A 96% fleet-wide PM rate can hide a 71% yard
When a 280-asset fleet reports a 96% PM compliance rate, corporate feels confident. But slice that number by location and the picture changes: three yards run at 99%, two hover at 88%, and one sits at 71%. That bottom yard isn't a rounding error — it's the source of 38% of your unscheduled breakdowns despite holding 14% of the assets.
Metrics you must compare per location — not in aggregate
These six dimensions form the minimum viable comparison set. Each is normalized per yard and tracked month-over-month so a trend — not a snapshot — drives the conversation.
PM Compliance Rate
Percentage of scheduled preventive maintenance events completed within the compliance window (typically ±5 days of due date). Target: 95%+ per yard. A yard below 85% is a leading indicator of downstream breakdown spikes within 30–60 days.
Breakdown Frequency per 100K Miles
Unscheduled road calls and disablements normalized by mileage. A highway yard running 11K miles per asset per month will look different from a local P&D yard at 4K — peer grouping is what makes the number meaningful.
Mean Time To Repair
Hours from work-order open to vehicle returned to service. A yard with 14-hour MTTR versus a peer-group median of 7 hours signals a skill gap, parts stocking issue, or bay-capacity constraint worth diagnosing immediately.
Shop Utilization
Percentage of available shop hours spent on wrench-turning labor versus idle or administrative time. Below 55% suggests scheduling gaps; above 90% with rising MTTR means the yard is bottlenecked and needs additional capacity.
Technician Productivity
Flagged labor hours divided by clocked hours. The fleet median is typically 68–75%; a yard below 60% combined with high MTTR usually points to skill mismatch or insufficient diagnostic tooling rather than technician effort.
Cost per Mile
Total maintenance and repair cost — labor, parts, outside vendor, and tire — divided by miles dispatched. The bottom-quartile yard in a normalized peer group typically runs 15–22% above median, a gap directly traceable to the five dimensions above.
Apples-to-apples: peer-group filtering is non-negotiable
A yard running 8-year-old day-cabs on urban P&D routes at 45,000 miles per year cannot be compared to a yard running 18-month-old sleeper tractors on interstate linehaul at 125,000 miles per year. Normalization is what turns raw numbers into signal.
Group yards that share at least three of four attributes. A yard running 2018–2021 highway tractors on regional routes is only comparable to another yard with the same profile — never to a mixed-fleet urban depot.
An index of 100 equals the peer median. A yard at 120 on breakdown frequency is 20% worse than its true peers; a yard at 78 on cost-per-mile is 22% better. This single number makes rankings defensible.
A 420-asset fleet operating across seven yards ran an unnormalized ranking and concluded its Texas depot was the worst performer. After peer-group filtering — controlling for the fact that Texas ran the oldest trucks (avg 6.8 years) on the heaviest duty cycle — the index recalculated. Texas moved from worst to third. The real underperformer was the Ohio yard, running nearly new equipment yet posting 20% higher unscheduled breakdown frequency than its true peers. The root cause: a parts-availability gap with the local vendor, not technician skill.
A single snapshot ranks; a six-month trend diagnoses
Ranking locations on a single month's data is a starting point — but the real diagnostic power comes from watching a yard's index move across six months. A yard trending from 102 to 118 to 131 on MTTR is a slow-motion failure you can intervene in before it hits the bottom line.
Yard 4 PM compliance index — a 30-point slide over six months. The intervention window opened in Month 3 and closed by Month 5.
What a normalized yard ranking actually looks like
Below is a representative multi-location comparison after peer-group normalization. Index values are relative to peer median (100). Anything above 110 on a cost or failure metric is a flag; anything above 130 is an intervention.
| Yard | Peer Group | PM Compliance | Breakdown / 100K mi | MTTR (hrs) | Shop Util. | Tech Productivity | Cost / Mile |
|---|---|---|---|---|---|---|---|
| Yard A — Phoenix | Highway, 2021–2024 | 99% | 0.8 | 6.2 | 74% | 78% | $0.14 |
| Yard C — Denver | Highway, 2021–2024 | 97% | 1.1 | 9.4 | 81% | 72% | $0.16 |
| Yard B — Atlanta | Regional, 2018–2021 | 88% | 1.9 | 11.8 | 67% | 64% | $0.17 |
| Yard D — Memphis | Highway, 2021–2024 | 79% | 2.6 | 14.5 | 91% | 61% | $0.19 |
Yard D runs the same spec and duty cycle as Yards A and C, yet posts 3.25x the breakdown frequency and 2.3x the MTTR. This is a diagnosable, repairable gap — not a geographic excuse.
When a yard runs 20% worse than peers, where do you look?
A normalized 20% gap in breakdown frequency has four likely root causes. Drill-through from the dashboard to individual work orders and vehicles is what turns a ranking into a repair plan.
Insufficient PM Staffing
Yard D's shop utilization at 91% looks healthy until you notice MTTR climbing — the crew is saturated. Adding one PM technician or rebalancing the schedule to off-peak windows typically recovers 8–12 compliance points within 60 days.
Technician Skill Gap
If 60% of work orders at the underperforming yard are for brake and electrical systems but the crew's certifications skew toward powertrain, MTTR inflates. A targeted 40-hour training cycle on the gap areas usually closes 30–40% of the MTTR differential.
Parts Availability
When average parts-wait time exceeds 6 hours at one yard versus 2.1 hours at peers, vendor stocking levels or min-max thresholds are off. Adjusting reorder points for the top 50 failure parts typically cuts MTTR by 3–5 hours within a quarter.
Geographic / Route Factor
If peer-group filtering is done correctly this should be minimal — but mountain grades, extreme heat, or congestion corridors add stress. When geography is the true driver, the index should reflect it and the yard should be re-peered, not penalized.
"Yard X does it this way" beats "industry benchmark says…"
Internal cross-location benchmarking is more actionable than external industry data because it controls for company-specific factors — same equipment specs, same customer mix, same maintenance policies, same ERP. When a regional manager can point to a concrete process at Yard A and replicate it at Yard D, change happens in weeks, not quarters.
We spent three years chasing external benchmarks that never quite fit our operation. When we started ranking our own seven yards against each other on normalized indices, we found that Yard A's PM scheduling approach — a simple 72-hour pre-due reminder with bay reservation — cut their breakdown frequency by 31%. We rolled it to four other yards in 90 days and recovered $340K in annual repair spend.
See every yard ranked against your fleet median — today
Oxmaint's multi-location dashboards support unlimited yard hierarchies, peer-group filtering, and month-over-month trend comparison with drill-through to individual work orders and vehicles.
Multi-location fleet comparison, answered
Why is internal cross-location benchmarking more useful than external industry data?
External benchmarks don't control for your equipment specs, customer mix, duty cycles, or maintenance policies — so the comparison always has an excuse attached. When you benchmark Yard D against Yard A within the same fleet, the only variables left are local execution: staffing, skill, parts, and process. That makes the gap diagnosable and the fix replicable.
How do I normalize comparison when my yards run different equipment ages and route types?
Build peer groups using at least three of four attributes: asset age band, duty cycle, route profile, and spec family. Only compare yards within the same peer group, then express each yard's metric as an index against the peer median (100). A yard at 120 on breakdown frequency is 20% worse than its true peers — that's a defensible number. You can Start Free Trial to configure peer groups and see your indices in the first session.
What's the minimum number of yards needed for meaningful comparison?
Three yards in the same peer group give you a median and a range; five gives you a quartile spread worth acting on. Below three, you're comparing rather than benchmarking — still useful for trend tracking, but you won't get the tail-analysis that drives the biggest savings. Fleets with two yards can still benefit from month-over-month self-comparison.
How often should I re-rank locations, and what timeframe matters most?
Rank monthly, but weight the trailing three-month trend more heavily than any single month. A yard that spikes from index 98 to 124 in one month may have had a one-time event; a yard trending 98 → 108 → 118 → 131 over four months is a structural problem. Book a demo to see how Oxmaint surfaces trend trajectories alongside the current ranking.
What should I do when the bottom-quartile yard is also the one running the oldest equipment?
That's exactly what peer-group filtering solves. If the yard is re-peered with other yards running similar-age equipment on similar duty cycles and still ranks at the bottom, the gap is execution, not age. If it ranks mid-pack after re-peering, the issue was your grouping — not the yard. Either way, the normalized index gives you a defensible answer.
Rank your yards. Fix the tail. Recover the spend.
Unlimited yard hierarchies, peer-group filtering, month-over-month trend comparison, and drill-through to every work order — all in one dashboard.
Free 14-day trial · No credit card





.png)