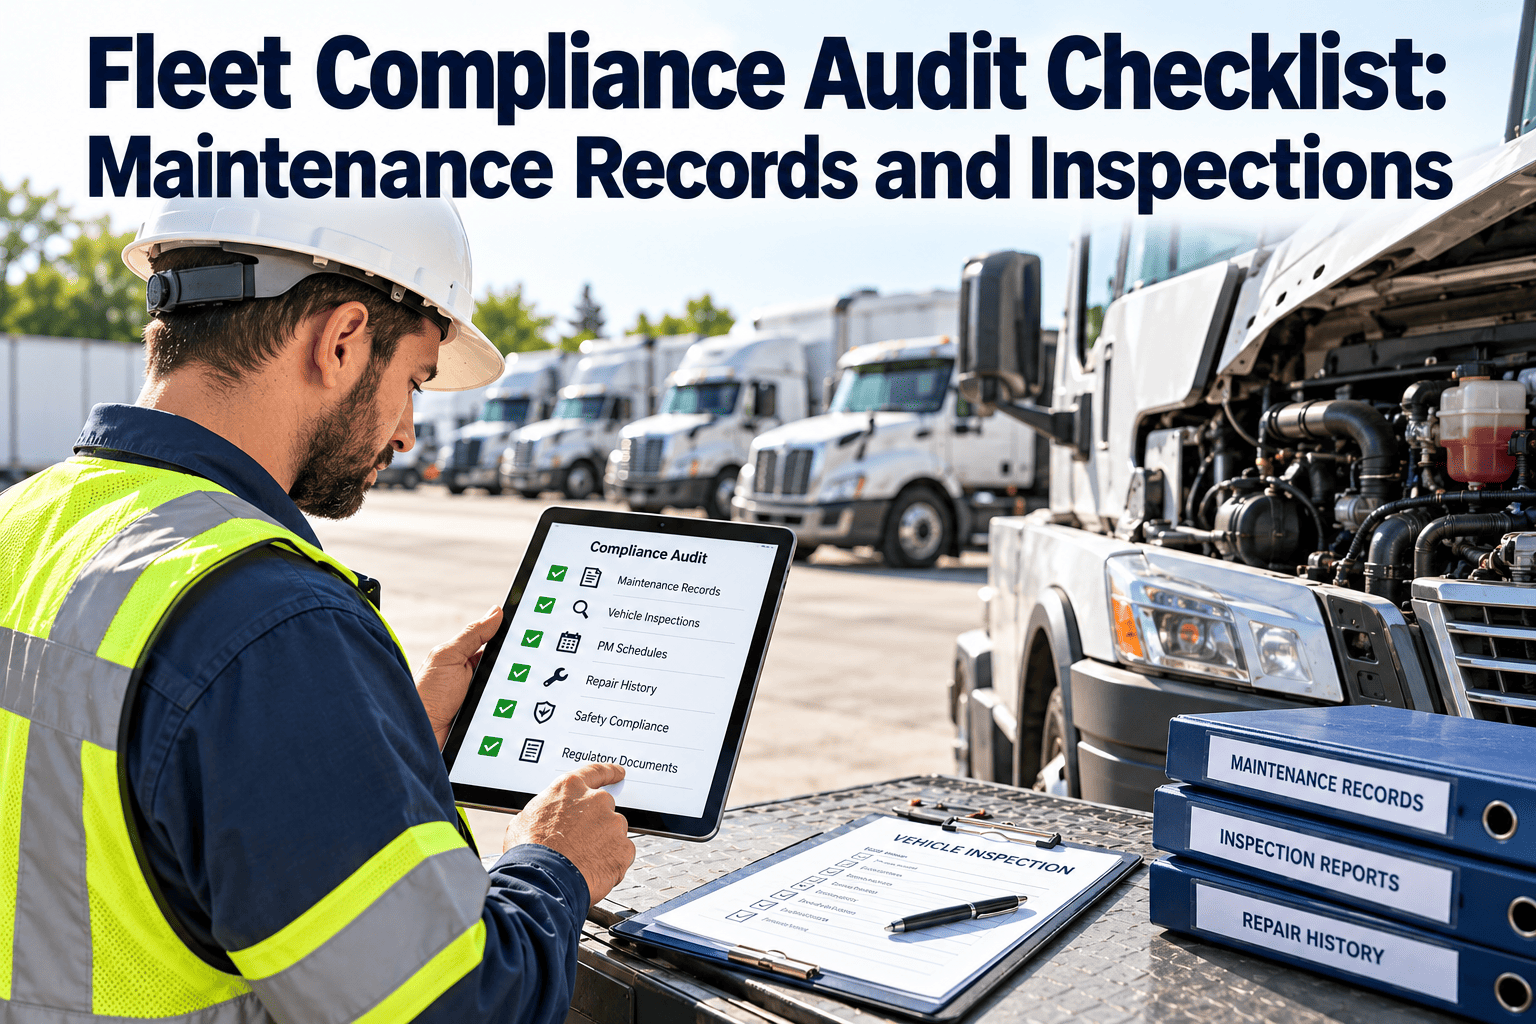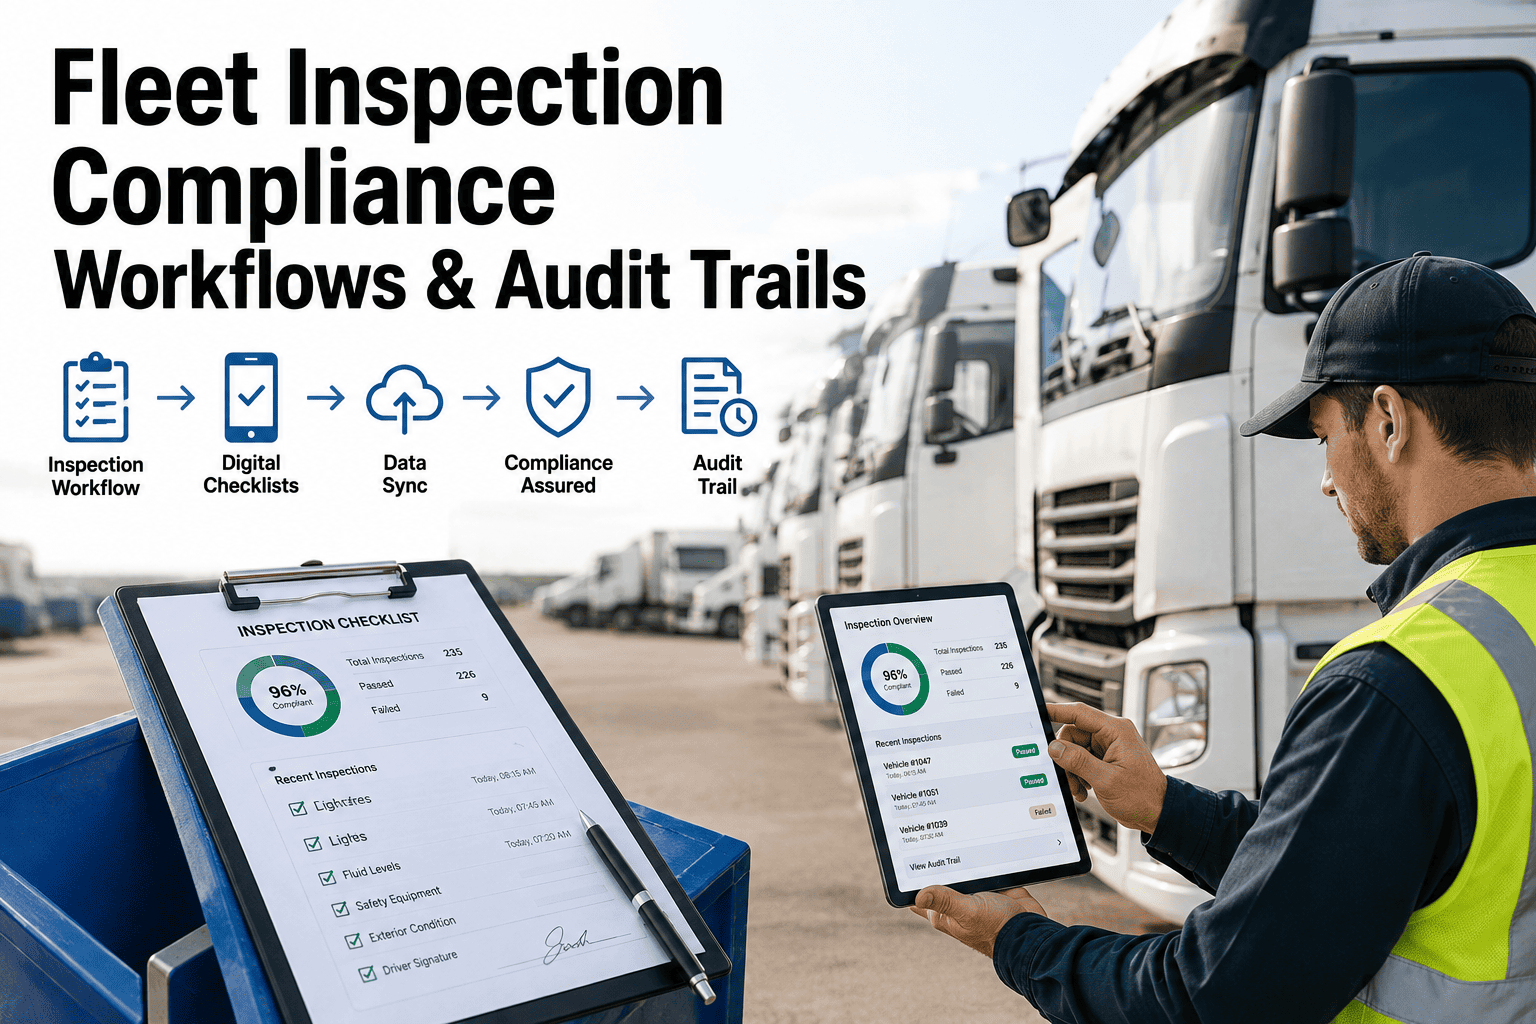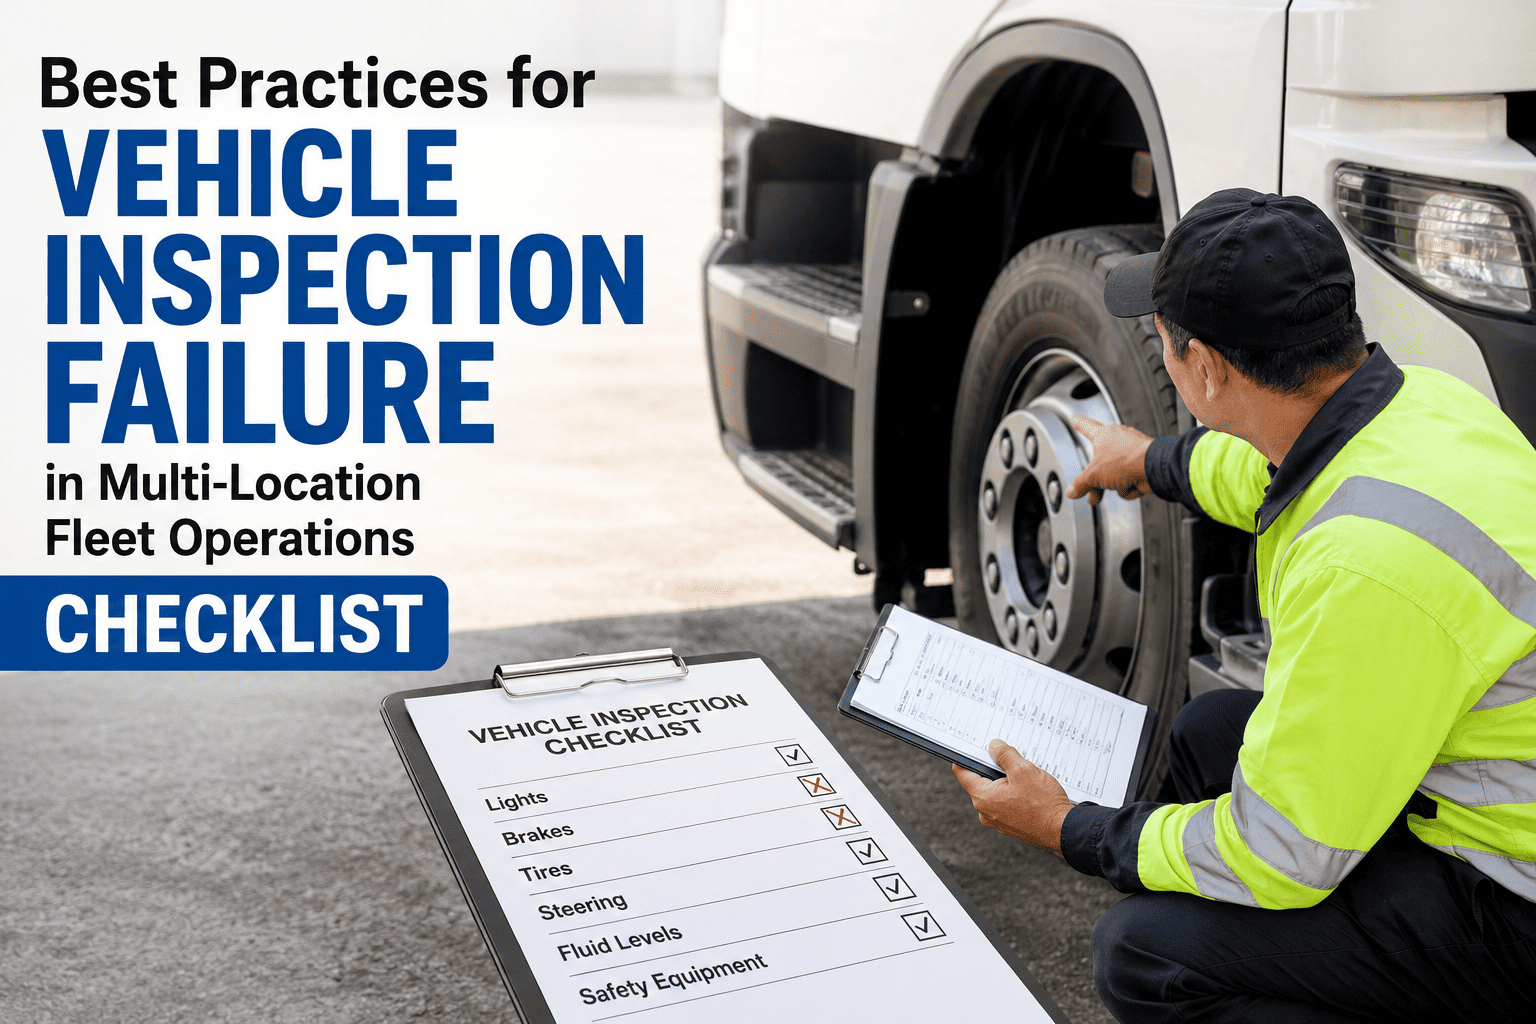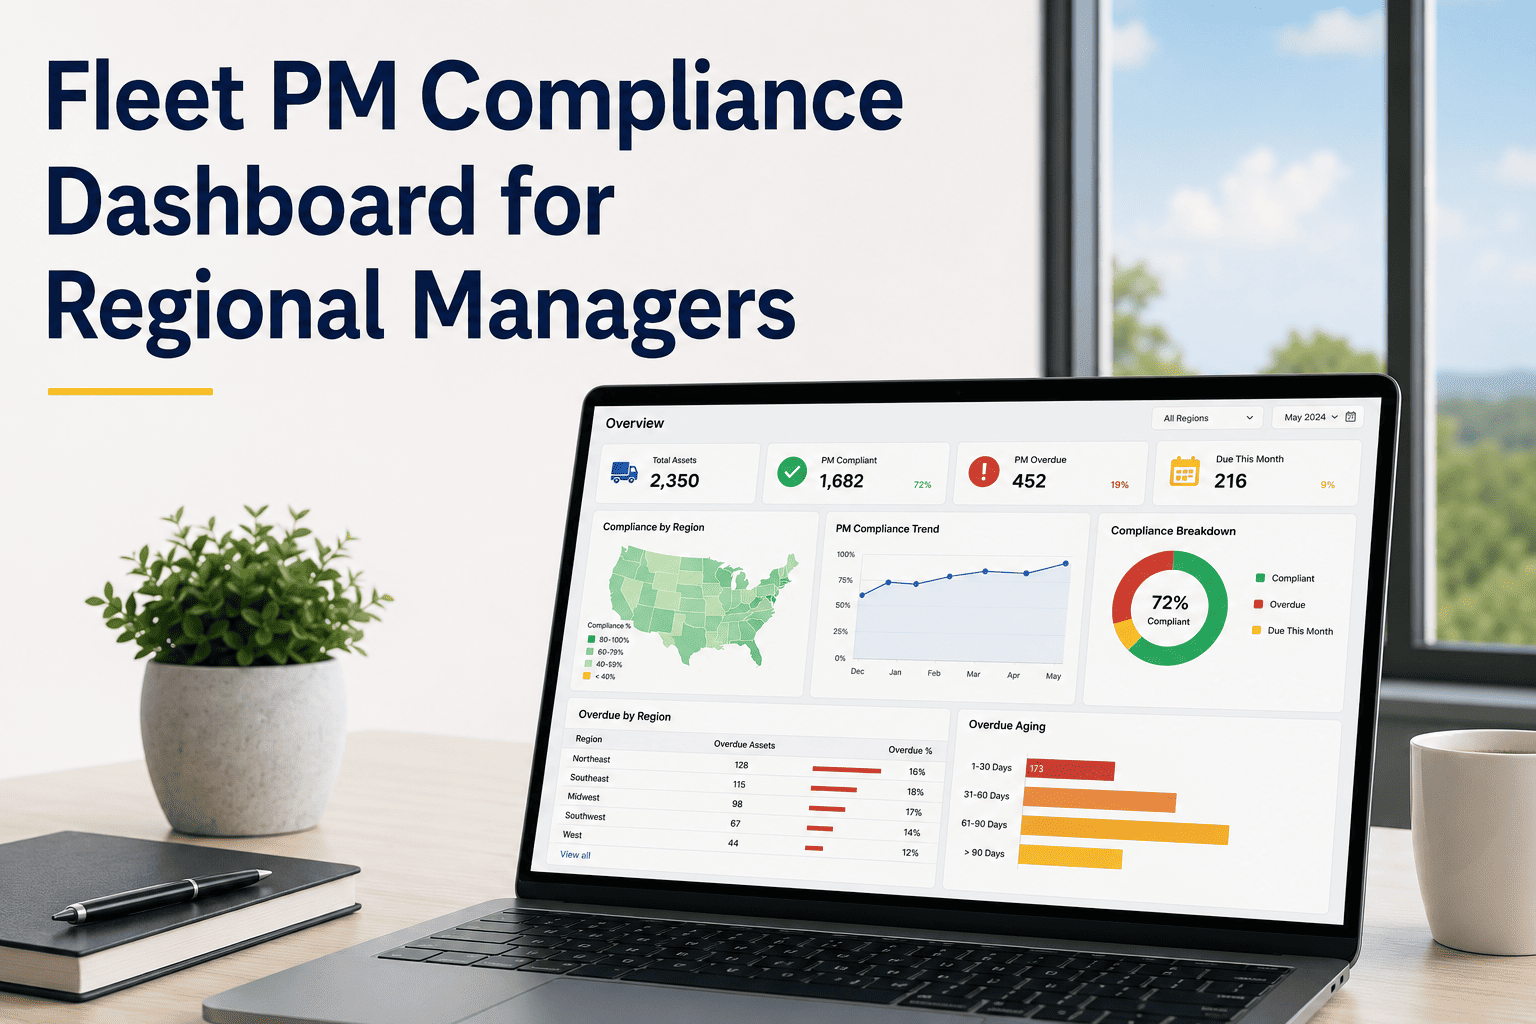
One yard runs a tight inspection program with defects caught before dispatch every morning. Another yard, thirty miles down the road under the same company name, is quietly pencil-whipping its way through DVIRs and nobody at headquarters knows it yet. This is the normal state of multi-terminal fleets, not the exception, because compliance culture is set locally by whoever is running the yard that week, not by the policy manual sitting in a folder at corporate. Without a way to compare terminals side by side, the gap between your best yard and your worst yard stays invisible until an audit, a crash, or a CSA score spike forces the comparison. Start a free trial with Oxmaint to see where every one of your terminals actually stands.
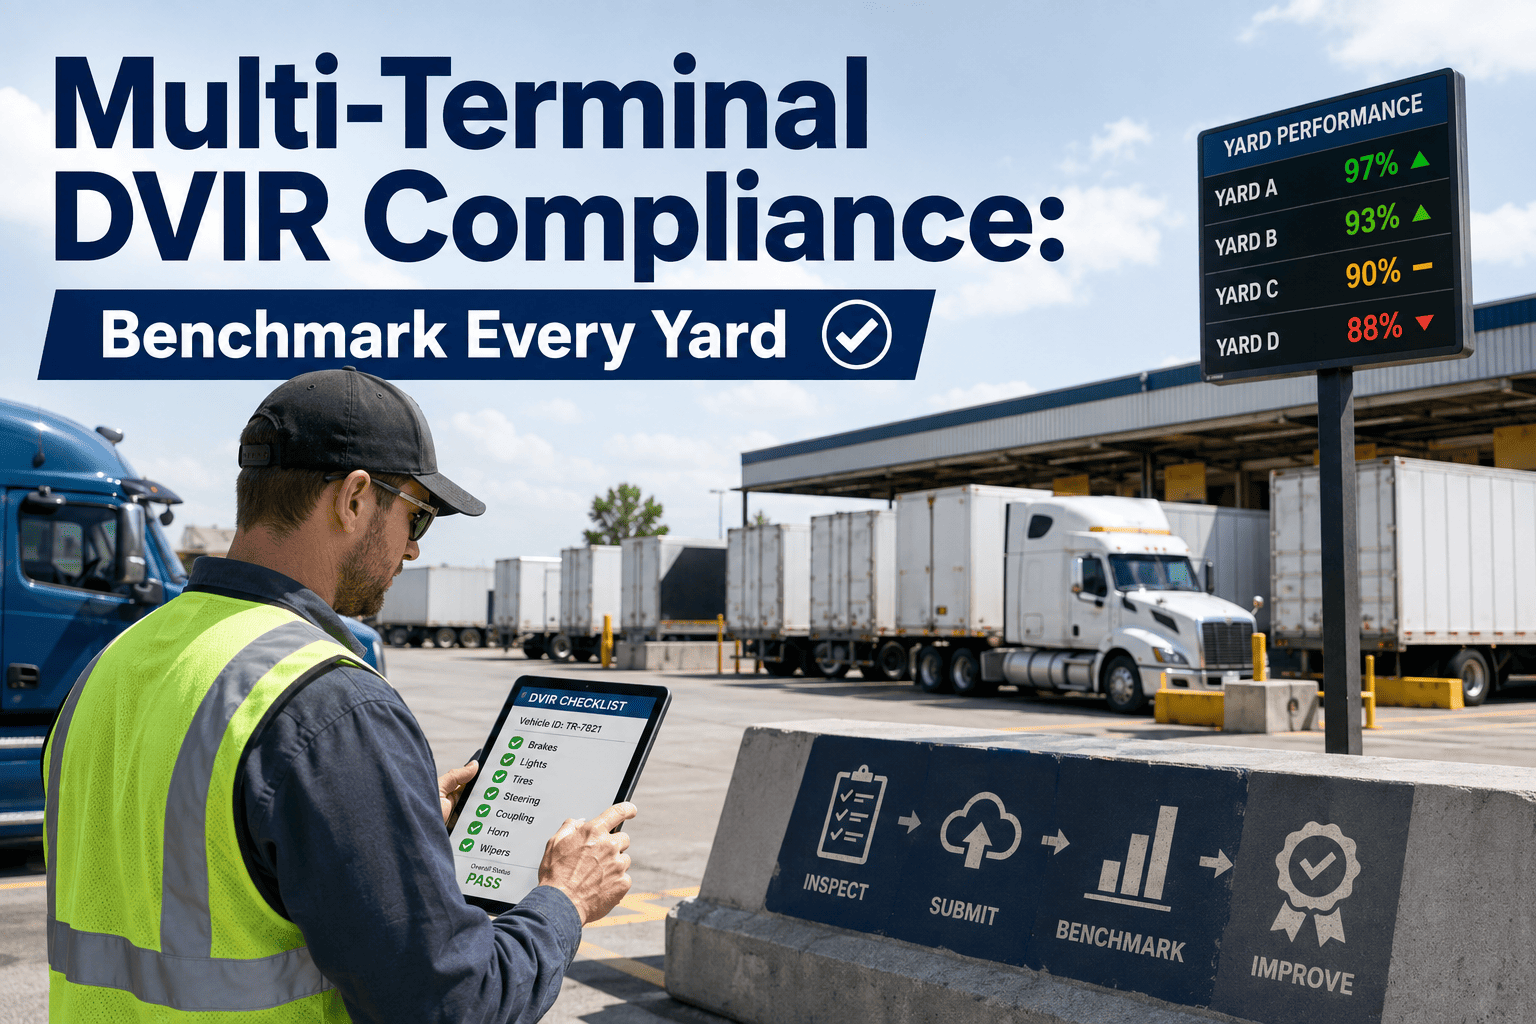
Multi-Terminal DVIR Compliance: Benchmark Every Yard
DVIR compliance varies wildly by yard, sometimes inside the same company. Here is how to baseline every terminal, rank them honestly, and bring underperformers up to standard within 90 days.
Why Fleet-Wide Averages Hide Your Biggest Compliance Risk
Most fleet compliance dashboards report a single number: overall DVIR completion rate, overall violation count, overall CSA score contribution. That number feels reassuring when it looks healthy, but it is an average, and averages are exactly the kind of metric that hides a serious problem inside a handful of locations while the rest of the network performs well. A fleet with twelve terminals where eleven are excellent and one is quietly failing will still show a strong company-wide number, right up until the failing terminal gets audited on its own.
Terminal-level variance happens for reasons that have nothing to do with company policy. A yard with a strong, tenured shop foreman enforces inspection discipline as a matter of local culture. A yard that just lost its foreman to another company, or that is running with a temporary manager, drifts toward shortcuts within weeks. Without terminal-by-terminal visibility, that drift is invisible from headquarters until it shows up as a cluster of violations tied to a single location code, at which point the fix costs far more, in both time and reputation, than it would have if the trend had been caught three months earlier.
4 Steps to Baseline and Rank Every Terminal Honestly
Start with DVIR completion rate, average inspection duration, defect discovery rate, and roadside violation count for each yard individually, not blended into a fleet-wide figure. Ninety days is enough to smooth out short-term noise, like a single bad week caused by a staffing gap, while still reflecting current conditions rather than ancient history from a year ago.
A 15-truck terminal and a 150-truck terminal cannot be compared on raw violation counts. Convert every metric to a per-vehicle or per-hundred-inspection rate so a small yard with three problems does not look artificially worse than a large yard with thirty, and so a genuinely strong small terminal gets credited fairly against a much larger location.
Rank against your own fleet's median performance, not an industry-wide benchmark. Your best-performing terminal sets a realistic internal target that other locations can actually reach, rather than an external number that may not reflect your equipment, routes, or the regulatory environment of the states you operate in.
Terminals in the bottom quartile get a specific, time-bound improvement target and a named owner accountable for it, reviewed monthly rather than left to self-correct on an undefined timeline that quietly slips past ninety days into a full quarter or longer.
What Corporate Misses When Every Terminal Rolls Into One Number
A fleet-wide compliance dashboard is built for reassurance, not for finding problems. It tells leadership the network as a whole is healthy, which is true right up until a regulator, an insurer, or a plaintiff's attorney asks a much narrower question: what was happening specifically at the terminal the failed vehicle came out of. At that point, a single blended number stops being useful and the absence of terminal-level history becomes a liability of its own, because it suggests nobody was watching closely enough to notice.
Insurance underwriters increasingly ask for location-level safety data during renewal, not just fleet totals, because they know variance by yard is a better predictor of future claims than an averaged number. Fleets that can produce a clean terminal-by-terminal breakdown on request are treated differently in underwriting conversations than fleets that can only offer a single company-wide figure and have to explain, after the fact, which location was actually involved in a claim, a conversation that almost never goes well when it happens for the first time during a renewal negotiation.
What a Terminal Compliance Comparison Actually Looks Like
| Terminal | DVIR Completion Rate | Avg Inspection Duration | Defect Discovery Rate | Status |
|---|---|---|---|---|
| Terminal A — Dallas | 98% | 4.6 min | 1 in 12 inspections | Above median |
| Terminal B — Phoenix | 96% | 4.1 min | 1 in 15 inspections | Above median |
| Terminal C — Fresno | 91% | 2.8 min | 1 in 40 inspections | At median |
| Terminal D — Reno | 84% | 1.1 min | 1 in 110 inspections | Flagged, below median |
| Terminal E — Tucson | 94% | 3.9 min | 1 in 18 inspections | Above median |
Terminal D in this example has a completion rate that looks acceptable in isolation, 84 percent is not a disaster on its own. What exposes it is the combination of a duration well below every other yard and a defect discovery rate nearly ten times lower than the fleet average, the classic signature of a location where inspections are being signed rather than performed.
What Actually Fixes a Flagged Terminal in 90 Days
Once a terminal is identified as an underperformer, the fix rarely requires new equipment or a policy rewrite. It usually requires the same three things applied consistently: a named local owner who sees their own ranking, a specific numeric target rather than a vague instruction to "do better," and a monthly check-in that continues past the point where early improvement makes it tempting to stop paying attention. Terminals that regress after an initial improvement almost always do so because the monitoring stopped once the number looked acceptable, not because the underlying culture actually changed.
Regional managers who review terminal rankings as a routine part of their monthly cadence, rather than only after an incident, catch drift while it is still a coaching conversation instead of a documented violation pattern. The terminals that stay consistently compliant over multiple years are, without exception, the ones where local leadership can see their own standing against the rest of the fleet at any time, not just when corporate decides to run a report, and where a slipping number gets a conversation long before it gets a violation.
Stop Relying on a Single Fleet-Wide Compliance Number
Oxmaint breaks every compliance metric down by terminal, route, shift, and vehicle, so the yard that is quietly dragging down your fleet average shows up on a report instead of an audit finding. Rank every location honestly and fix problems before they become violations.
6 Reasons One Terminal Underperforms While Others Don't
The causes behind a lagging terminal are rarely a single dramatic event. More often it is a combination of small, ordinary conditions that compound over a few months until the gap between that yard and the rest of the fleet becomes wide enough to show up on a ranking report. Spotting the pattern early is almost always cheaper than fixing the violation history it eventually produces.
Inspection discipline is often enforced by a single strong local leader. When that person leaves, standards drift within weeks unless a formal process, not personality, is holding the yard together.
Terminals running lean on overnight supervision see completion quality drop first on the shift with the least oversight, often long before daytime metrics show any change.
A terminal that trains new drivers informally, rather than against a documented inspection standard, produces inconsistent habits that compound as driver turnover increases at that location.
Yards running older equipment generate more real defects, which paradoxically can make under-reporting easier to hide inside a plausible-looking baseline of expected issues.
Remote terminals visited quarterly rather than monthly by regional management tend to drift further from policy simply because the feedback loop is longer.
Terminals where compliance data flows up to corporate but is never shown back to the local team lose the sense of accountability that comes from seeing your own numbers.
How Oxmaint Benchmarks Every Yard Automatically
Benchmarking should not require a spreadsheet exported and rebuilt by hand every quarter. It should be a live view that updates as inspections happen, so a terminal starting to drift shows up in weeks rather than being discovered at the next scheduled review. The features below are the pieces that make ongoing benchmarking practical for a fleet running more than a handful of yards.
Every DVIR, work order, and violation is tagged to its originating terminal automatically, so location-level reporting requires no manual data reconciliation.
Terminals are ranked against the fleet median with fleet size and vehicle age normalized, so small and large yards are compared fairly on the same scale.
When a terminal's rolling average inspection duration or defect rate moves outside its own historical range, a regional manager is alerted before the pattern becomes a violation.
Set a specific target for any flagged terminal and track its progress against that target on a rolling basis, with the assigned owner visible on the dashboard.
Identify whether a compliance problem is tied to a location, a shift, or a small group of specific drivers who happen to work at that yard.
Group terminals by region or district for leadership reviews, generating a single report that still preserves terminal-level detail underneath it.
Results Fleets See After Benchmarking Every Terminal
The value of terminal-level benchmarking compounds over time. Early cycles mostly surface which yards need attention, while later cycles show the gap between the best and worst locations steadily narrowing as flagged terminals close in on the fleet median rather than drifting further away from it.
Frequently Asked Questions
How many terminals does Oxmaint need to make benchmarking useful?
Benchmarking adds value starting at two locations, since even a single comparison point exposes gaps a fleet-wide average would hide. Most value grows as more terminals are added to the comparison set, since a larger sample makes it easier to tell a genuine outlier from normal week-to-week variation.
Can we compare terminals of very different sizes fairly?
Yes. Metrics are normalized per vehicle and per hundred inspections rather than compared as raw counts, so a 15-truck yard and a 150-truck yard sit on the same scale. Book a demo to see normalization settings.
Does the platform alert us automatically when a terminal starts to drift?
Yes. Rolling averages are tracked per terminal, and a location moving outside its own historical range triggers an alert to the assigned regional manager, giving them weeks of lead time to intervene before the pattern becomes a documented violation during an inspection or audit.
Can we set different improvement targets for different terminals?
Yes. Each flagged terminal gets its own target based on its starting point and fleet role, tracked on a rolling basis with a named owner accountable for progress. Start a free trial to configure targets.
Will local terminal managers see their own ranking?
Yes, and that visibility is deliberate. Terminals that can see their own standing against the fleet median tend to close performance gaps faster than ones that only receive corrected instructions from headquarters, because the ranking itself becomes a local motivator rather than an external mandate.
Find the Terminal That's Quietly Dragging Down Your Fleet
Oxmaint benchmarks every yard automatically, normalizes for size and vehicle age, and alerts regional managers the moment a terminal starts to drift. Stop discovering your weakest location during an audit, start seeing it on a dashboard, free trial, no credit card required.