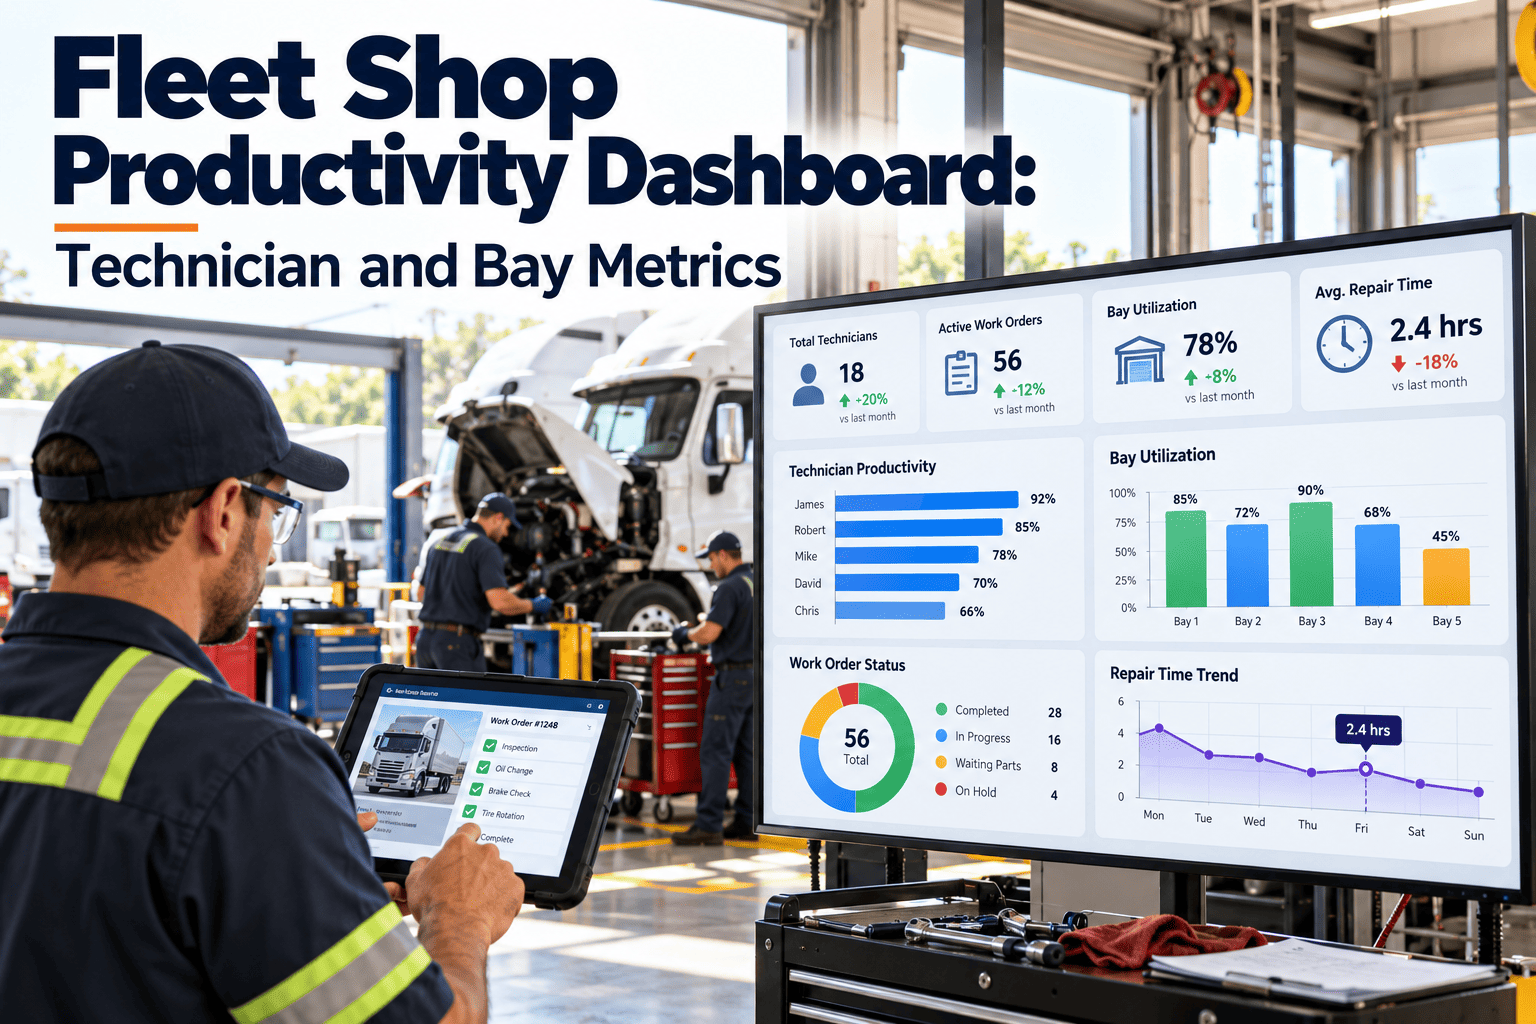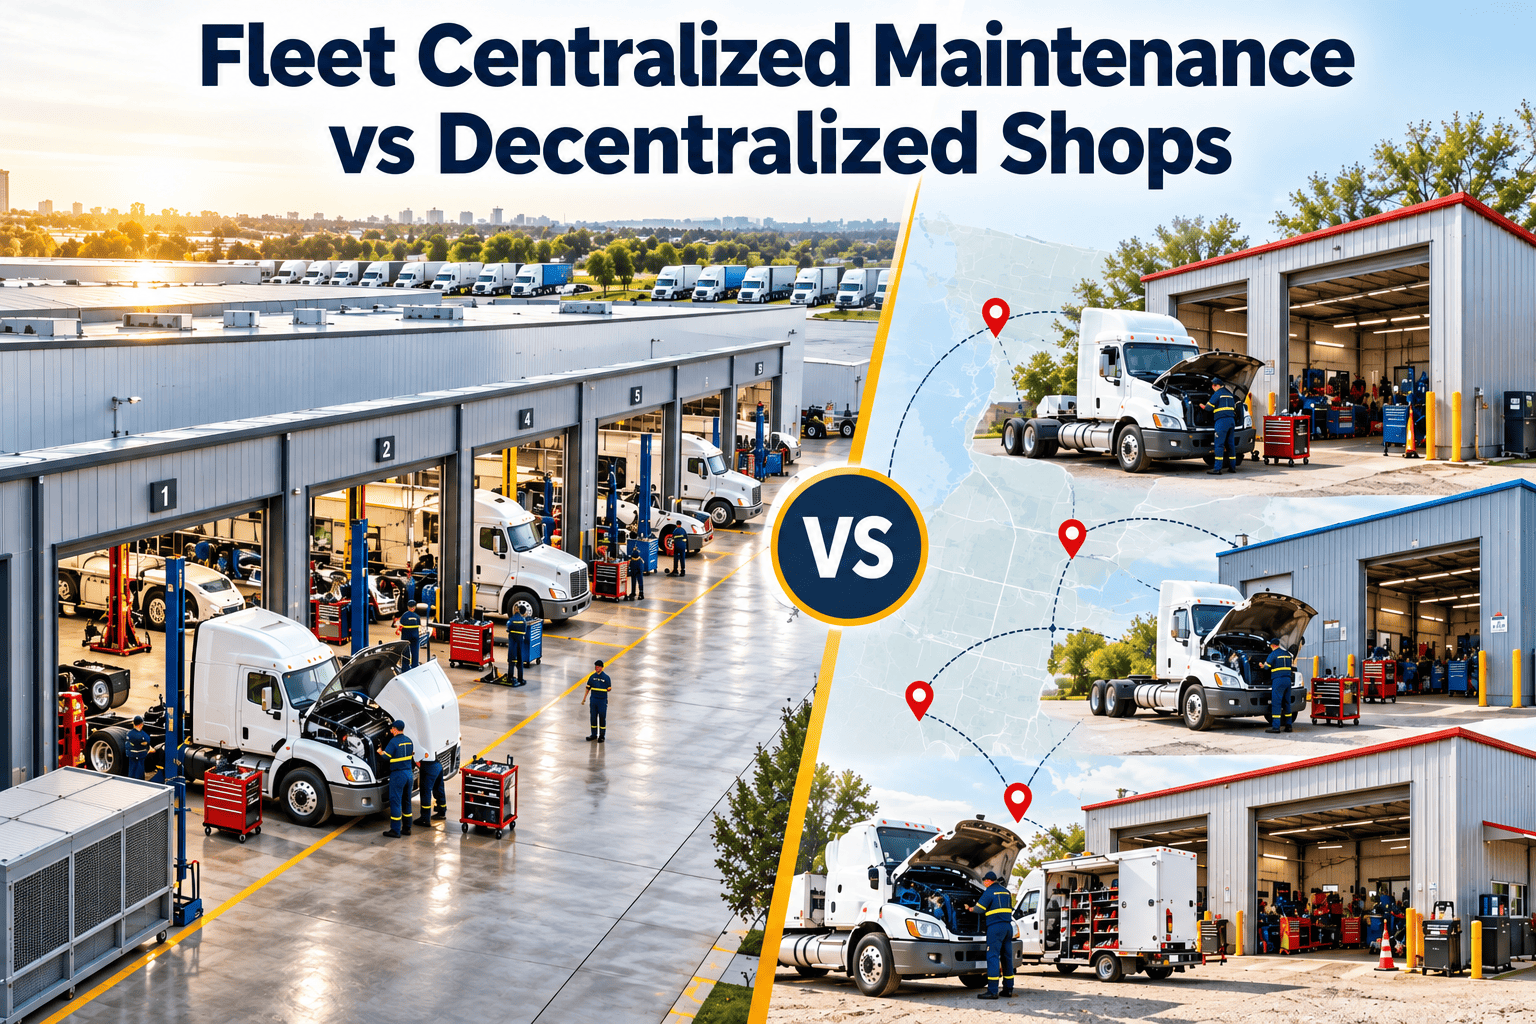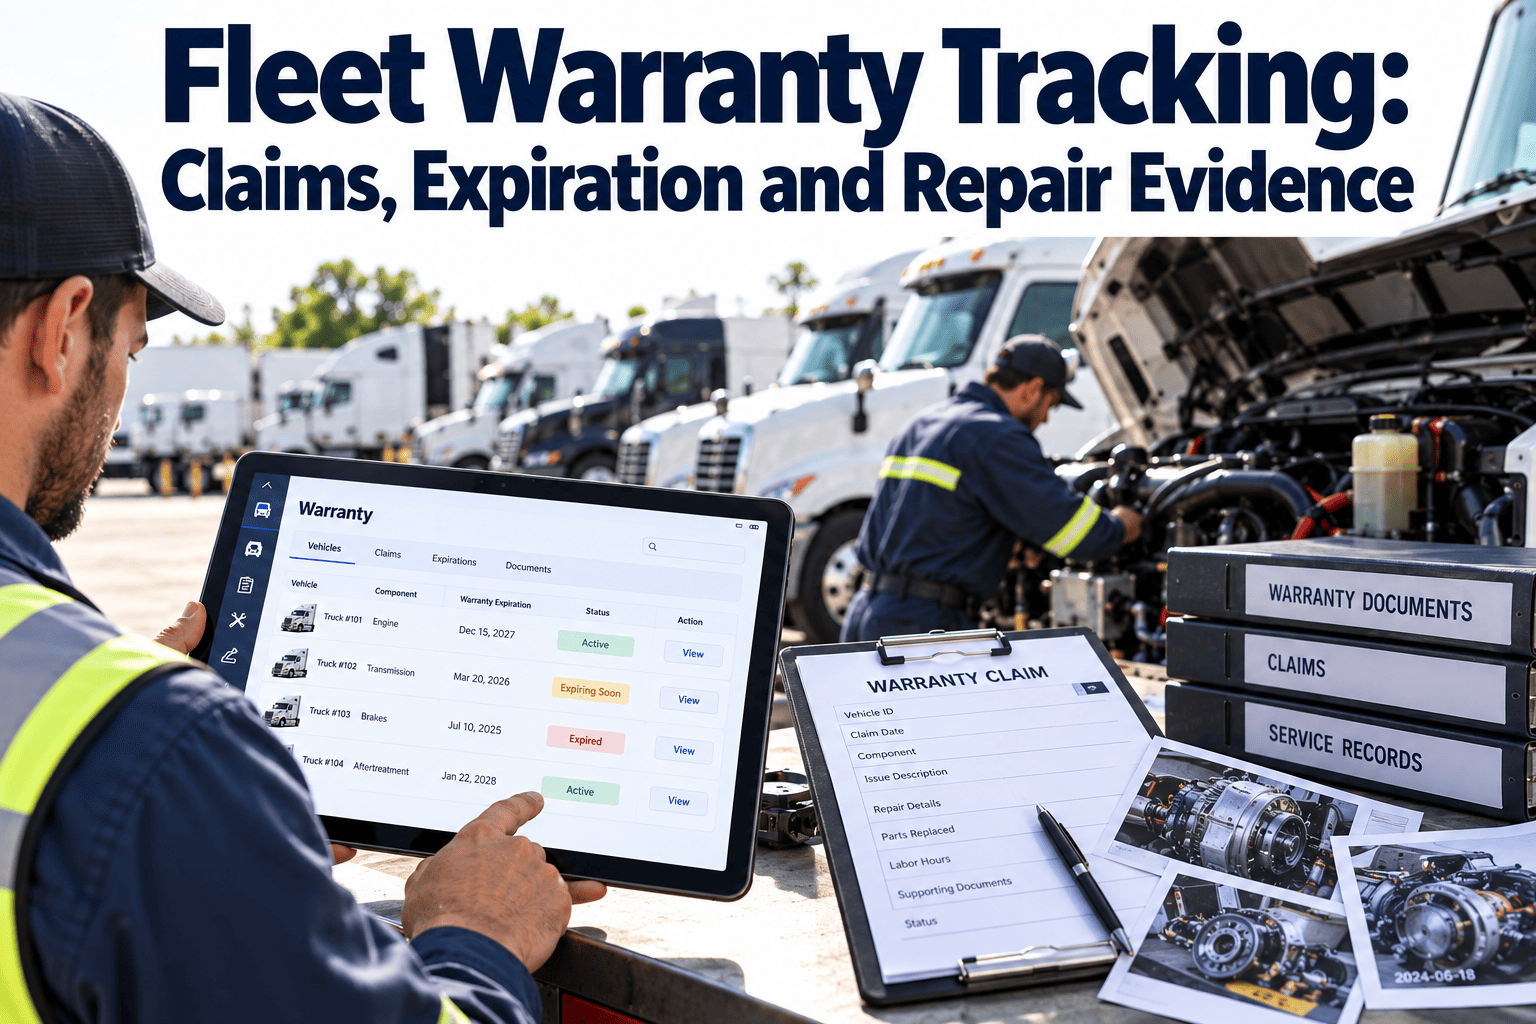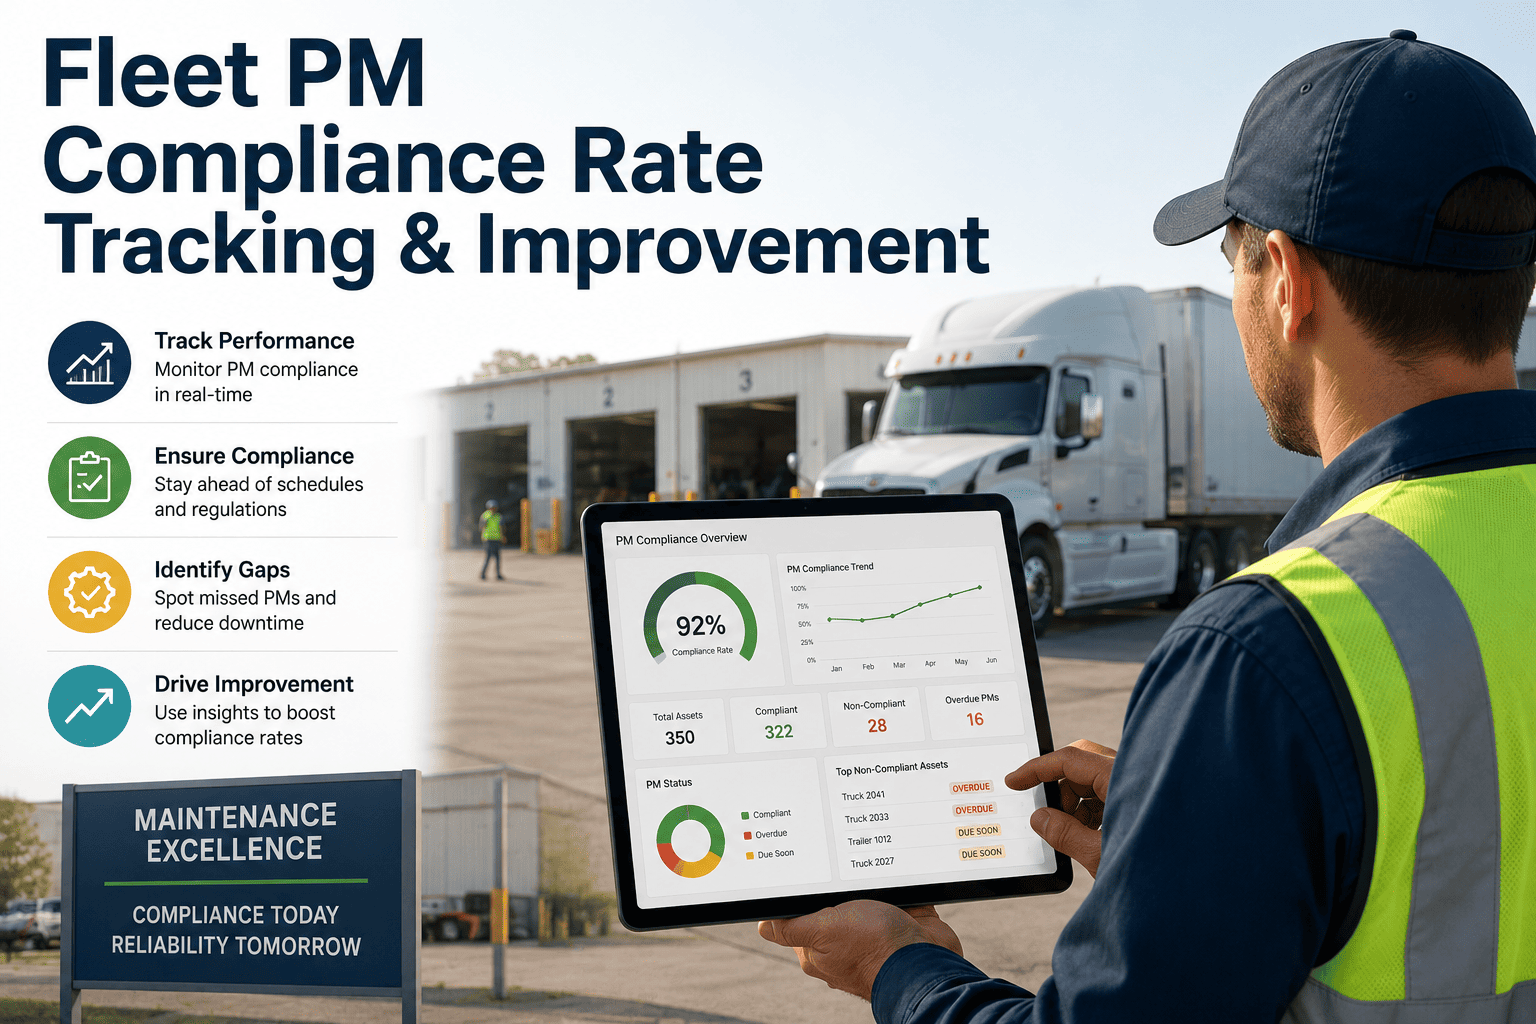
A comeback happens when a vehicle returns to the shop within a short window for the same problem a technician was supposed to have fixed — and it is one of the most honest numbers in fleet maintenance because it cannot be explained away by workload or parts delays. A shop can look busy, hit its work order close rate, and still be quietly bleeding money and trust if the same units keep rolling back in for repeat repairs. Most fleets track labor hours, first-time-fix rate, and technician headcount, but comeback rate is the one metric that actually exposes whether repairs are holding once the vehicle leaves the bay. OxMaint tracks comeback rate automatically per technician and per shop so weak repair quality shows up before it becomes a pattern.
See Which Shops and Technicians Are Actually Fixing It Right
OxMaint automatically flags any repeat repair within 30 days and attributes it back to the original work order, technician, and shop. Free to start.
What Actually Counts as a Comeback
Not every repeat visit is a comeback, and treating them the same way makes the metric useless. A comeback is specifically a return visit for the same fault, same system, or same component within a defined window — typically 30 days — where the original repair did not hold. A vehicle that comes back for an unrelated failure two weeks later is not a comeback, it is a coincidence. A vehicle that comes back because the same brake caliper that was replaced three weeks ago is now grinding again absolutely is, and it should be traced back to the technician, the parts batch, and the diagnostic notes from the first visit before the second repair even begins.
Getting the definition precise matters because a loose definition inflates the number until nobody trusts it, and a definition that is too narrow lets real quality problems slip through unflagged. The window, the system match, and the root-cause link back to the original work order all need to be consistent every time the metric is calculated.
Why Comeback Rate Beats Other Quality Signals
Most shops already track something adjacent to comeback rate without realizing it is a weaker version of the same signal. Customer complaint logs only capture the repairs that annoyed a driver enough to say something, which means quiet repeat failures on vehicles with less vocal drivers go completely unrecorded. Warranty claim counts only capture repairs that happened to fall under a parts warranty window, missing the larger set of comebacks that are simply re-billed as new labor. First-time-fix rate looks similar on the surface, but it measures whether a technician closed the ticket in one visit, not whether that closure actually held once the vehicle went back into service.
Comeback rate is different because it is measured after the fact, against real operational outcomes, rather than against a checklist completed at the moment the wrench went down. It does not care how confident the technician felt walking away from the job. It only cares whether the same fault reappeared. That makes it far harder to game and far more useful as an early warning system than any metric captured at the point of repair.
A shop consistently above 6 percent is not having a bad month, it has a systemic diagnostic or training gap that needs direct coaching, not just a stricter quality checklist.
Root Causes Behind High Comeback Rates
High comeback rates almost always trace back to one of a small number of causes, and identifying which one is driving the number is far more useful than simply reacting to the percentage itself.
Trace Every Comeback Back to Its Original Work Order
OxMaint links repeat repairs to the original diagnostic notes, technician, and parts used, so coaching conversations start with facts instead of guesses.
Comeback Rate by Shop — Sample Breakdown
Comparing comeback rate across shop locations, rather than looking at a single fleet-wide average, is what actually surfaces which locations need attention. A fleet-wide average of 4 percent can hide one shop running at 1.5 percent and another running at 9 percent.
| Shop Location | Repairs Completed | Comebacks (30-Day) | Comeback Rate | Status |
|---|---|---|---|---|
| Depot A — North | 212 | 4 | 1.9% | Good |
| Depot B — Central | 184 | 9 | 4.9% | Watch |
| Depot C — South | 158 | 16 | 10.1% | Poor |
| Depot D — West | 197 | 5 | 2.5% | Good |
A Coaching Workflow, Not a Punishment List
The point of tracking comeback rate is not to build a blacklist of technicians, it is to catch quality drift early enough that a short coaching conversation fixes it before it becomes a pattern that costs real money in warranty claims and customer trust.
We used to only hear about a comeback when a driver complained loudly enough. Now every repeat repair is flagged automatically and linked to the original ticket. Our worst-performing depot went from 11 percent to under 4 percent in two quarters just from having the visibility to have the right coaching conversations.
Frequently Asked Questions
Track Comeback Rate Automatically Across Every Shop and Technician
OxMaint flags repeat repairs the moment they happen and links them straight back to the original work order, so coaching starts with evidence instead of a hunch.