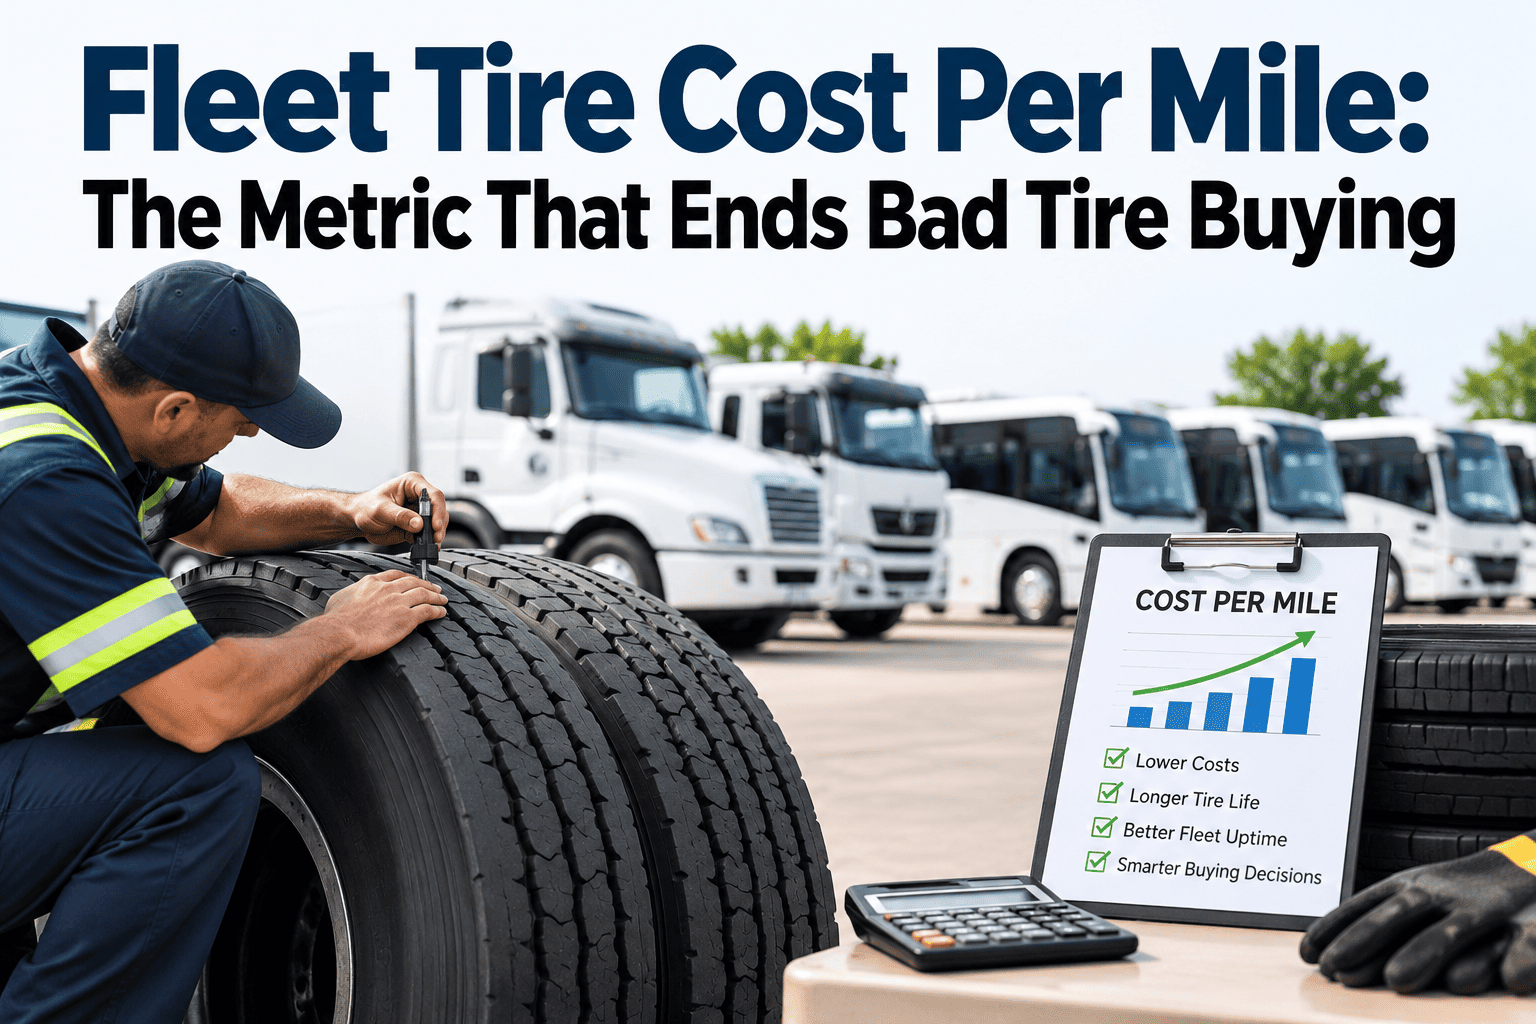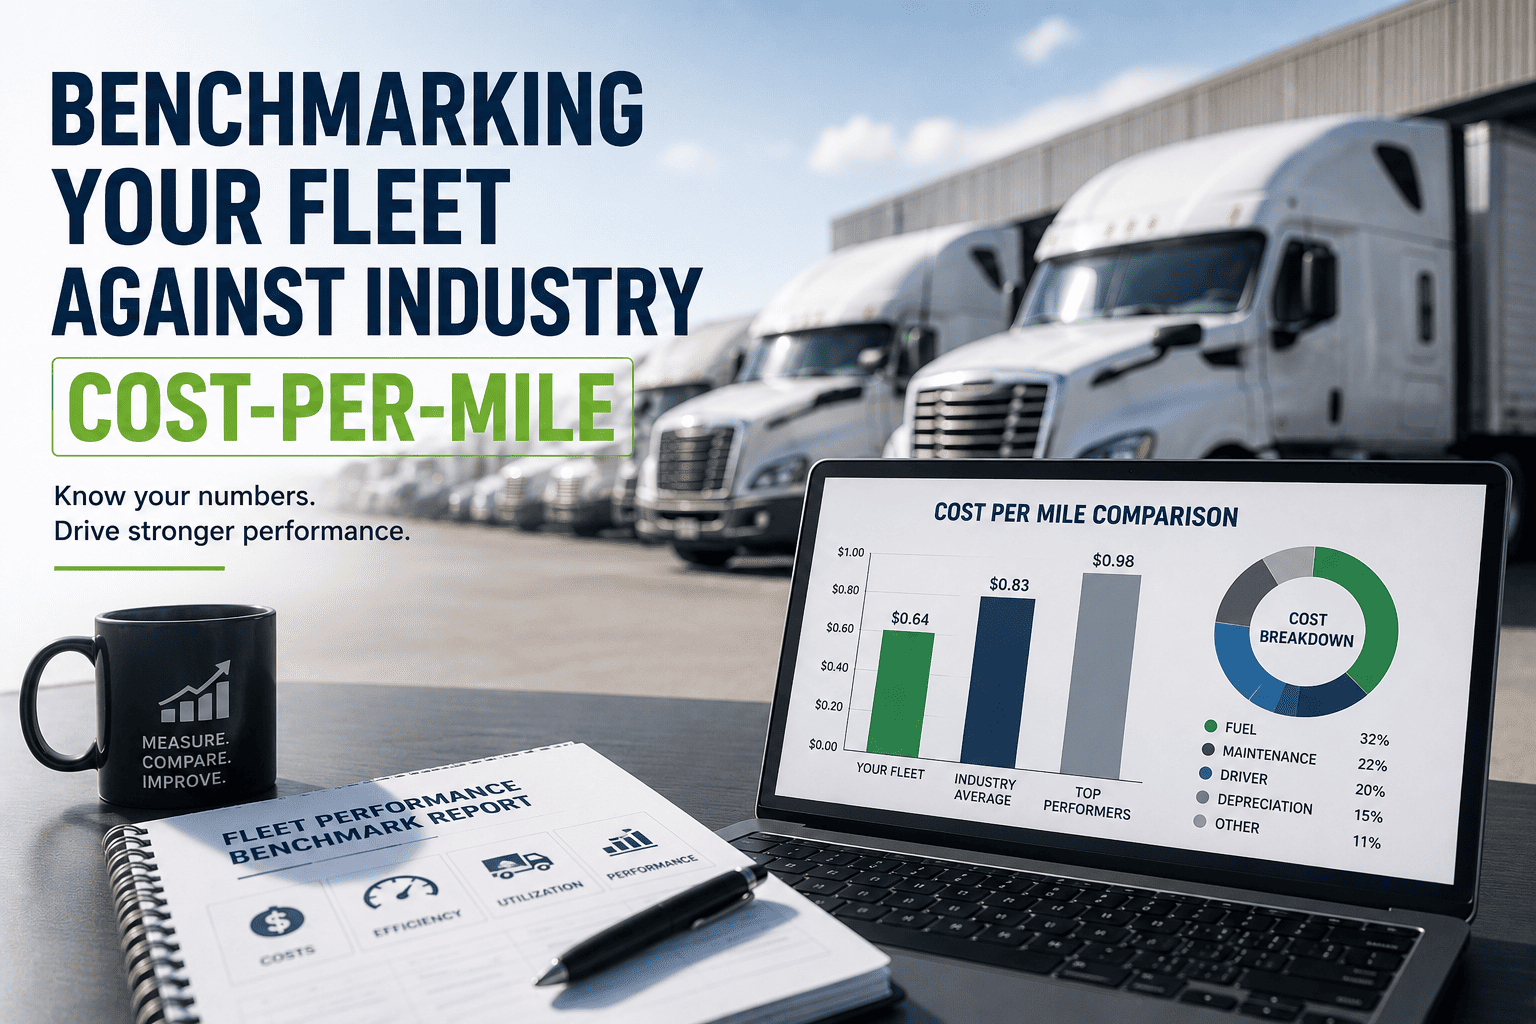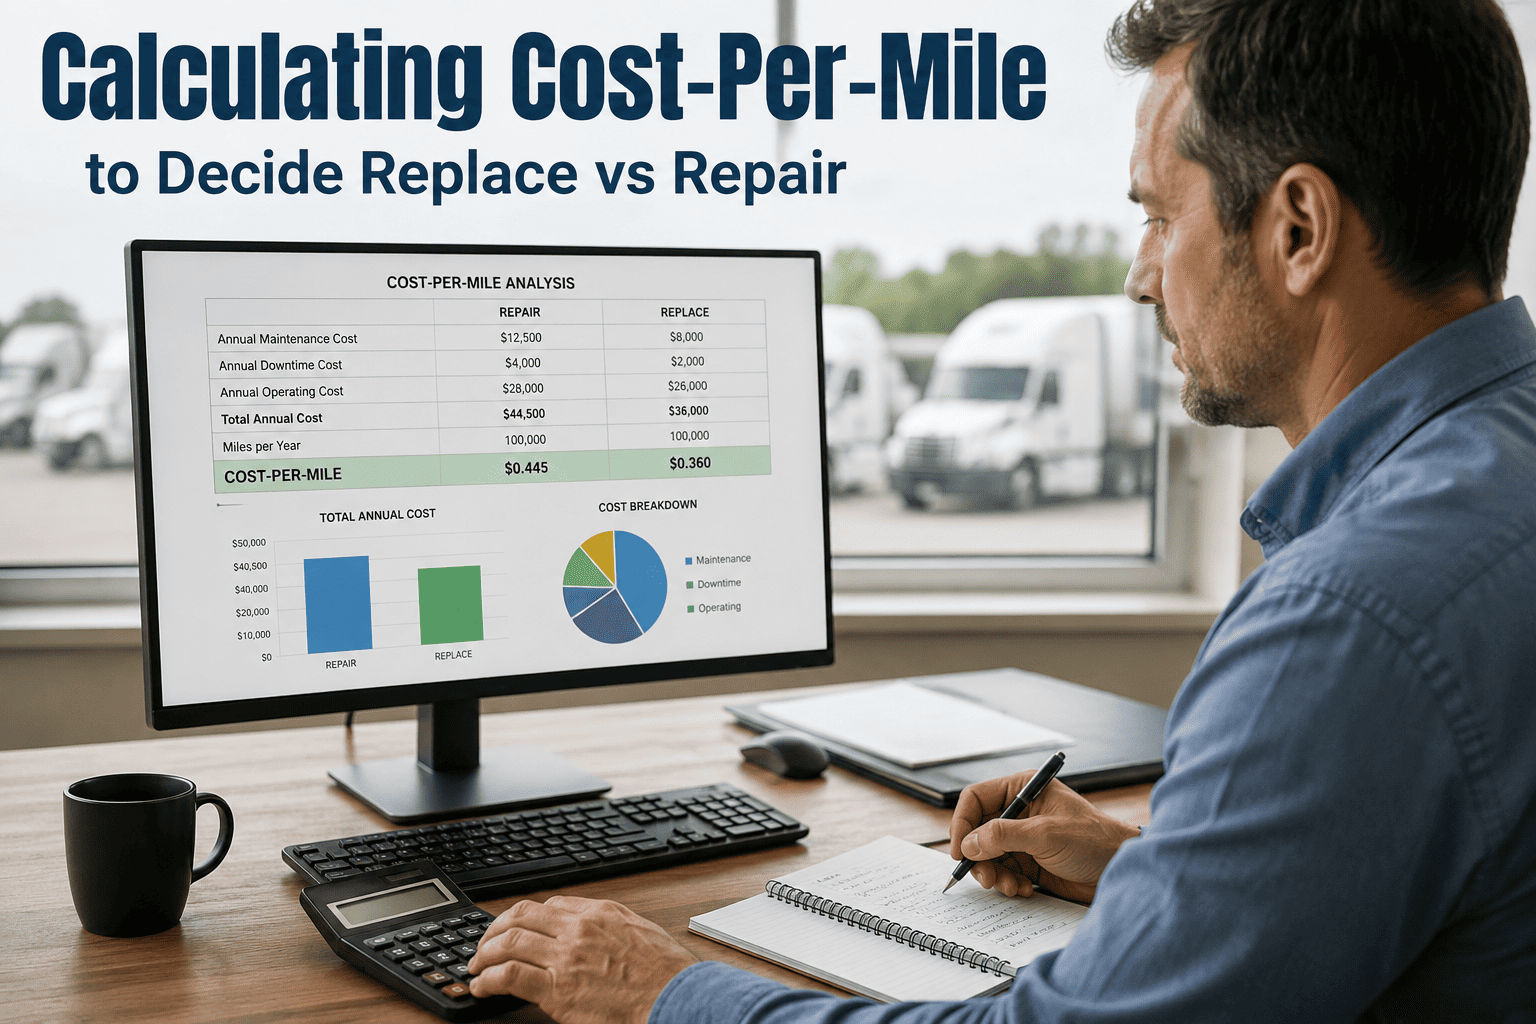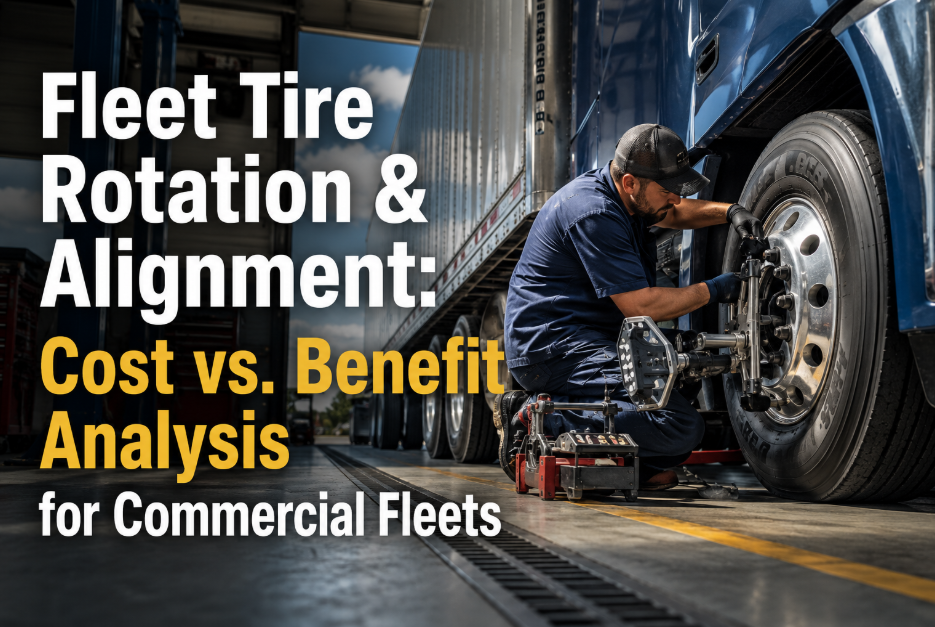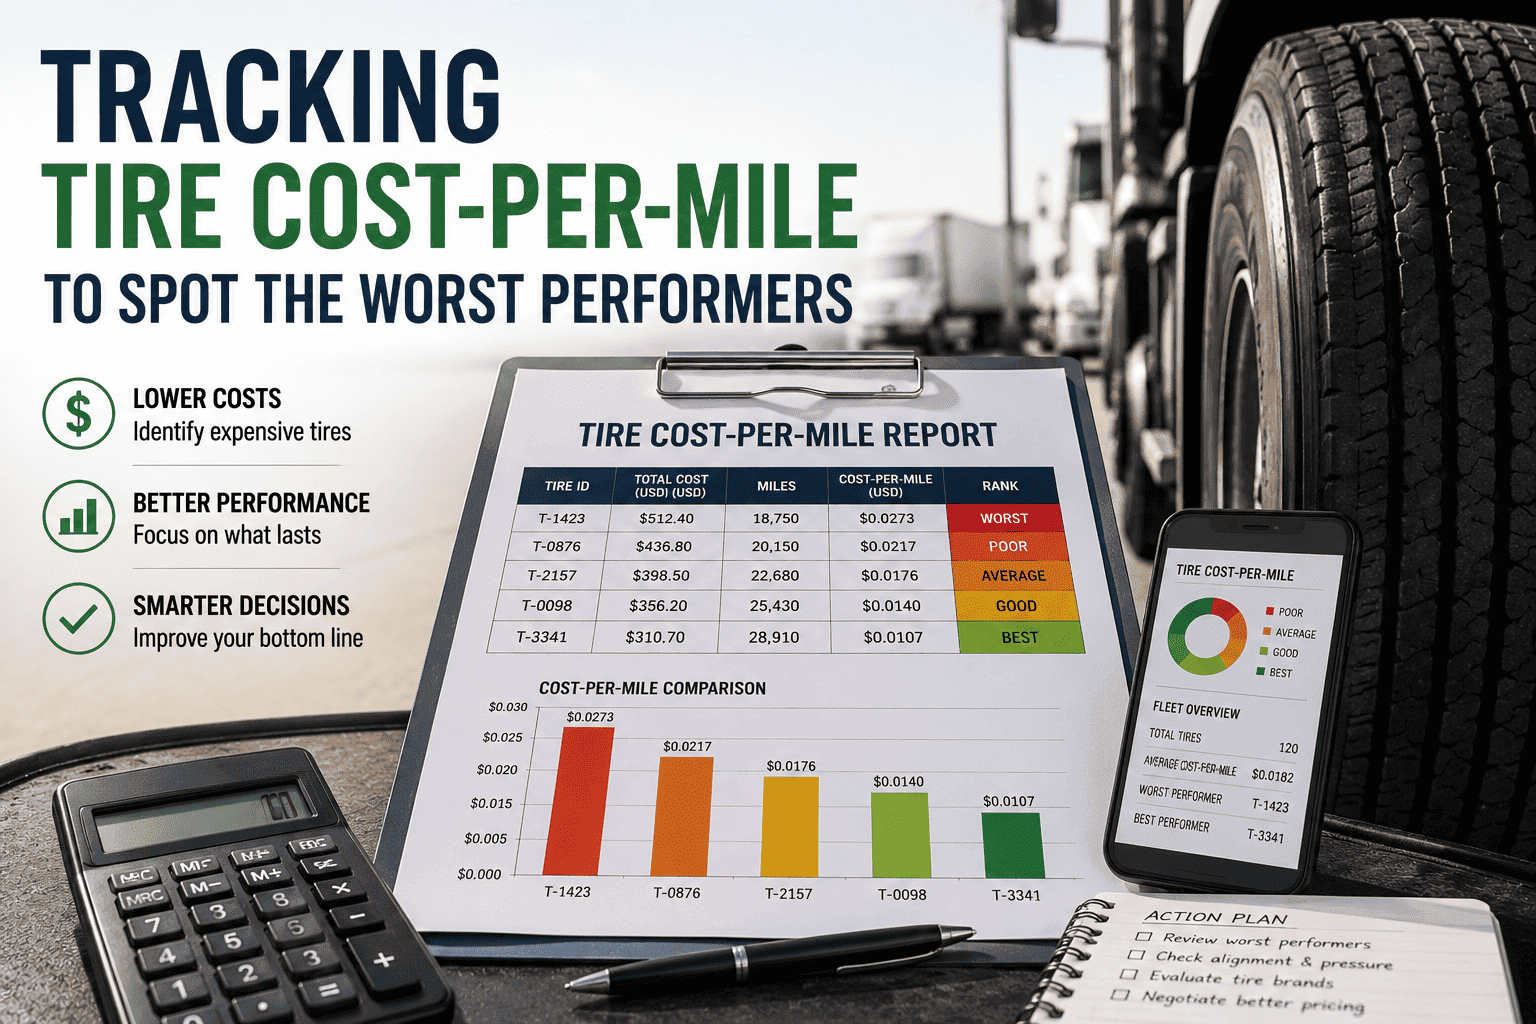
Tire spend is the second-largest operating cost for most over-the-road fleets, yet the majority still buy on sticker price instead of cost per mile — and quietly overspend by 10 to 20 percent on a line item that touches every tractor and trailer. The metric that levels the field is simple: total tire cost (purchase plus mount labor plus in-life repairs plus retread) divided by miles operated in that position. Once you calculate cost per mile per tire and roll it up by brand, model, position, and application, the worst performers surface immediately — a specific SKU quietly costing 30 percent more per mile than its brand family average, a tractor destroying drive tires at 90,000 miles instead of 250,000, a supplier whose casings never make it through a second life. This guide walks through the calculation, the comparison table that exposes winners and losers, and how Oxmaint automates the entire CPM workflow — start a Start Free Trial and see your fleet's real tire ranking inside a single afternoon.
Is your fleet paying 14% more per mile than it has to?
A $450 economy drive tire that delivers 140,000 miles costs more per mile than a $700 premium drive tire that delivers 250,000 miles. The cheaper tire wins the purchase order — and loses the budget. Cost-per-mile-per-tire tracking reveals which SKUs are actually saving the fleet money, and which are quietly inflating spend.
Price per tire vs cost per mile — the real scoreboard
Fleets that buy on purchase price alone routinely spend more per mile than fleets that buy on projected CPM. Below is the worked example that explains why a $250 sticker saving can cost the fleet thousands over a tire's life.
Four inputs, one reliable cost per mile
Every tire on every position must carry its own ledger. CPM is not a fleet-level average — it is a per-tire, per-position number. Here is the four-variable formula that drives the analysis.
What a fleet-wide CPM comparison actually looks like
A 180-truck mixed fleet running steers, drives, and trailer tires across three brands generates thousands of CPM data points per year. Aggregating by brand, model, position, and application produces a single table that exposes winners and losers — including SKUs that underperform their own brand family and should be removed from spec.
| Tire (brand / model) | Position | Avg. life (mi) | Total cost | CPM | Verdict |
|---|---|---|---|---|---|
| Premium A — Drive Pro | Drive | 252,000 | $706 | $0.0028 | Spec |
| Economy B — Drive Lite | Drive | 140,000 | $448 | $0.0032 | Drop |
| Premium A — Steer Guard | Steer | 135,000 | $580 | $0.0043 | Spec |
| Premium C — Trailer Max | Trailer | 210,000 | $420 | $0.0020 | Spec |
| Economy B — Trailer Value | Trailer | 155,000 | $310 | $0.0020 | Spec |
| Premium C — Drive Sport X | Drive | 168,000 | $588 | $0.0035 | Drop SKU |
Common pattern: premium brands win on drive and trailer positions where mileage is the dominant cost driver. Economy brands sometimes win on trailer positions where miles are shorter and casing longevity for retread matters less. Specific SKUs occasionally underperform their brand family — those get pulled from spec.
When the tire isn't the problem — the truck is
The same CPM data that ranks tire brands also flags underperforming vehicles. A tractor consistently pulling 90,000 miles per drive tire across all positions has an alignment, suspension, or driver-behavior issue that is quietly destroying tire life — and it shows up as a CPM spike long before it shows up as a roadside failure.
A 180-tractor fleet leaves six figures on the table
Take a 180-tractor regional fleet running 18 wheel positions per combination, averaging 110,000 miles per vehicle per year. A 12% CPM reduction — well within reach after the first comparison table — translates to roughly $108,000 of recovered tire spend annually, before retread gains.
Stop buying tires on sticker price. Start ranking them on cost per mile.
Oxmaint calculates CPM per tire automatically, runs brand-and-model comparisons across the population, and surfaces outlier vehicles for mechanical review — all in one afternoon.
Tire cost-per-mile tracking — the questions fleets ask first
How is tire cost per mile different from price per tire?
Price per tire is what you pay the supplier on the purchase order. Cost per mile is what the tire actually costs the fleet over its operating life — purchase price plus mount labor plus in-life repairs plus any retread, divided by miles run in that position. A $450 tire can carry a higher CPM than a $700 tire if it delivers far fewer miles, which is why PO price is the wrong steering metric for tire procurement.
What data do I need to calculate CPM per tire?
Four inputs per tire: purchase price, mount labor cost, cumulative in-life repair cost, and miles operated in position. For retreads, track retread cost plus mount separately and divide by retread mileage. Oxmaint captures all four automatically as tires are mounted, rotated, repaired, and retired — see it live by starting a Start Free Trial.
Which tire positions benefit most from CPM analysis?
Drive and trailer positions benefit most because mileage is the dominant cost driver there and brand differences compound over 200,000+ miles. Premium brands typically win on drive; economy brands sometimes win on trailer where miles are shorter and casing longevity for retread matters less. Steer positions are governed more by safety and removal criteria than pure mileage.
How does CPM analysis identify problem trucks?
When one tractor consistently pulls 90,000 miles per drive tire while the fleet average is 250,000 — same brand, same spec, same corridor — the data flags it as an outlier. That truck's CPM will be two to three times the fleet norm across all positions, pointing to an alignment, suspension, or driver-behavior issue that's destroying tire life long before a roadside event forces the discovery.
How quickly can a fleet see real savings from CPM tracking?
Most fleets see their first actionable comparison table within a day of enabling per-tire tracking. A 180-tractor fleet can recover roughly $108,000 of annual tire spend from a 12% CPM reduction — driven by dropping the worst three SKUs, realigning outlier tractors, and rebalancing the brand mix by position. Want the math for your fleet? Book a Demo and we'll run it live.
Your worst-performing tire SKU is hiding in your PO history.
Start a free trial and Oxmaint will calculate cost-per-mile per tire, rank every brand and model by position, and flag the outlier trucks destroying rubber — in a single afternoon.
Free 14-day trial · No credit card