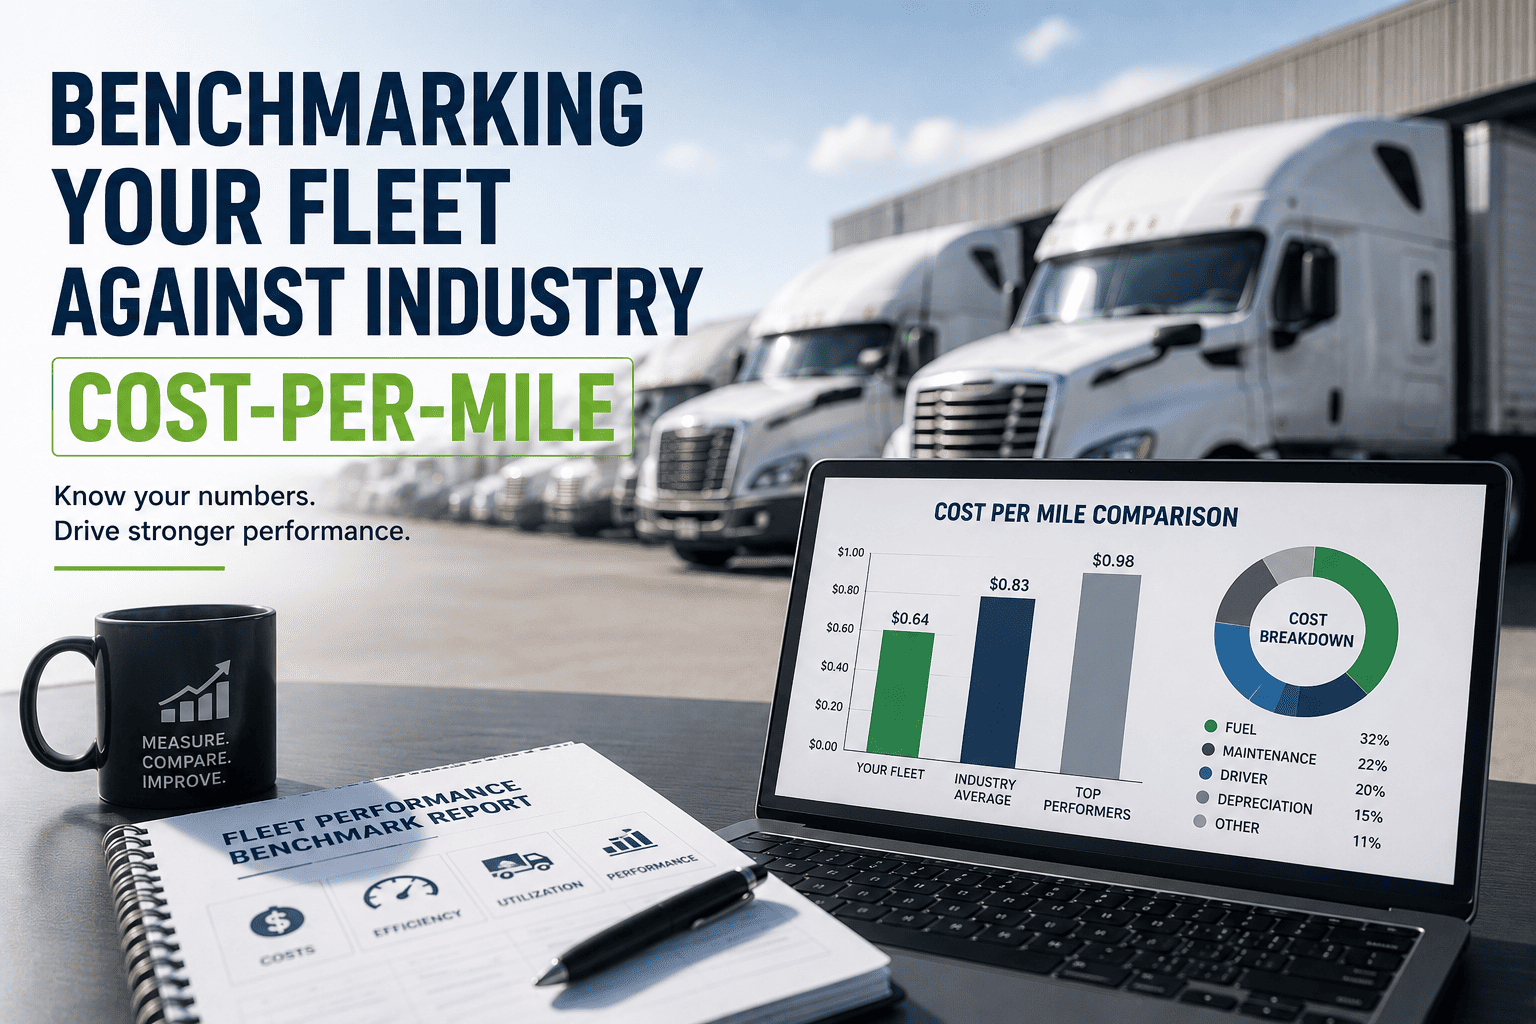
For Class 8 over-the-road fleets, the difference between running at $2.05 per mile and $2.45 per mile across a 120,000-mile year is $48,000 per tractor — and most of that gap hides inside line items managers never benchmark against peers. ATA's Truckload Carriers Association operational data gives you a defensible reference point: fuel, wages, maintenance, tires, insurance, depreciation, and overhead each have an expected range, and any line that drifts outside it signals a specific, diagnosable problem. This guide breaks down the 2026 cost-per-mile benchmark by category, shows you how to read variances, and explains how rolling 12-month trend analysis in Start Free Trial surfaces outliers before they compound into six-figure losses.
Is your cost-per-mile hiding $48,000 per tractor?
For a 120,000-mile Class 8 tractor, every $0.40 of per-mile drift equals $48,000 in annual margin erosion. Benchmarking against TCA peer data tells you exactly which line item is bleeding — and whether the gap is a fuel problem, a maintenance backlog, or an aging-asset spiral you can still reverse.
Total cost per mile: $2.00–$2.50, broken down
TCA's operational cost data for over-the-road Class 8 tractors puts the all-in cost per mile in a $2.00–$2.50 corridor. The seven line items below are where that money actually goes — and where benchmarking starts.
| Cost Category | Benchmark Range ($/mi) | % of Total | Primary Driver |
|---|---|---|---|
| Fuel | $0.60 – $0.80 | ~32% | MPG, idle time, route mix |
| Driver wages | $0.55 – $0.75 | ~28% | Pay structure, turnover, accessorials |
| Maintenance | $0.16 – $0.22 | ~8% | PM compliance, asset age, shop rates |
| Tires | $0.04 – $0.06 | ~2% | Spec, pressure mgmt, retread rate |
| Insurance | $0.10 – $0.14 | ~5% | Loss ratio, deductible, cargo class |
| Depreciation | $0.14 – $0.20 | ~7% | Asset cycle, residual, financing |
| Other (reg, tolls, admin) | $0.15 – $0.25 | ~8% | IRP, IFTA, permits, back-office |
When your number beats the benchmark — and when it doesn't
A variance isn't automatically a problem. A specialty heavy-haul fleet running $2.65/mile in a high-cost coastal market may be operating efficiently within its context. The benchmark is a reference, not a target. What matters is whether the variance is explained or unexplained — and whether it's trending.
Fuel at $0.95 vs. $0.70 benchmark
A $0.25 overage almost always traces to three compounding causes: fleet MPG below 6.5 when peers hit 7.2+, idle time above 30%, and fuel-card leakage from unauthorized purchases or out-of-network surcharges. At 120,000 miles, that's $30,000 per tractor.
Maintenance at $0.30 vs. $0.20
Typically one of three root causes: a fleet aged beyond 6 years with rising unscheduled repair, PM intervals being stretched to defer cost (which backfires), or shop labor rates 20%+ above market because no rate negotiation has happened in 3 years.
Insurance at $0.18 vs. $0.12
A $0.06 gap signals a loss-ratio problem, not a market problem. It means preventable collisions, cargo claims, or DOT violations are inflating your experience modifier — and the fix is a safety program, not a broker shopping exercise.
A 50-tractor fleet bleeding $1.5M in unexplained variance
Consider a 50-tractor dry-van fleet running 120,000 miles per tractor annually. Total cost per mile sits at $2.38 — inside the broad $2.00–$2.50 corridor, so on the surface nothing looks wrong. But the category breakdown tells a different story.
Three flagged categories — fuel (+$0.19), maintenance (+$0.08), insurance (+$0.03) — add $0.30/mi in unexplained variance. Across 6 million annual fleet-miles, that's $1.8 million. The headline cost-per-mile looked acceptable; the category benchmarking exposed the bleed.
The benchmark that matters most is your own trajectory
A fleet whose maintenance cost-per-mile climbs 15% year-over-year while the TCA benchmark holds steady has a specific, diagnosable problem — even if the absolute number still sits inside the $0.16–$0.22 range. Trend is the early-warning system; absolute number is the autopsy.
Baseline established
Maintenance at $0.19/mi, inside benchmark. PM compliance at 94%. Unscheduled repair events averaging 3.2 per tractor per quarter. No flags raised.
Drift begins
Maintenance creeps to $0.21/mi — still inside benchmark corridor, so a single-quarter snapshot wouldn't flag it. But rolling 12-month trend shows 8% climb. PM compliance slipped to 88%.
Outlier confirmed
Maintenance hits $0.24/mi, now outside the $0.22 ceiling. Rolling trend shows 15% YoY climb vs. flat benchmark. Root cause: deferred PMs on 12 tractors aged 7+ years cascading into roadside failures.
Corrective action
PM compliance restored to 95% via automated scheduling. Unscheduled repair drops 40%. Maintenance trending back toward $0.20 within two quarters. Trend analysis caught the problem 6 months before absolute cost would have.
Different operations, different benchmarks
TCA's $2.00–$2.50 corridor applies to over-the-road Class 8 truckload. LTL, private fleet, and specialty operations have structurally different cost profiles — and benchmarking against the wrong peer set produces worse decisions than not benchmarking at all.
| Operation Type | Typical CPM Range | Key Cost Driver Difference | Appropriate Peer Set |
|---|---|---|---|
| Truckload (OTR Class 8) | $2.00 – $2.50 | Fuel and wages dominate | TCA benchmark data |
| LTL (multi-stop) | $2.80 – $3.60 | Higher dock/handling, lower miles/tractor | ATRI LTL cost index |
| Private fleet | $2.40 – $3.10 | Higher driver pay, newer equipment | NPTC private fleet benchmark |
| Specialty / heavy-haul | $3.50 – $6.00+ | Permit costs, escort, low utilization | Specialized carriers association |
| Regional (≤500mi routes) | $2.30 – $2.80 | More starts/stops, higher idle | Regional carrier peer group |
Stop guessing where your cost-per-mile leaks.
Oxmaint benchmarks every line item against configurable peer tables and trends them on rolling 12-month windows — so you see the drift in Q2, not the damage in Q4.
Benchmarking questions fleet managers actually ask
How often should I benchmark my fleet's cost-per-mile?
Quarterly against external TCA/ATRI data, monthly against your own rolling 12-month internal trend. External benchmarks shift slowly; internal trend is where outliers surface early. A 15% year-over-year climb in any category while the benchmark holds flat is the single most actionable signal — it means the problem is yours, not the market's. You can set this up in Oxmaint or Book a Demo to see the trend dashboards configured for your segments.
My maintenance cost is above the $0.22 ceiling — is that always a problem?
Not always, but it always warrants diagnosis. If your fleet averages 7+ years old, runs specialized routes with high vibration or extreme temperatures, or operates in markets where shop labor rates run 25% above national average, a higher maintenance CPM may be legitimate. The test is whether the variance is explained and stable — or unexplained and trending. Trending up with no explanation is the red flag.
What's the single biggest cost-per-mile leak most fleets miss?
Fuel-card leakage and idle-time creep. Fuel is the largest line item ($0.60–$0.80/mi), so even a 5% inefficiency compounds fast. A fleet at 6.4 MPG when peers hit 7.2, with 35% idle time and 3% unauthorized fuel purchases, can lose $0.20+/mi without any single failure looking catastrophic on a monthly P&L.
Should I benchmark against TCA data or build my own peer group?
Both. TCA/ATRI data gives you a defensible industry-wide reference — useful for board conversations and carrier scorecards. A custom peer group of 8–12 similar operations (same geographic region, same freight type, similar fleet age) gives you a sharper diagnostic target. Oxmaint lets you load configurable benchmark tables for both; start your free trial at app.oxmaint.ai to configure yours.
How do I account for fleet age when benchmarking maintenance?
Normalize by adjusting the benchmark ceiling based on average asset age. For every year above the 5-year TCA reference average, add roughly $0.015–$0.02/mi to your expected maintenance ceiling. A 7-year-old fleet running $0.24/mi against a $0.22 standard isn't really over benchmark — it's at age-adjusted benchmark. The real flag is a same-age fleet running $0.30.
See your cost-per-mile benchmarked against peers in 48 hours.
Load your fuel, maintenance, and wage data into Oxmaint and get category-level variance analysis against TCA benchmarks on rolling 12-month windows — with outlier detection that flags drift before it becomes damage.
Free 14-day trial · No credit card


.png)