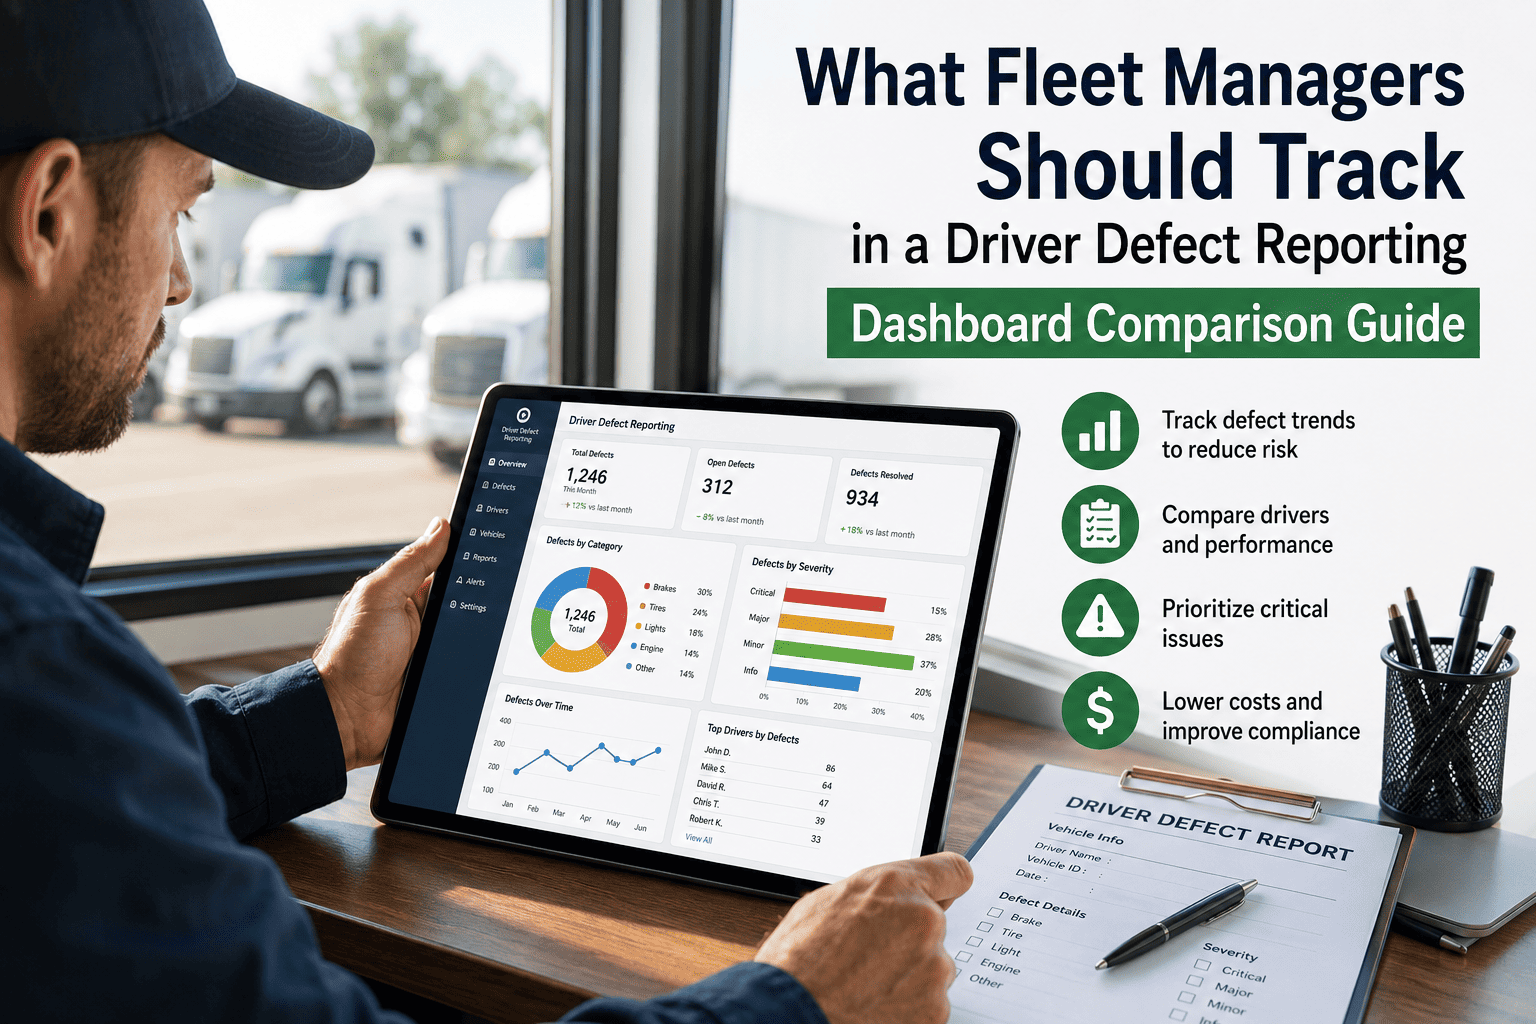
Most fleet defect-reporting dashboards fail in one of two opposite ways: they show everything, which buries the three problems that matter under fifty that do not, or they show too little, leaving blind spots where a recurring brake defect repeats across the fleet because nobody is watching the trend. The fix is not more data — it is the right data, organized by what each number tells you and who needs to act on it. A strong dashboard separates lagging indicators that confirm what already happened from leading indicators that predict what is about to, and surfaces only the exceptions that need attention. This guide lays out exactly what to track, organized in tiers, and shows how OxMaint's defect-reporting dashboard turns raw inspection records into decisions.
Driver Defect Reporting · Dashboard Metrics · OxMaint
A Dashboard That Shows Everything Hides The Three Numbers That Matter. The Right One Surfaces The Problems And Stays Quiet On The Rest.
Exception reporting cuts review time by 70–80% while improving detection, because the system monitors around the clock and only raises what crossed a threshold. Here is the metric set worth tracking — and what each one tells you.
Fleet Defect Reporting — Live View
OxMaint Dashboard
96%
DVIR Completion Rate
On target
3.1 hr
Defect to Work Order
Under 4 hr target
28 hr
Repair Response (safety)
Over 24 hr — review
5
Recurring Defects (30d)
Pattern flagged
Green is on target · Amber needs review · Red is an exception requiring action. The dashboard finds the problem; you do not hunt for it.
The Four Tiers — From What Already Happened To What Is About To
Tier 1 · Compliance Baseline
Are inspections actually happening and being kept?
DVIR Completion Rate — percent of required inspections actually performed. The foundation; everything else is meaningless if this is low.
Record Retention Status — can the full chain be produced in under 60 seconds for the 90-day requirement?
Audience: compliance officer, safety manager
Tier 2 · Response Speed
How fast does a finding become a fix?
Defect-to-Work-Order Cycle Time — hours from defect report to work order. Target under 4 hours.
Repair Response Time — work order to repair complete. Target under 24 hours for safety-critical, under 72 for the rest.
Audience: maintenance manager, shop supervisor
Tier 3 · Quality & Integrity
Are the inspections real and thorough?
Defect Detection Rate — defects found per 100 inspections, by driver and vehicle. Unusually low rates on older units signal rushed or skipped checks.
Inspection Quality Score — a composite of thoroughness, photo compliance, time spent, and reporting patterns.
Audience: safety manager, driver supervisor
Tier 4 · Leading Indicators
What is about to become a problem?
Recurring Defect Patterns — the same defect repeating across a vehicle or fleet, the early signal of a systemic issue.
CSA Score Trajectory — improving or declining, including the 2026 "Driver Observed" category that scores walk-around items directly.
Audience: leadership, director of operations
OxMaint · Exception-Based Defect Dashboard
Stop Reviewing Everything To Find The Problem. Let The Dashboard Find The Problem And Bring It To You.
Eight core exception reports cover missed inspections, rushed completions, zero-defect anomalies, overdue repairs, recurring defects, driver-quality decline, CSA drift, and cost anomalies.
The Eight Exception Reports Worth Configuring First
Exception Report
What It Catches
Why It Matters
Missed inspections
Required DVIR not filed
Direct compliance gap
Rushed completions
Inspection done in seconds
Pencil-whipping signal
Zero-defect anomalies
Old vehicle never reporting issues
Detection likely failing
Overdue repairs
Defect open past threshold
Safety + audit exposure
Recurring defects
Same fault repeating
Systemic root cause
Driver-quality decline
Falling thoroughness over time
Coaching trigger
CSA score drift
Trend moving the wrong way
Early warning
Cost anomalies
Repair cost outlier
Budget + replacement signal
The dashboard pays for itself at renewal.
Insurance underwriters standardized a core set of metrics for premium calculations, and fleets that present structured quarterly data aligned to them save in the range of 8–12% on renewals. A strong reporting posture can mean a 10–15% premium reduction, while weak or absent reporting drives 20–40% increases in the current market — a gap that reaches $50,000–$100,000+ a year for a 50-truck fleet. The dashboard auto-generates that quarterly package from data it already holds; no manual compilation.
Frequently Asked Questions
What is the single most important defect-reporting metric to track?
DVIR completion rate is the foundation — every other metric is meaningless if inspections are not actually happening. After that, defect-to-work-order cycle time tells you how fast findings become action. Start free to track both.
How does exception reporting save time?
Instead of reviewing every record to find problems, the system monitors around the clock and surfaces only items that cross a threshold — cutting review time by 70–80% while improving detection because nothing is watched only occasionally.
What is a "zero-defect anomaly" and why flag it?
An older vehicle that never reports a single defect usually means inspections are being rushed or skipped, not that the vehicle is flawless. Flagging it catches pencil-whipping before it becomes a roadside violation.
How does the dashboard help with insurance premiums?
It auto-generates the quarterly data package underwriters expect — completion rates, response times, CSA trends — which fleets use to earn renewal savings in the 8–12% range instead of facing increases for weak reporting.
Does OxMaint track the new 2026 CSA "Driver Observed" category?
Yes. CSA score trajectory is a leading-indicator metric on the dashboard, including the separately scored walk-around items drivers are expected to catch, so the trend is visible before it affects your rating.
Four Tiers. Eight Exceptions. One Screen That Tells You What To Do Next Instead Of What Already Happened.
Completion and retention · response speed · inspection quality · leading indicators — with auto-generated renewal reporting.