If your idle reduction dashboard only shows total engine hours, it is hiding the number that actually matters. A truck can rack up the same hours sitting in a yard as it does on the highway, but only one of them earns revenue. Across the U.S. trucking industry, engine idling burns roughly 3 billion gallons of fuel a year, and every 10 percent of idle time costs about 1 percent of overall fuel economy. The right dashboard separates the waste from the work and tells you who, where, and how much, which is the fastest path to a free trial or a quick demo.
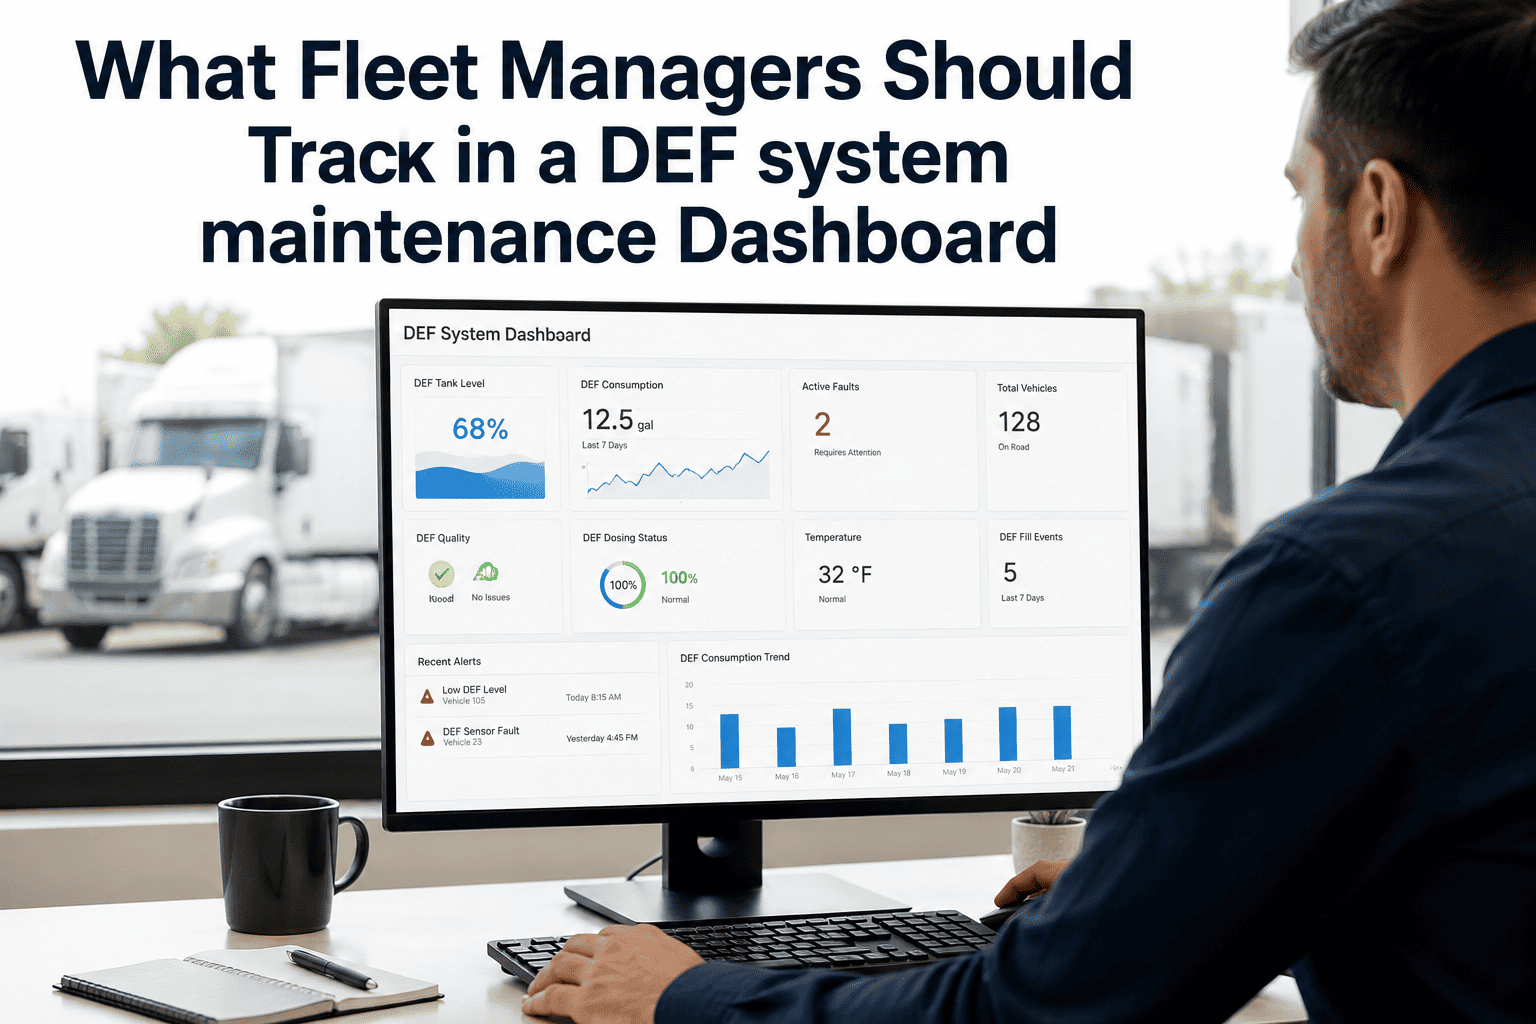
What Fleet Managers Should Track in an Idling Reduction Maintenance Dashboard
Total hours tell you nothing. Idle hours split from drive hours, tagged by cause and converted to dollars, tell you everything. Here are the exact metrics a dashboard needs to turn idle waste into action.
What Belongs On Every Idle Dashboard
A dashboard built only on a single idle total is decoration. These six metrics are the ones that change decisions, each pulling a specific lever, fuel cost, engine wear, driver behavior, or seasonal noise, so the number you see leads directly to an action you can take.
Daily and weekly idle time logged separately from drive time for every vehicle. Without the split, every other idle metric is guesswork.
Whether idle came from a delivery stop, traffic, HVAC use, or a driver break, not just a total, so you act on the avoidable share only.
Gallons consumed while stationary turned into a dollar figure per vehicle and per route, so cost is never hidden in the monthly bill.
Stress that builds faster on engines idling heavily between short trips, flagging DPF and SCR wear before it becomes a failure.
Whether automatic shutdown timers are firing as configured or being overridden by drivers, so policy gaps surface immediately.
Which drivers idle longer than their route requires, for targeted coaching, with seasonal warm-ups and cab cooling tracked apart.
Turn These Metrics Into A Maintenance Plan
Oxmaint logs idle and drive hours separately, tags every idle event by cause, converts gallons to dollars per vehicle and route, and flags emissions-system wear early, all on one dashboard. The numbers do not just sit there; they trigger the work orders that keep idle off your maintenance budget.
Vanity Numbers vs Decision-Grade Idle Data
Many dashboards show idle data that looks impressive and changes nothing. The test of a metric is simple: does it lead to an action? This is the line between a number you glance at and a number you act on.
| Question | Vanity Dashboard Answer | Decision-Grade Answer |
|---|---|---|
| How much do we idle? | Total engine hours, fleet-wide | Idle hours per vehicle, split from drive time |
| What is it costing? | Buried in the fuel bill | Dollar figure per vehicle and per route |
| Why are we idling? | Unknown, one lump number | Tagged: delivery, traffic, HVAC, or break |
| Who should we coach? | No driver-level data | Per-driver ranking vs route requirement |
| Is the engine at risk? | Mileage only | Emissions-system stress flagged early |
| Are timers working? | Assumed, never checked | Override events surfaced per unit |
A Dashboard Built Around Action, Not Decoration
Oxmaint pulls every metric that matters into one view, splits idle from drive time with no manual logging, attributes cost down to the route, and turns emissions-system stress into maintenance triggers before failures hit. Idle fuel waste scales with engine size, so a fleet average hides where the real cost lives, and Oxmaint surfaces it per vehicle. Ready to see your own idle data? Start a free trial or book a demo.
Engine hours separate into idle and drive time automatically for every vehicle, removing the data-entry burden that makes spreadsheets fail.
Idle gallons convert into a cost figure per vehicle and route so the expense is visible the day it happens, not weeks later.
Maintenance intervals adjust for high-idle units, scheduling service ahead of the emissions-system failures heavy idling drives.
Idle rankings highlight where coaching saves the most fuel, with drivers getting direct feedback on their own numbers each week.
What Each Idle Metric Is Actually Telling You
A number on a dashboard is only useful if you know what action it points to. Each idle metric maps to a specific decision, coaching, policy, or maintenance, and reading them together turns raw idle data into a plan. Here is how the core signals translate into moves a fleet manager can make this week.
| What You See | What It Means | What To Do |
|---|---|---|
| High idle, one driver | Behavioral, not operational | Coach the driver against their route baseline |
| High idle, one site | Local policy or climate gap | Apply the warm-up and shutoff standard there |
| Idle tagged HVAC | Cab-comfort idling | Promote APU or cab-power alternatives |
| Rising idle cost per route | Waste concentrating on a lane | Review dwell, loading, and wait times |
| Timer override events | Shutdown control defeated | Reinforce policy, check timer config |
| High idle hours, one unit | Accelerated emissions wear | Move that unit to hour-based PM intervals |
The Idle Thresholds Worth Alerting On
A dashboard that only reports is a rear-view mirror. One that alerts is a windshield. Setting thresholds on the right idle signals turns passive data into proactive action, catching waste and wear before they compound across the fleet.
Alert when a vehicle or route crosses a set idle-cost figure for the week, so spending is caught the day it spikes, not at month-end.
Flag when a driver jumps up the idle ranking versus their own baseline, surfacing a habit change while coaching can still reverse it.
Notify on shutdown-timer overrides so a defeated control never quietly drives idle up across an entire region undetected.
Trigger a PM review when idle hours push a unit's effective engine age ahead of its mileage, catching emissions wear early.
Frequently Asked Questions
Why split idle hours from drive hours?+
How does the dashboard show idle cost?+
Can it tell why a truck was idling?+
Does the dashboard track engine wear too?+
How does per-driver coaching work?+
Track The Numbers That Actually Cut Fuel
A dashboard full of totals changes nothing. One that splits idle from drive, tags the cause, prices the waste, and ranks the drivers changes everything. See exactly how much idling is costing your fleet right now, per vehicle and per route, in the first 30 days.