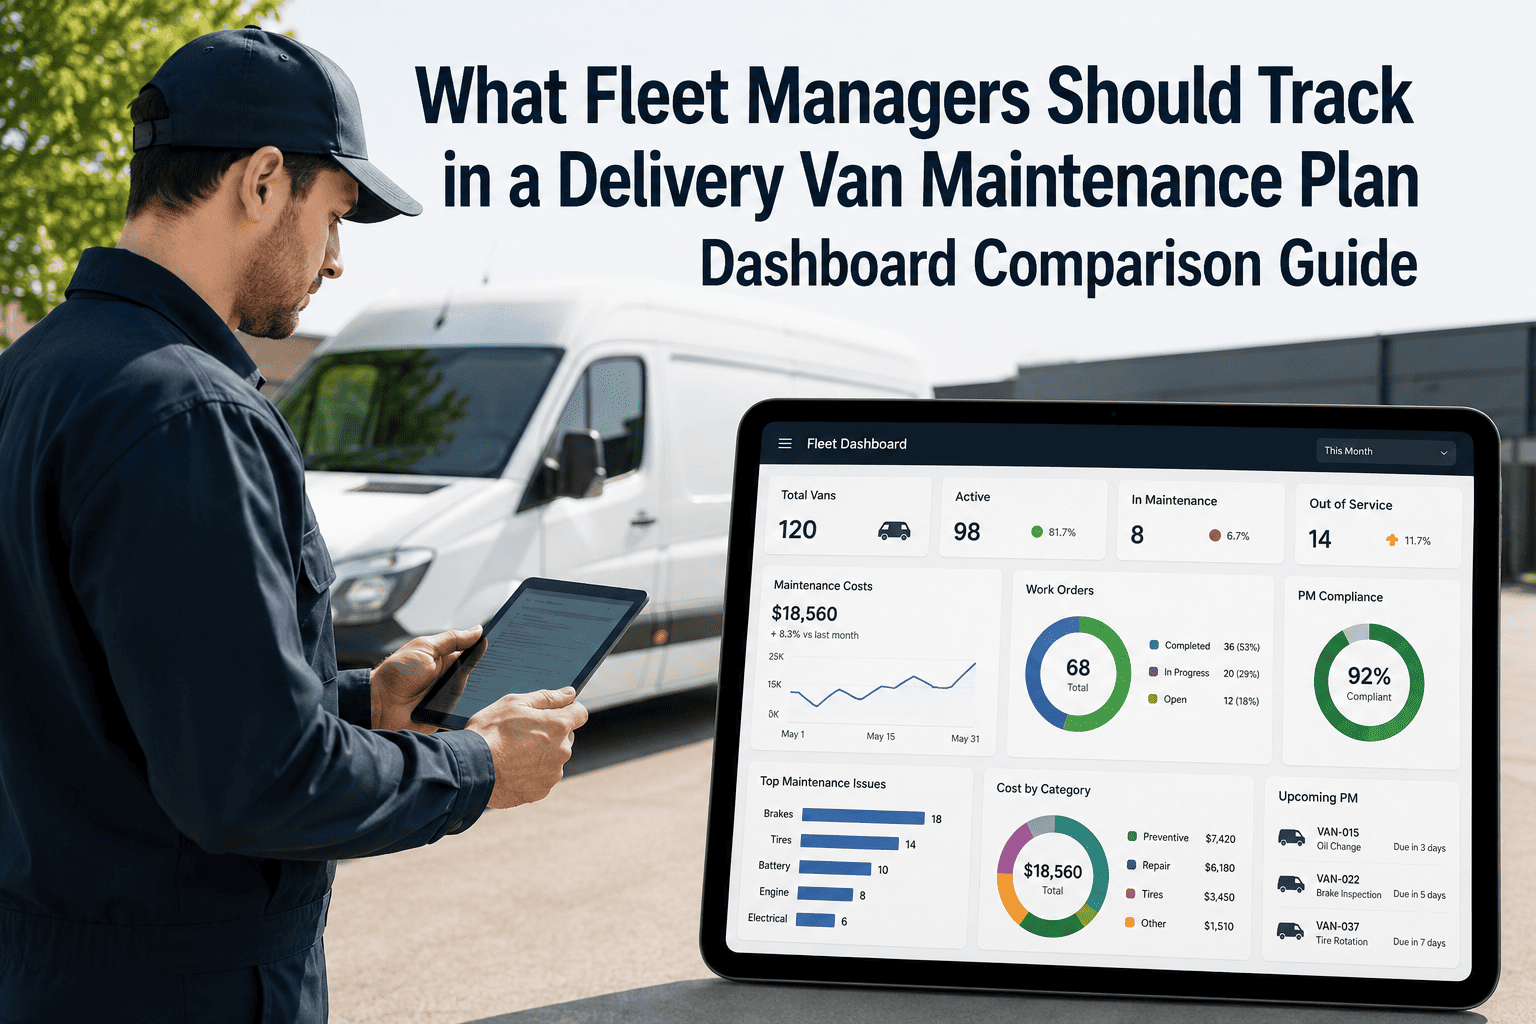
Delivery van fleets live and die by uptime — a van sitting in the shop instead of on a route is a missed delivery window, an idle driver, and a customer who notices. Most fleet managers already stare at a dashboard every morning, but many are watching the wrong numbers: total mileage and fuel spend instead of PM compliance, fault trends, and cost per mile. The dashboards that actually cut breakdowns track a narrow, specific set of readiness metrics rather than general fleet activity. Getting this right is less about buying new software and more about deciding what earns a spot on the screen every manager checks first thing. Teams ready to see what a properly built dashboard looks like can start a free trial or book a demo.
The Delivery Van Dashboard: What Actually Belongs On It
A dashboard full of numbers is not the same as a dashboard that prevents breakdowns. Here is the metric set that separates reactive last-mile fleets from predictive ones — and how it compares to what most teams track today.
Reactive Metrics vs. Metrics That Predict Downtime
Most delivery fleet dashboards default to what telematics vendors surface first — location, mileage, fuel burn. Those numbers describe where a van has been. They do not tell a manager which van will fail this week. Teams that want the second kind of dashboard can start a free trial or book a demo to see it configured for their fleet.
| Common Dashboard Metric | What It Actually Tells You | Predictive Alternative | Why It Matters More |
|---|---|---|---|
| Total miles driven | Route activity only | Miles since last PM interval | Flags overdue service before failure |
| Fuel cost per week | Spend, not condition | Fuel efficiency drift per vehicle | Early sign of engine or tire wear |
| Vehicle location | Route compliance | Fault code frequency by vehicle | Surfaces recurring mechanical risk |
| Idle time | Driver behavior | Brake and tire wear trend | Predicts the next roadside failure |
| Open work orders | Current backlog | PM compliance rate by vehicle | Shows whether the backlog is shrinking |
Five Metrics That Belong On Every Delivery Fleet Dashboard
A dashboard tuned for uptime tracks PM compliance rate, active fault codes, cost per mile by vehicle, DVIR completion, and days-to-failure predictions on components with known wear curves — brakes, tires, batteries. Everything else is context, not signal. Oxmaint builds this view automatically from your existing work order and telematics data.
The Five Numbers a Fleet Manager Should Check First
The percentage of scheduled preventive maintenance completed on time. Below 90 percent, breakdown frequency rises sharply across last-mile fleets.
Live diagnostic trouble codes pulled from telematics, grouped by severity so a check-engine light does not sit unnoticed for three weeks.
The single number that reveals which vans are quietly draining the budget through repeated repairs rather than one-time issues.
Driver vehicle inspection reports completed daily. Gaps here usually precede a spike in roadside failures within two to three weeks.
Predictive wear tracking on brakes, tires, and batteries so replacement happens on a schedule, not after a roadside call.
Six Dashboard Alerts That Should Open a Work Order Automatically
A dashboard that only displays numbers still leaves a manager doing the work of deciding what matters. The stronger version turns specific thresholds into an automatic work order, so nothing sits unread in a browser tab.
A fleet-wide dip below this line reliably precedes a spike in unscheduled breakdowns within two to three weeks.
A repeat fault code on the same vehicle within seven days signals a problem that a single reset did not actually fix.
Any vehicle running 20 percent above the fleet average for two consecutive months deserves a closer inspection.
A missing inspection report is often the first sign a driver is rushing routes or avoiding a known issue with the van.
Flagging wear at 80 percent rather than waiting for a grinding complaint keeps replacement a scheduled job, not an emergency.
A sharp week-over-week drop in battery health predicts a no-start situation well before it strands a driver on route.
How Oxmaint Builds This Dashboard From Data You Already Have
Oxmaint does not require new sensors or a hardware swap. It pulls from the telematics feed, PM schedule, and work order history your fleet already runs, and turns it into the alert-driven view described above.
Diagnostic codes from your telematics provider auto-create prioritized work orders instead of sitting unread in a separate portal.
Preventive maintenance triggers off live odometer data, not a manual spreadsheet that falls out of date within weeks.
Every repair, PM job, and downtime hour rolls up into a per-vehicle cost figure updated automatically, not recalculated by hand each month.
Driver-submitted inspection issues route directly into the maintenance queue with photos, closing the loop that verbal reports leave open.
Predictive scoring on known wear components flags replacement windows before a driver notices a problem on the road.
Every metric above rolls up to a single portfolio view so a manager sees fleet health at a glance before drilling into any one vehicle.
What Fleets Report After Switching to a Predictive Dashboard
Fault codes and wear alerts caught before they become roadside failures
Per-vehicle cost visibility exposes underperforming vans early
Mileage-triggered scheduling replaces manual calendar tracking
Manual status reporting replaced by one automated portfolio view
Frequently Asked Questions
What data does a predictive delivery van dashboard actually need?
How is cost per mile calculated for a delivery van?
Can a small delivery fleet benefit from a metrics dashboard?
Does Oxmaint work with existing telematics providers?
How long does it take to set up a dashboard like this?
Build the Dashboard That Actually Predicts Downtime
A dashboard is only useful if it changes what happens next. Oxmaint turns PM compliance, fault codes, and cost per mile into a single view your team checks every morning — and acts on before a van breaks down mid-route.