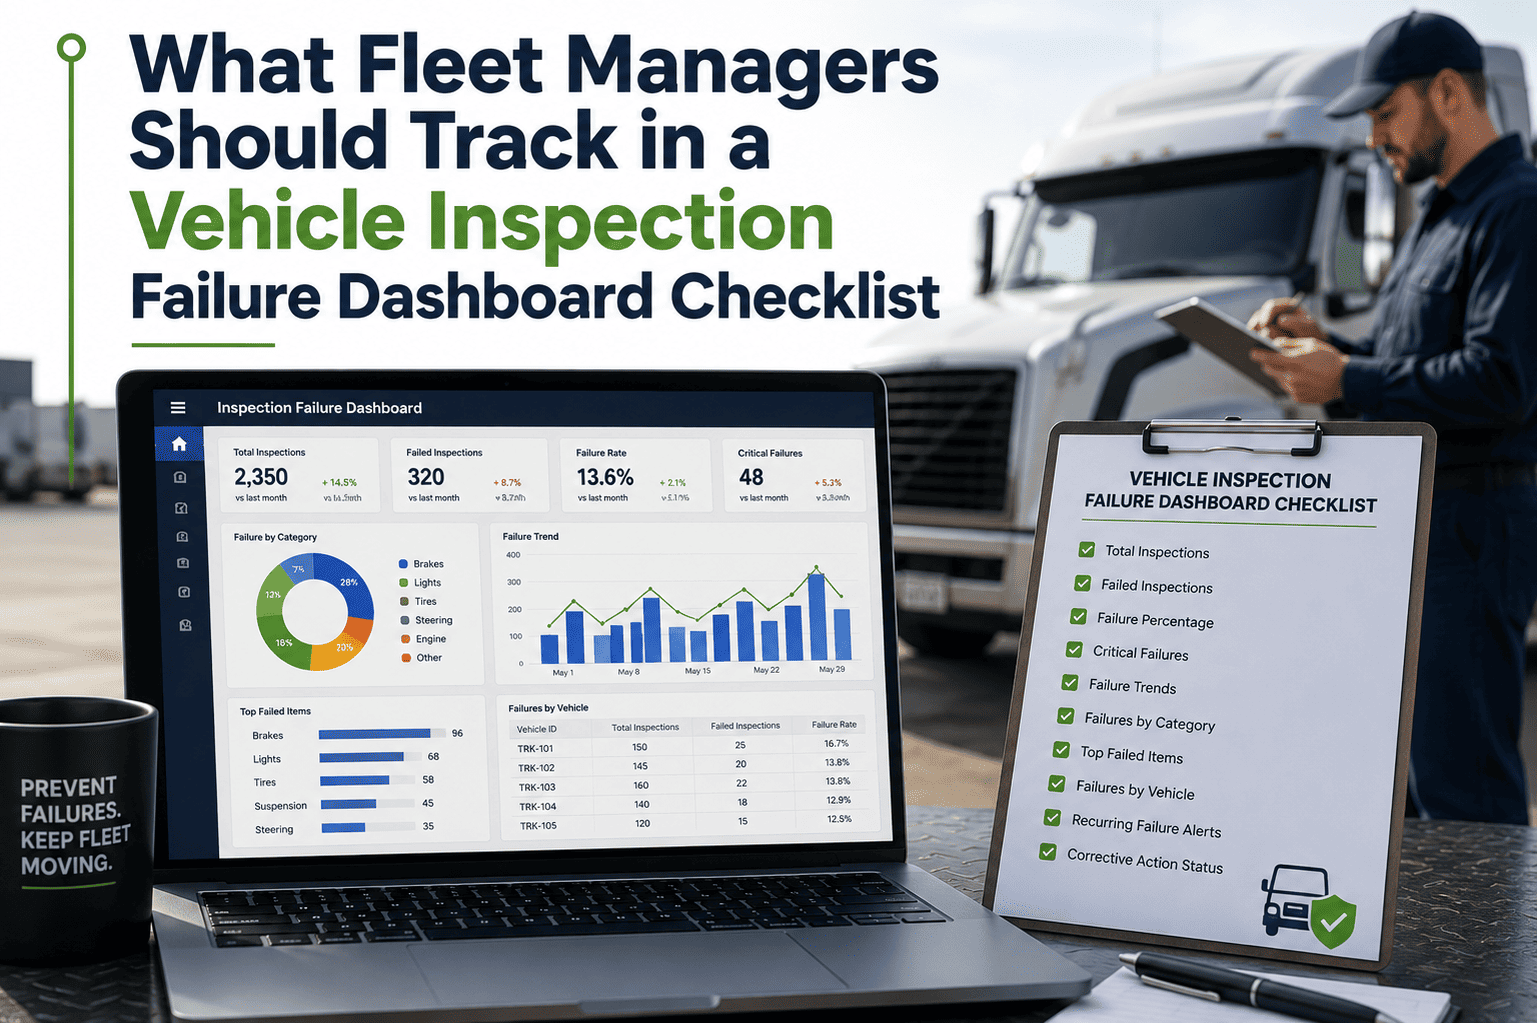
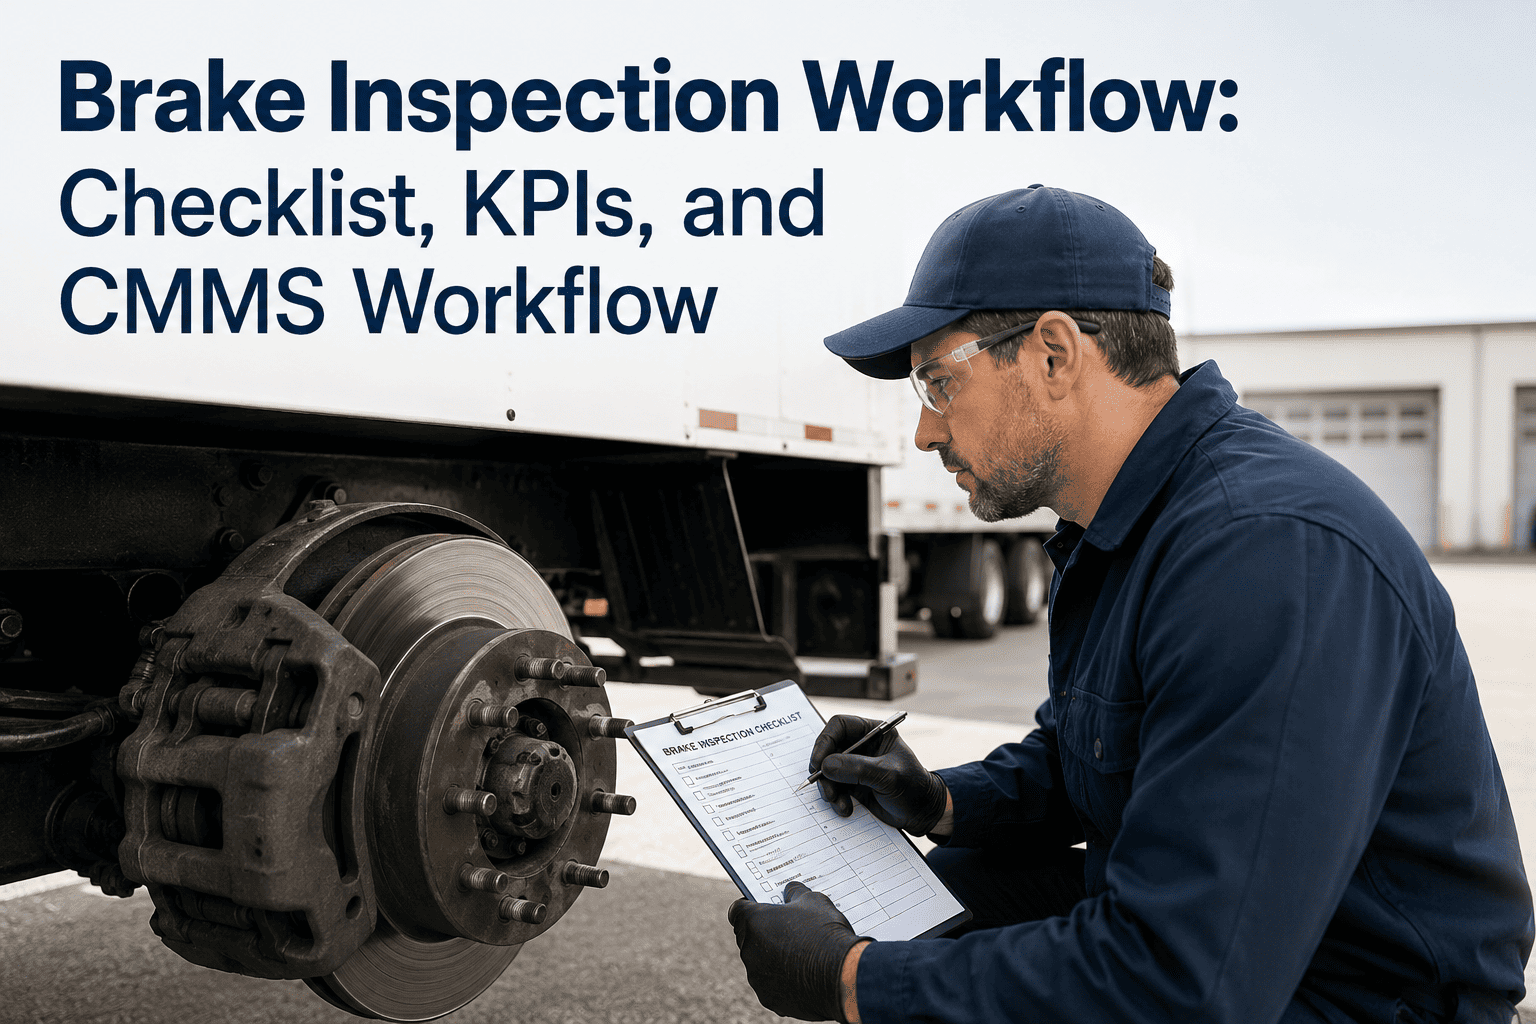
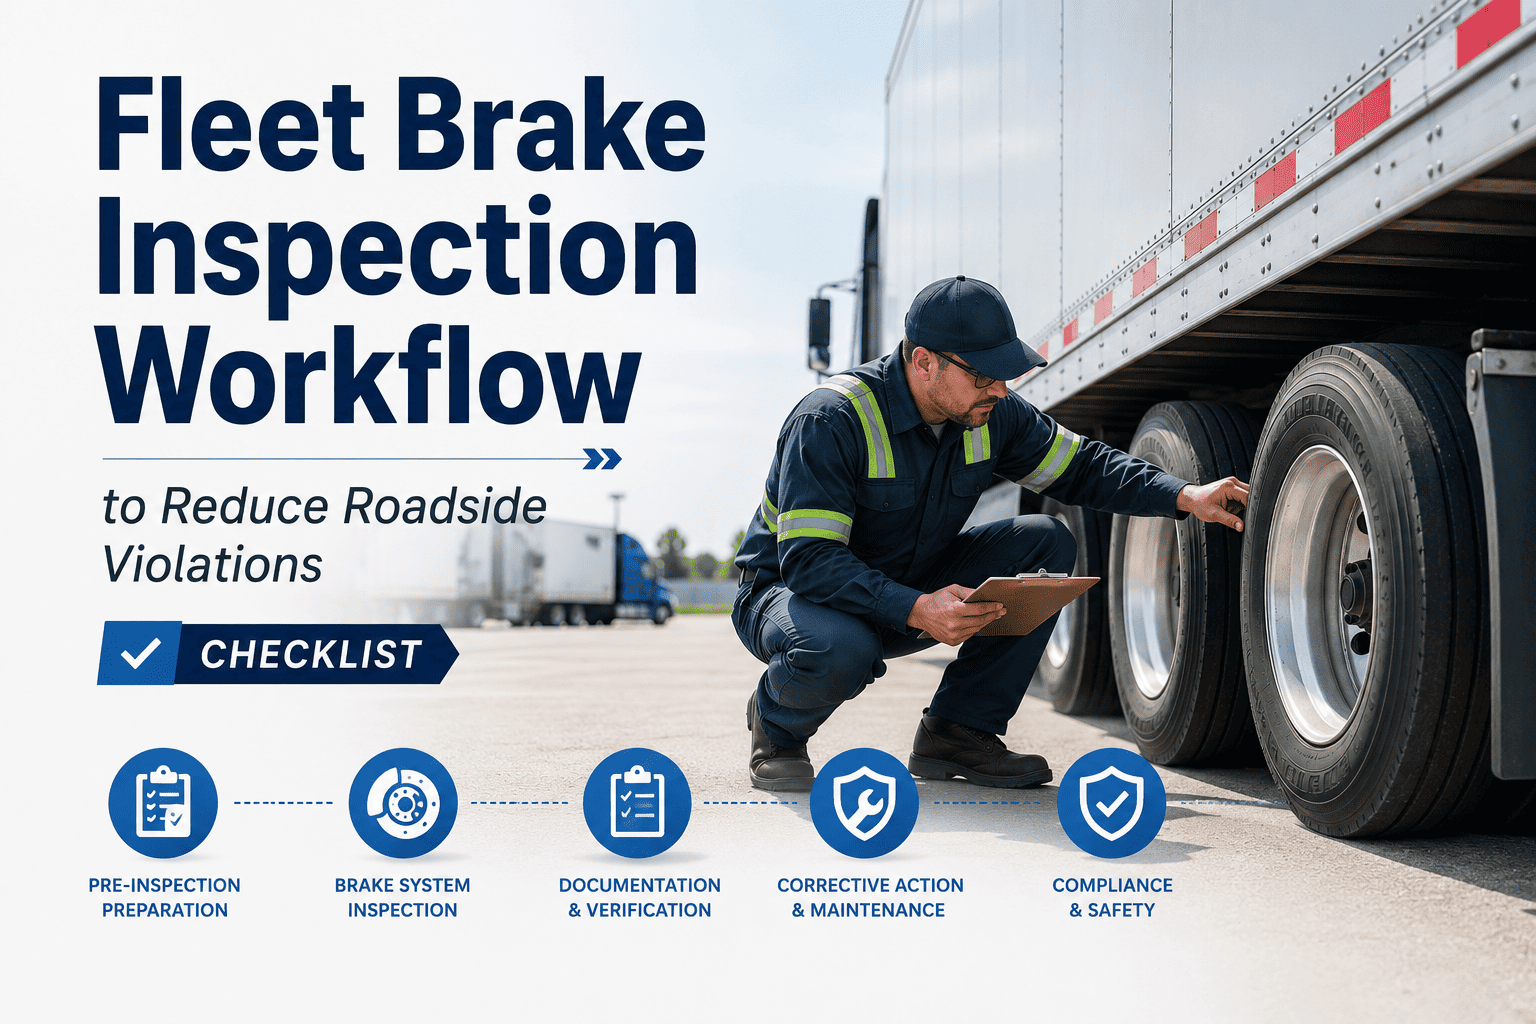
A brake inspection record stored in a filing cabinet is a compliance artifact. A brake inspection record visible on a fleet manager's dashboard is an operational tool — one that drives decisions about vehicle deployment, PM scheduling, and technician workload before a brake failure forces those decisions under pressure. Fleet managers who track the right brake inspection metrics in real time consistently reduce roadside OOS violations, lower brake-related repair costs, and extend brake component life across their fleet. Oxmaint's AI Predictive Maintenance dashboard gives fleet managers live visibility into brake inspection status, open defects, lining wear trends, and overdue inspections across every vehicle in the fleet. See what your brake dashboard should look like at app.oxmaint.ai or schedule a live walkthrough with the Oxmaint team.
Get Full Brake Inspection Visibility in One Dashboard
Oxmaint centralizes every brake inspection result, defect record, lining measurement, and compliance document into a single fleet manager dashboard — with real-time status, predictive alerts, and audit-ready reporting.
The 8 Brake Metrics Every Fleet Manager Must Track
Most fleet dashboards show whether a brake inspection happened. The dashboards that reduce brake-related incidents show what the inspection found, how it compares to the last inspection, and what will happen to that vehicle's brakes over the next 10,000 miles. Here are the eight metrics that separate reactive brake management from predictive brake control.
Inspection Compliance Rate by Vehicle
Percentage of vehicles that received their scheduled brake inspection on time. Any vehicle below 100% in the rolling 12-month period is a compliance risk. Track by individual vehicle, not fleet average — an average of 90% means 10% of vehicles are uninspected.
Average Lining Thickness by Axle Position
Track lining thickness as a numeric value at each axle position across every inspection. The degradation rate per thousand miles tells you when to schedule replacement — before the vehicle reaches the OOS threshold on the road.
Open Brake Defects by Age
Count of open brake defects grouped by days-since-detection: 0–48 hours, 2–7 days, 7+ days. A defect open for more than 48 hours without a repair work order indicates a process failure, not a scheduling delay. Any brake defect open for 7+ days requires escalation to fleet management.
Pushrod Stroke Trend by Chamber
Pushrod stroke measurement at each chamber across successive inspections. A stroke that increases by 0.1" or more between inspections indicates accelerating slack adjuster wear or adjuster malfunction. Plotting stroke trend identifies chambers approaching the OOS limit before they reach it.
Brake-Related OOS Rate
Percentage of roadside inspections that resulted in a brake-related out-of-service order, tracked per vehicle, per driver, and per route. A vehicle with two brake-related OOS events in 12 months requires a root cause review of inspection quality and repair completeness, not just another inspection.
Air System Leak Rate History
Air system pressure drop rate recorded at each inspection. A leak rate that increases from 1 psi/min to 2.5 psi/min over three inspection cycles indicates a developing air line or chamber seal failure. Tracking the trend allows repair scheduling before the rate exceeds the OOS threshold of 3 psi/min applied.
Brake Inspection Cost Per Vehicle
Total labor and parts cost of brake inspections and brake repairs per vehicle per year, divided by annual mileage. This metric identifies which vehicles have disproportionately high brake maintenance costs relative to their utilization — a signal of spec mismatch, route demands exceeding brake capacity, or repeated repair of the same component.
Technician Inspection Completion Time
Time from work order creation to inspection sign-off per technician. Inspections completed significantly faster than the standard time indicate steps are being skipped. Inspections consistently taking twice the standard time indicate a training or process issue. Both extremes produce incorrect inspection data.
Dashboard View: What to Display and When
A brake inspection dashboard is only useful if the right information is visible at the right time. Different stakeholders need different views of the same underlying data — here is how to structure dashboard access by role.
- Inspection compliance rate — fleet-wide and by vehicle
- Open defects by age and severity
- Vehicles overdue for brake inspection
- Brake-related OOS events in last 30 days
- Predicted brake replacement requirements next 30 days
- Inspection work orders assigned and completion status
- Open repair work orders by technician
- Inspection completion time by technician
- Parts inventory alerts for brake components
- Vehicles requiring re-inspection after repair
- Inspection record completeness by vehicle
- Calibration records for inspection tools
- Defect-to-repair cycle time documentation
- FMCSA-required record retention status
- Historical OOS event documentation
Oxmaint's AI Predictive Maintenance engine reads lining thickness trends across your fleet's inspection history and generates a 60-day brake replacement forecast — telling fleet managers which vehicles need brake service scheduled in the next two maintenance windows, before any component reaches the replacement threshold in the field.
Brake Inspection Dashboard Checklist — Setup Requirements
Before a brake inspection dashboard can show meaningful data, the underlying data collection process must be configured correctly. These checklist items define the setup requirements for a functional brake dashboard.
Configure Numeric Measurement Fields for All Brake Components
Inspection forms must capture numeric values — lining thickness in 32nds, pushrod stroke in inches, air pressure in psi — not just pass/fail checkboxes. Trend analysis and predictive alerts are impossible without numeric measurement history. Set measurement fields as required fields so inspections cannot be signed off without entering values.
Required for predictive analyticsDefine Alert Thresholds for Each Measured Parameter
Set alert thresholds in the system for each numeric measurement: lining thickness below 6/32" triggers a scheduled replacement alert; below 4/32" triggers an immediate action flag. Configure both the measurement threshold and the notification routing — who receives the alert, by what channel, within what timeframe after the inspection is signed off.
Required for real-time defect visibilityLink Inspection Intervals to Vehicle Asset Profiles
Each vehicle asset profile must specify the correct brake inspection interval — in miles, hours, or calendar days. The dashboard overdue indicator is only accurate if the interval is correctly configured per vehicle. Vehicles with different operational profiles (urban, highway, off-road) should have different inspection intervals set in the asset record.
Required for compliance rate trackingConfigure Defect Escalation and Repair Work Order Routing
Define the escalation path for each defect severity level: immediate OOS findings route to the fleet manager and dispatcher simultaneously; scheduled replacement alerts route to the maintenance supervisor for PM scheduling; informational findings log to the vehicle history without escalation. Incorrect routing produces either alarm fatigue or missed critical defects.
Required for defect-to-repair trackingEnable Cross-Fleet Reporting and Benchmark Comparison
Configure fleet-wide reporting views that aggregate brake inspection data across all vehicles and locations. Enable benchmark comparisons — average lining life per vehicle type, brake cost per mile by route, inspection compliance rate by location. Cross-fleet reporting reveals which vehicles, routes, or locations have systemic brake issues invisible at the individual vehicle level.
Required for fleet-level insightsFrequently Asked Questions
Build a Brake Dashboard That Actually Prevents Failures
Oxmaint gives you real-time brake inspection status, lining wear trends, open defect tracking, and predictive replacement alerts — across every vehicle in your fleet, from one screen.