A confectionery plant in Pune was manually inspecting 240 packs per minute across three lines — each operator checking fill level, seal integrity, label placement, and date code legibility in a fraction of a second. Miss rate: 2.3% of defective product reaching retail. Customer complaint cost: $340,000 per year. Regulatory risk from mislabelled allergen declarations: incalculable. They deployed AI vision inspection on their highest-volume line in 11 weeks. Within 90 days, miss rate dropped to 0.04%. Customer complaints on that line fell 94%. The system paid for itself in 4 months. AI vision inspection is no longer an emerging technology in FMCG manufacturing — it is the fastest-growing quality automation investment in the sector, driven by affordable high-resolution cameras, GPU computing, and deep learning models that can be trained on your specific defect library without a team of data scientists. This guide covers the full implementation journey — from business case to camera selection, model training, line integration, and the CMMS workflows that turn inspection data into maintenance intelligence. Start your free trial or book a demo to see how Oxmaint integrates AI vision data with maintenance work orders and quality records.
AI Vision Inspection Integration — Oxmaint
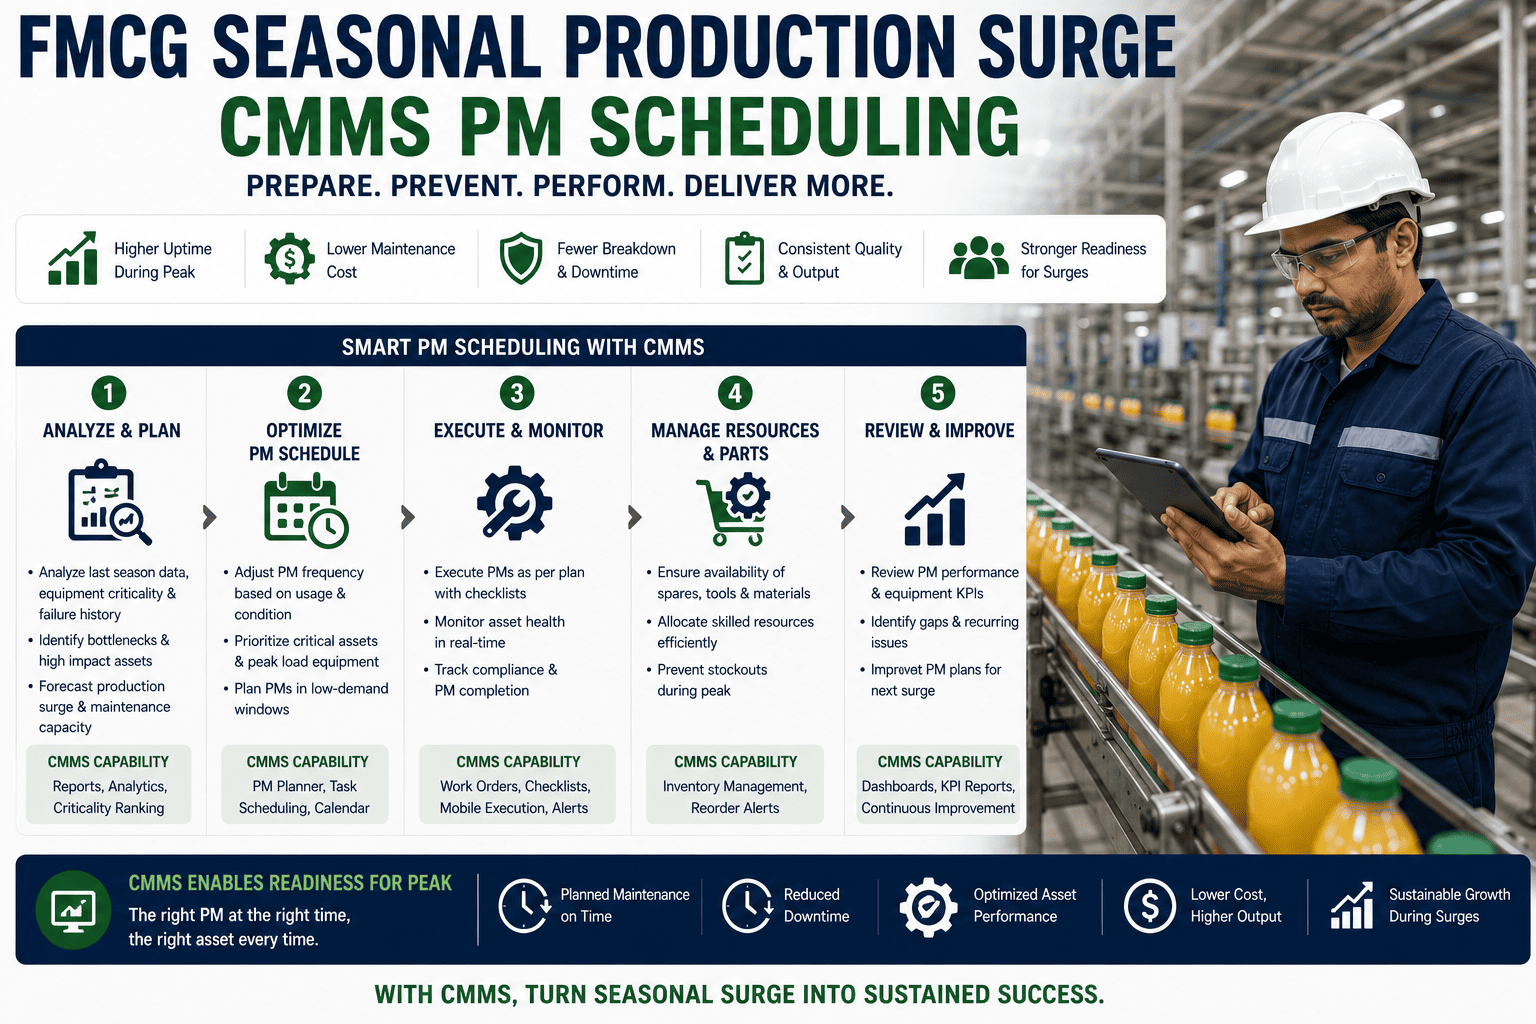
Connect Your Vision System to Maintenance. Turn Defect Data Into PM Intelligence.
Oxmaint integrates with AI vision inspection systems — linking defect spikes to specific equipment, auto-generating maintenance work orders when quality thresholds are breached, and building the traceability records that food safety auditors and retail customers require.
0.04%
miss rate achievable with AI vision vs 2–4% with manual inspection at line speed
94%
reduction in customer quality complaints within 90 days of vision system deployment
11 weeks
average time from project kick-off to first live AI vision inspection on a production line
4–8 mo
typical payback period for FMCG AI vision projects including hardware and integration costs
Why Manual Visual Inspection Fails at FMCG Line Speeds
Human visual inspection is the baseline most FMCG plants are trying to move away from — but understanding precisely why it fails helps define what the AI vision system must deliver. The limitations are not about operator effort or attention; they are fundamental constraints of human physiology operating at industrial line speeds.
240
packs/min
Typical FMCG line speed — leaves 250 milliseconds per pack for visual inspection. Human reaction time alone is 150–250ms. Zero time remains for actual defect detection.
2–4%
miss rate
Industry-documented miss rate for manual inspection at production speed. Rises to 6–8% after 2 hours of continuous inspection due to attention fatigue.
3–4×
shift variation
Defect detection rate varies 3–4x between best and worst performing shift inspectors on the same line — making quality consistency impossible to achieve.
Zero
data output
Manual inspection produces no structured defect data — no trend visibility, no root cause analysis, no early warning of developing equipment problems driving quality failures.
The Six FMCG Vision Inspection Use Cases Ranked by ROI
AI vision systems in FMCG address a spectrum of inspection challenges — from high-speed pack integrity checks to complex label verification and foreign body detection. These six use cases cover 90% of FMCG vision deployments, ranked by typical return on investment and implementation complexity.
1
Seal and Closure Integrity Inspection
Detection of incomplete seals, channel leaks, and fold defects on flexible packaging, pouches, and sachets. Highest ROI use case because seal failures cause both product safety issues and shelf-life failures — each with significant recall exposure. Camera: line-scan or area-scan at 2–5MP. Lighting: diffuse backlighting or structured dark-field. Model accuracy achievable: 99.96%+.
ROI: 6–12 mo
2
Label Verification and Date Code Reading
Correct label application (position, orientation, absence), date code legibility (OCR), and allergen declaration presence verification. Critical for regulatory compliance — undeclared allergens trigger mandatory recalls. Camera: 5–12MP area-scan. OCR model + classification model in sequence. Integration with production MES for date code validation against scheduled run.
ROI: 4–8 mo
3
Fill Level and Weight Verification
Vision-based fill level measurement for transparent and semi-transparent containers — faster feedback loop than checkweigher for line balancing. Also detects unfilled containers, double fills, and product splatter patterns indicating upstream filler maintenance requirements. Camera: line-scan with telecentric lens for accurate level measurement.
ROI: 8–14 mo
4
Surface Defect and Contamination Detection
Detection of surface contamination, foreign bodies, colour deviation, mould spots, and physical damage on products and packaging. Requires multi-spectral or hyperspectral imaging for non-visible contamination. Standard RGB vision handles visible contamination and physical defects. Deep learning models significantly outperform rule-based approaches for irregular defect shapes.
ROI: 10–18 mo
5
Case and Pallet Configuration Verification
Correct product count per case, correct SKU mix in mixed-SKU cases, and pallet pattern verification before warehouse dispatch. Prevents short-shipment claims, wrong-SKU complaints, and retailer charge-backs. 3D vision or multiple 2D cameras typically required for full case inspection.
ROI: 12–20 mo
6
Equipment Condition and Wear Monitoring
Vision-based monitoring of tooling wear, die condition, filler nozzle fouling, and conveyor belt damage — using change detection models that flag when equipment appearance deviates from clean baseline. Directly feeds maintenance work orders in Oxmaint. Connects quality data to asset health without additional sensors.
ROI: 14–24 mo
Vision-to-Maintenance Integration — Oxmaint
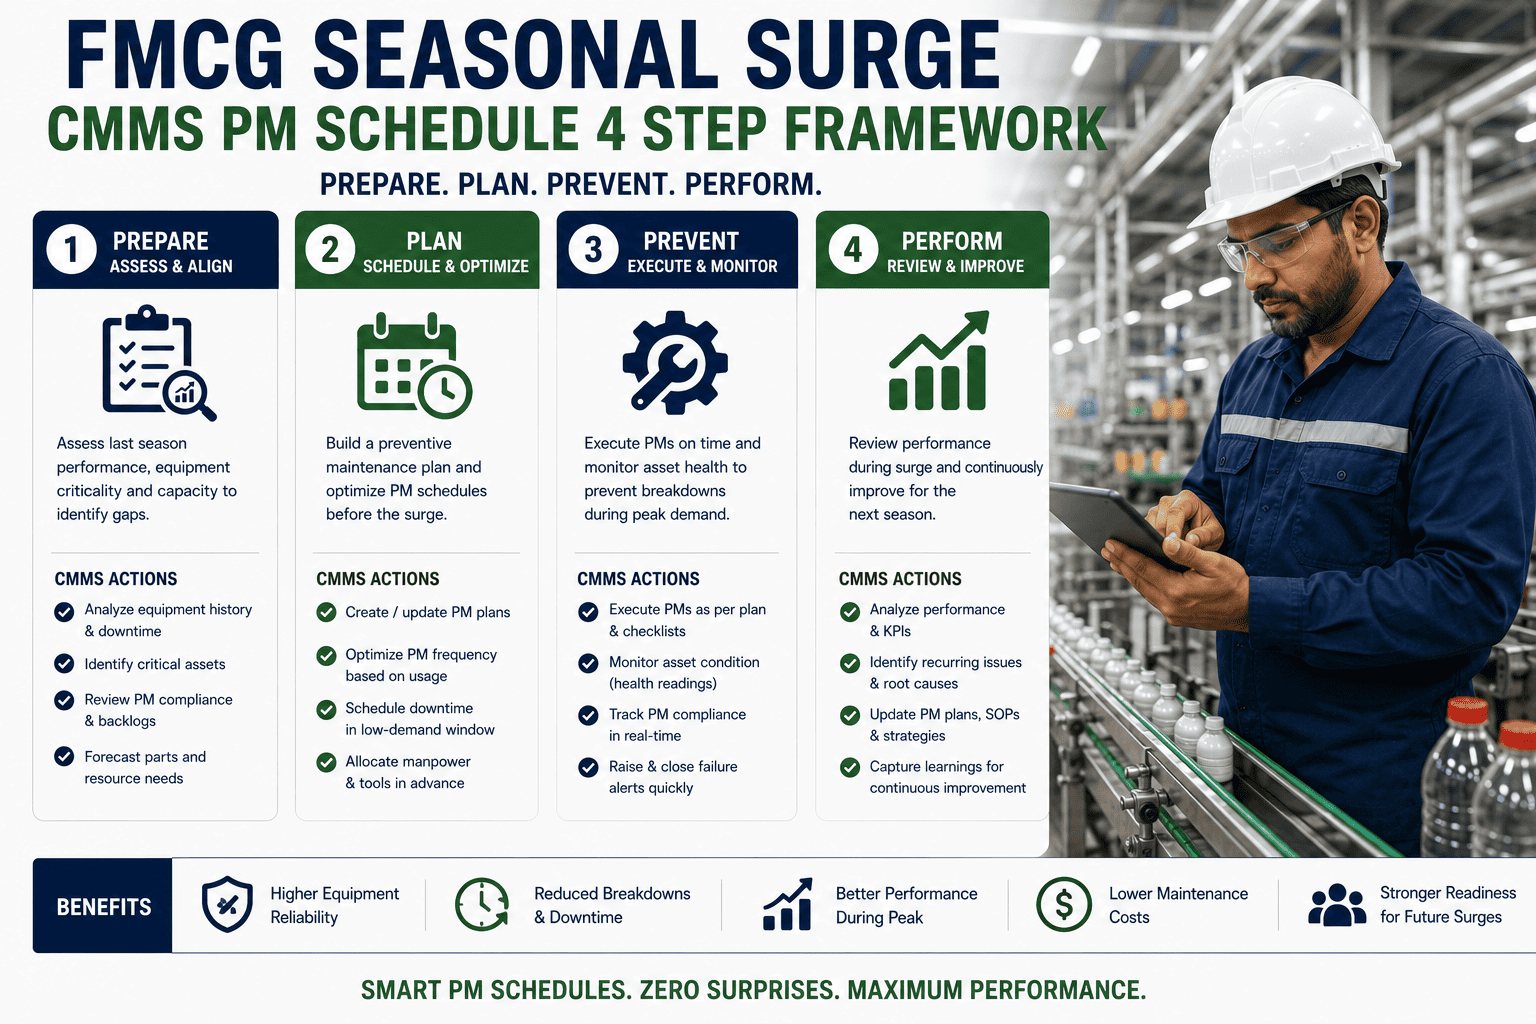
When Vision Detects a Defect Spike, Oxmaint Creates the Work Order Automatically.
Oxmaint connects to your AI vision inspection system — receiving defect rate data per asset, triggering maintenance work orders when thresholds are breached, and linking quality records to equipment history for root cause analysis.
Camera and Hardware Selection: The Technical Decisions That Determine System Performance
Camera selection is the decision most FMCG project teams get wrong — either over-specifying expensive hardware for applications that do not require it, or under-specifying for line speeds that outrun the sensor's capability. These are the six hardware decisions that determine system performance before a single line of model code is written.
Camera Type Selection
Foundation
Area-scanBest for stationary or slow-moving objects, 3D inspection, label verification. Most common in FMCG. 2–20MP range.
Line-scanBest for continuous web inspection (flexible film, labels), high-speed conveyors. Requires precise triggering.
3D visionRequired for volume measurement, deformation detection, and case configuration. Higher cost, longer integration time.
Resolution and Field of View
Accuracy
Rule of thumbSmallest detectable defect must be covered by minimum 3×3 pixels. A 0.5mm defect on a 200mm pack requires minimum 8MP at 1:1 magnification.
Over-spec riskHigher resolution = larger image files = slower processing. At 300 packs/min, processing time budget is under 200ms per image.
Practical range5MP covers 80% of FMCG seal and label inspection use cases at standard line speeds.
Lighting Design
Most Underestimated
BacklightIdeal for seal inspection, fill level, and silhouette defects. Highlights seal channel leaks clearly. LED panels behind product.
CoaxialBest for surface defects on flat reflective surfaces (foil, glass). Eliminates specular reflection that masks defects.
Dark fieldHighlights surface scratches, contamination, and embossed text. Grazing angle illumination makes subtle surface features visible.
Frame Rate and Triggering
Speed Critical
Required FPSLine speed (products/min) ÷ 60 × 1.5 safety factor = minimum camera FPS. 300 packs/min requires 7.5 FPS minimum — use 15 FPS camera.
Encoder triggerAlways use encoder-based triggering from conveyor motor, not fixed time intervals. Line speed variation causes blur with time-based triggering.
Strobe syncLED strobe duration must be under 200µs to freeze motion at 300 packs/min. Continuous lighting causes motion blur at high speeds.
Processing Hardware
Inference Speed
Edge GPUNVIDIA Jetson series for on-camera or near-camera inference. Eliminates network latency for rejection timing. Required for lines above 200 packs/min.
Industrial PCi7/i9 + RTX GPU for multi-camera systems inspecting the same line. Single inference server handling 4–6 cameras with shared model.
Latency budgetTotal inspection-to-rejection latency must be under 50ms. GPU inference 5–15ms + network 2ms + rejection actuator 20ms.
Rejection System Design
Critical for ROI
Air blastFastest actuation (5–10ms), best for lightweight packs under 200g. Pneumatic solenoid valve, no moving parts, low maintenance.
Pusher armBest for heavier products and bottles. 15–40ms actuation time. Requires precise product spacing for reliable rejection.
Diverter beltGentlest for fragile products. 50–100ms actuation. Requires 600–900mm between inspection point and diverter.
Model Training: Building an AI That Knows Your Defects
The AI model is the intelligence layer that separates vision systems that work from those that fail in production. Most FMCG vision project failures trace to model training problems — insufficient defect samples, poor image quality in training data, and models that perform in demos but drift in production as lighting and product appearance change with seasons and supplier changes.
1
Define the Defect Taxonomy
Before collecting a single image, define every defect class with clear written and visual definitions distinguishing defect from non-defect at boundary cases. Seal channel leak vs acceptable seal wrinkle. Label skew above 3mm vs acceptable tolerance. Ambiguous definitions produce ambiguous models. Involve QA, production, and customer complaints data in taxonomy creation.
Week 1–2
2
Image Collection and Labelling
Minimum dataset for reliable FMCG defect detection: 500–1,000 images per defect class, captured under production conditions (actual line lighting, actual line speed, actual product variation). Include seasonal variation, supplier variation, and pack format change examples. Label quality is more important than quantity — 800 carefully labelled images outperform 3,000 hastily labelled ones.
Week 2–5
3
Model Architecture Selection
For FMCG inspection: YOLO variants (v8, v9) for real-time object detection and defect localisation — best balance of speed and accuracy at edge deployment. ResNet/EfficientNet for classification-only tasks (pass/fail without localisation). Anomaly detection models (PatchCore, FastFlow) for surface defect use cases where defect examples are rare.
Week 3–4
4
Training, Validation, and Threshold Setting
Split dataset: 70% training, 15% validation, 15% test — with test set held completely separate until final evaluation. Target metrics: precision (minimise false rejects — production waste), recall (minimise missed defects — quality risk). For food safety defects, prioritise recall. Threshold setting is a business decision, not just a technical one.
Week 4–6
5
Production Validation — the Shadow Period
Run the model in shadow mode for 2–4 weeks before enabling rejection — model makes decisions but does not actuate the rejector. Human inspectors continue working. Compare model decisions to human decisions for every product. This period reveals false positive rate at actual production conditions and defect types where the model underperforms.
Week 7–10
6
Go-Live and Continuous Improvement Loop
Enable rejection gradually — start at 70% confidence threshold and adjust based on false reject rate monitoring. Every rejected product is a labelled training example — establish a review queue where QA samples rejected products daily and adds confirmed defects/false rejects to the training dataset. Models continuously retrained improve accuracy 15–25% in the first 6 months post go-live.
Week 11+
The Vision-to-Maintenance Connection: Turning Defect Data Into PM Intelligence
The most underutilised capability of AI vision systems in FMCG is the maintenance intelligence they generate. A defect spike is almost always an equipment event — a worn filler nozzle, a misaligned sealing jaw, a label applicator losing vacuum. Without a CMMS integration, that intelligence sits in vision system logs and never reaches the maintenance team. With integration, defect trends automatically generate work orders before the quality problem becomes a line stop.
Vision Defect Signal
Equipment Root Cause
Oxmaint Action
Seal channel leaks rising — 0.2% → 1.8% over 4 hours
Sealing jaw temperature dropping — heating element failing
Auto WO: Sealer jaw temp check + element inspection
Fill level variance increasing — ±2% → ±8%
Filler nozzle partially blocked — product buildup
Auto WO: Nozzle CIP cycle + flow rate verification
Label skew failures — sudden spike on one lane
Label applicator vacuum pad worn — reduced adhesion
Auto WO: Vacuum pad inspection + replacement
Date code illegibility — ink density dropping
Inkjet printhead fouled — requires cleaning
Auto WO: Printhead cleaning procedure
Surface contamination — product splash pattern
Filler drip tray blocked — overflow onto product
Auto WO: Drip tray clean + drain inspection
Pack damage — corner crush on specific lane
Conveyor guide rail misaligned — mechanical contact
Auto WO: Guide rail alignment check
Vision Integration — Oxmaint CMMS
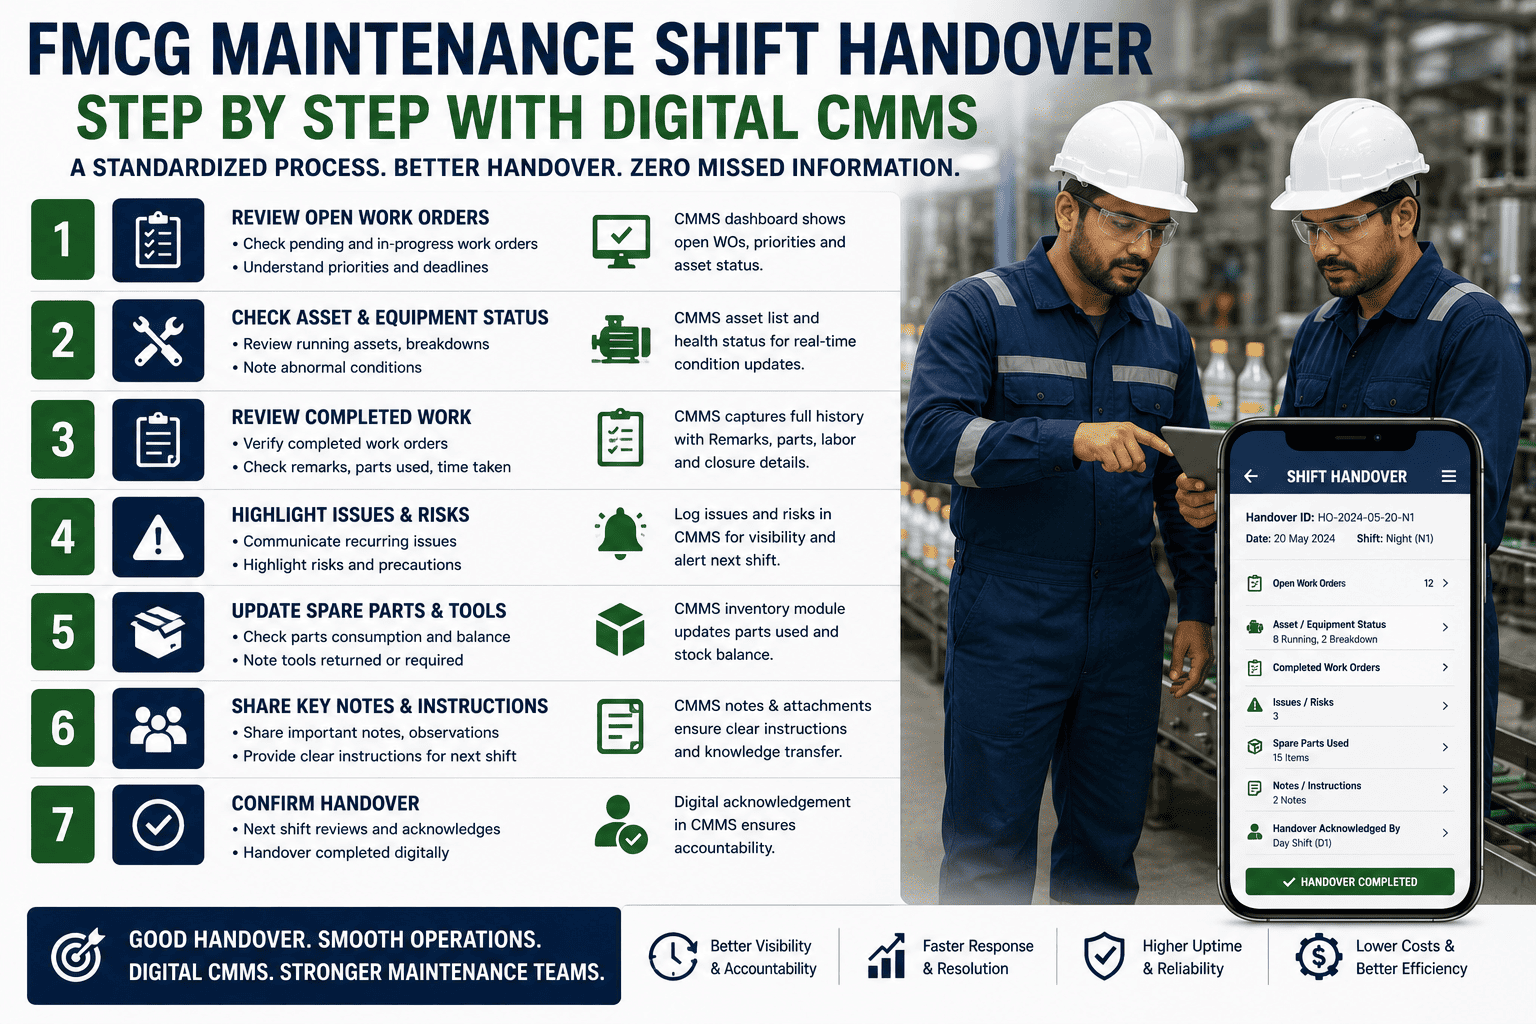
Your Vision System Sees the Defect. Oxmaint Fixes the Equipment That Caused It.
Oxmaint receives defect rate feeds from vision inspection systems and auto-generates maintenance work orders when thresholds are breached — closing the loop between quality data and equipment action without manual intervention.
Implementation ROI Framework: Building the Business Case
AI vision inspection projects in FMCG have five measurable value streams. Quantifying each for your specific operation builds the business case that gets capital approval — and sets the performance benchmarks the system is held to post-deployment.
Annual ROI Model — AI Vision Inspection
Single high-speed FMCG line · 240 packs/min · 16-hour production day · 250 operating days/year
Customer Returns and Complaint Elimination
94% reduction in defect escapes × $340K annual complaint/returns cost × retailer charge-back elimination
$320,000
Manual Inspection Labour Redeployment
3 shift inspectors per line × $38K fully loaded annual cost — redeployed to value-adding QA activities
$114,000
Downtime Reduction via Predictive Maintenance
Early defect trend detection triggers PM before line stop — 35% reduction in quality-related downtime × $18,000/hr
$189,000
Recall Risk Avoidance
Probability-weighted recall cost reduction — allergen mislabel recall avg $4.2M × 0.015 annual probability reduction
$63,000
Rework and Waste Reduction
Earlier defect detection reduces average defect batch size from 2,400 to 180 units — 92% rework reduction
$48,000
System Investment (Hardware + Integration + Training)
2× 5MP cameras, lighting, edge GPU, integration development, model training, installation, and commissioning
$95K–$160K
Net Annual Value — Single Line Vision Inspection
$734K · Payback 4–6 months
The recall risk avoidance value is deliberately conservative. A single allergen mislabelling recall costs $2M–$15M including product withdrawal, regulatory response, and brand damage. Even a small probability reduction has outsized expected value.
90-Day Implementation Roadmap
Days 1–15
Scope and Design
Define defect taxonomy with QA — written + visual examples for every class
Line speed and product range audit — camera and lighting specification
Integration points mapped — PLC, MES, rejection actuator, Oxmaint
Hardware procurement initiated — 6–8 week camera lead time
Output: Approved design specification
Days 16–40
Hardware and Data Collection
Camera, lighting, and enclosure installation — line running throughout
Image collection — 500+ images per defect class at production conditions
Rejection system mechanical installation and pneumatics connection
Oxmaint integration — defect threshold triggers and WO templates
Output: Hardware installed, dataset built
Days 41–65
Model Training and Shadow Mode
Model training with labelled dataset — validation against held-out test set
Shadow mode deployment — model runs but does not reject
Daily comparison: model vs human inspector decisions
Threshold adjustment based on shadow period false positive/negative data
Output: Validated model in shadow mode
Days 66–90
Go-Live and Optimisation
Rejection enabled — staged rollout starting at 70% confidence threshold
Daily rejected product review — confirmed defects added to training set
First Oxmaint-triggered work orders from defect trend data
30-day performance report — actual vs projected miss rate
Output: Live system, first ROI report
Common Implementation Failures and How to Avoid Them
✗
Training on Lab Images, Deploying on Production Line
Models trained on carefully staged laboratory images fail in production because actual lighting, vibration, and product variation are completely different. Every training image must be captured on the actual production line under actual production conditions — including night shift lighting differences, seasonal product colour variation, and line vibration effects.
✗
Skipping the Shadow Period to Hit a Launch Deadline
The shadow period is not optional. A model with 2% false positive rate on a 240 packs/min line rejects 4.8 good products per minute — 4,608 per shift, costing more in waste than the defects it prevents. The shadow period reveals this before it causes a production crisis.
✗
Not Planning for Model Drift
AI models degrade over time as products change — new suppliers, seasonal raw material variation, packaging redesigns. Without a retraining process and performance monitoring dashboard, accuracy degrades silently. Establish monthly model performance reviews and a continuous improvement data pipeline from day one.
✗
Treating Vision as a Quality System, Not a Maintenance System
The biggest missed value in FMCG vision deployments is the maintenance intelligence the data contains. Defect trends are equipment health signals. Treating vision as a pass/fail quality gate and ignoring the trend data means you get 30–40% of the available value. Integrate defect trend data with Oxmaint from day one.
Frequently Asked Questions
AI Vision Inspection Integration — Oxmaint
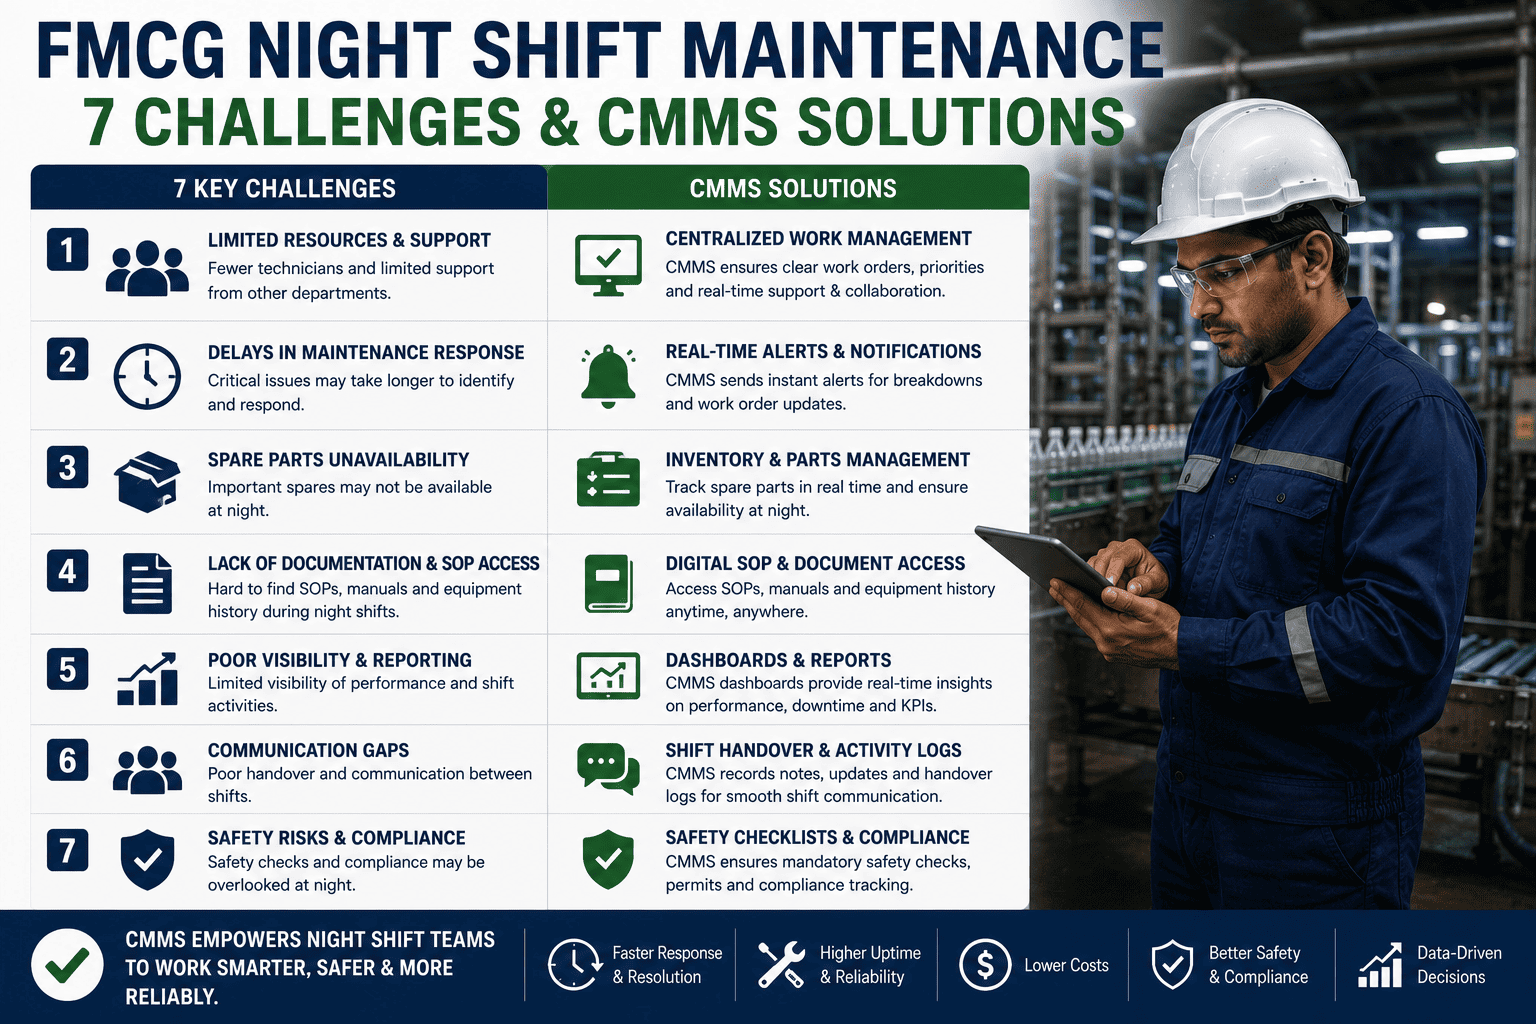
Vision Detects. Oxmaint Acts. Quality and Maintenance in One Loop.
0.04%
miss rate achievable
$734K
annual value per line
Auto WO
on every defect spike
✓Vision defect feeds trigger Oxmaint work orders automatically on threshold breach
✓Defect trend data linked to specific assets — seal jaw, filler, labeller, printhead
✓Quality records and maintenance history unified — full audit trail in one system
✓BRC, SQF, FSMA-ready inspection documentation generated automatically