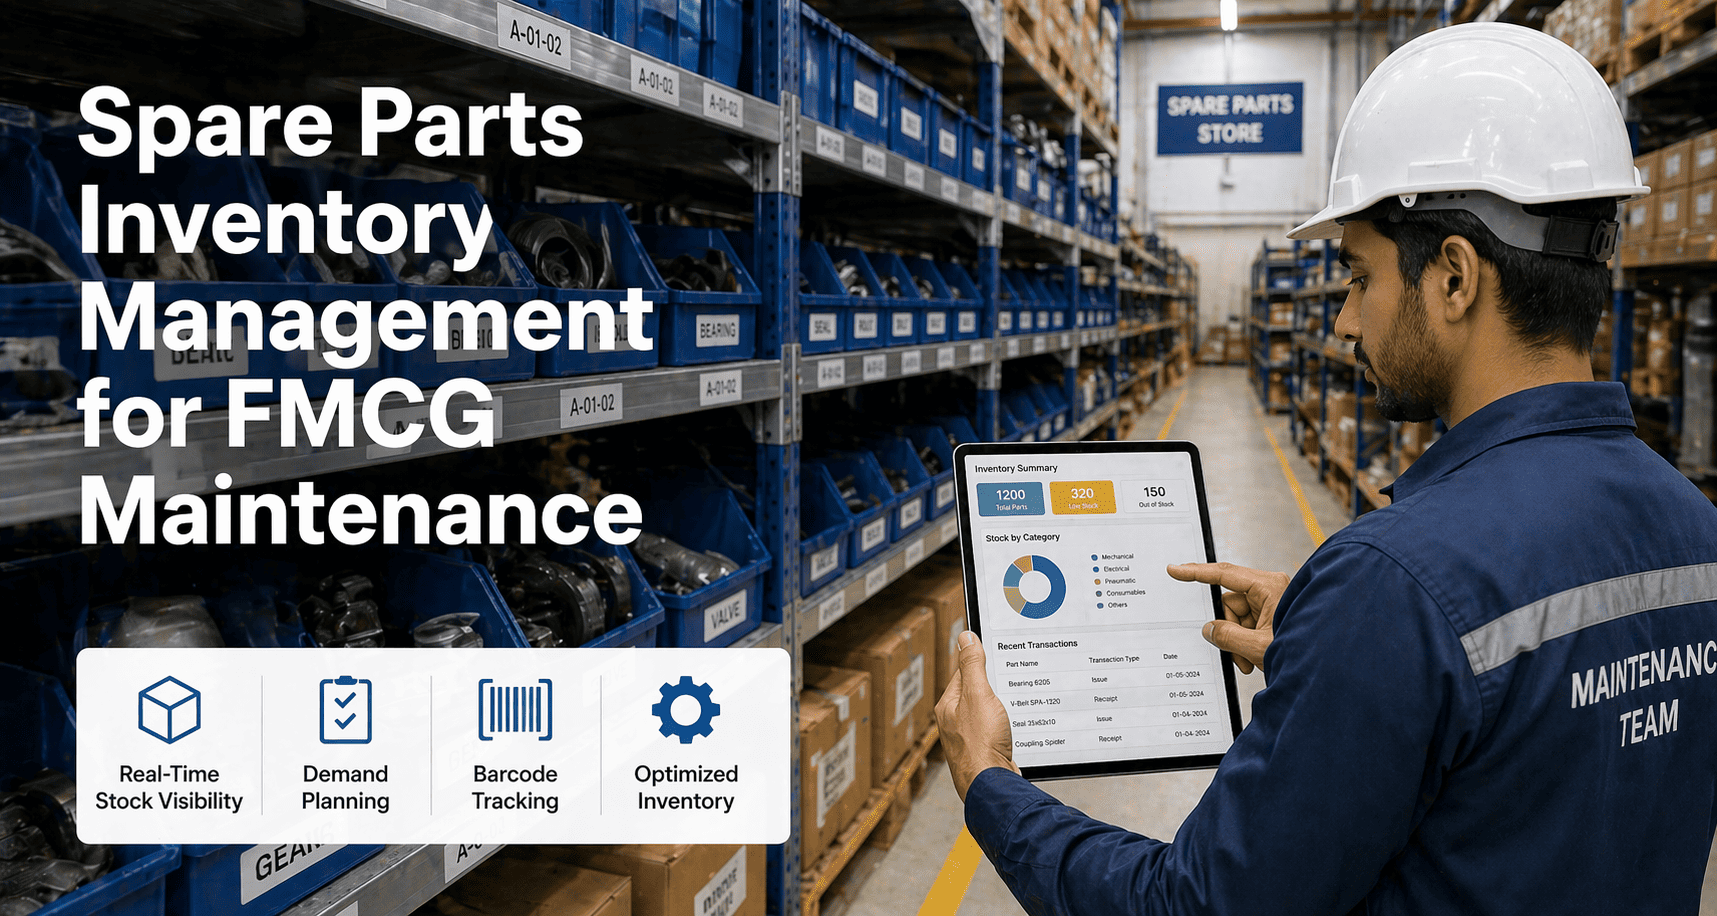
The average FMCG plant storeroom holds between $500,000 and $2 million in spare parts inventory, and somewhere between 30% and 60% of that value is dead stock — parts ordered for assets that no longer exist, duplicates created by different planners, and obsolete revisions kept "just in case." At the same time, the same plant is paying $400-$1,200 in expedited freight surcharges every week to overnight parts that should have been sitting on the shelf. Both problems trace back to the same root cause — no documented criticality ranking and no min/max framework tied to actual asset failure rates. The plants that fix this typically free up $200,000-$800,000 in working capital within 90 days while cutting emergency procurement by 40-70%. To see how OxMaint structures spare parts criticality at the component level, start a free trial or book a demo to walk through your specific storeroom.
FMCG MRO · ABC Analysis · Min/Max Optimization
Spare Parts Criticality Ranking for FMCG Plants: ABC Analysis and Min/Max Framework
Stop guessing what to stock. This guide walks through criticality ranking, ABC classification, and reorder-point math built for FMCG plants running 24/7 production — covering bottling, filling, packaging, CIP, and utilities. Free up working capital and eliminate stockouts in the same quarter.
A
Critical / High Value
20% of items · 80% of value
B
Important / Medium
30% of items · 15% of value
C
Routine / Low Value
50% of items · 5% of value
$500K-2M
Typical spare parts inventory in mid-size FMCG plant
30-60%
Of storeroom value classified as dead or obsolete stock
40-70%
Reduction in emergency procurement after criticality ranking
90 days
To rebuild a working min/max framework from scratch
Every $1 of expedited freight on a critical spare costs $7-12 in total disruption — line stop, overtime, scrap, and missed shipments combined.
The Foundation
What Is Spare Parts Criticality Ranking in FMCG?
Criticality ranking is the structured process of scoring every SKU in the storeroom against three dimensions — the consequence of stockout, the lead time to replenish, and the failure frequency of the parent asset. The output is a single criticality grade per part that drives stocking policy, reorder points, safety stock levels, and procurement urgency. Without it, every requisition becomes a judgment call by whoever happens to receive it, and the storeroom drifts toward two failure modes simultaneously — overstocking on low-criticality consumables and understocking on long-lead-time critical spares.
ABC analysis is the dollar-value layer. It splits inventory into A items (20% of SKUs that represent 80% of inventory value), B items (next 30% representing 15% of value), and C items (the remaining 50% representing only 5% of value). Combined, criticality ranking and ABC analysis form the framework that tells you exactly which parts to stock heavily, which to stock just-in-time, which to vendor-manage, and which to remove from the active catalog entirely — start a free trial to see the dual-axis classification inside OxMaint, or book a demo to discuss your specific catalog.
The Scoring Framework
Six Criticality Dimensions That Drive Stocking Policy
Every part should be scored against these six dimensions before any min/max calculation. Skipping the scoring is why most spreadsheet-based reorder systems produce wildly inaccurate stock levels — they treat all parts as equal when only 5-10% actually carry production-stopping consequences.
01
Production Impact
If the part fails and no spare exists, how long does production stop? Bottling fillers stop in 15 minutes; office HVAC stops nothing measurable.
02
Lead Time
From order placement to part on shelf — including supplier production, customs clearance, and inbound logistics. Long-lead-time parts always rank higher.
03
Failure Frequency
Historic CMMS data showing actual consumption pattern. Parts with monthly failure rates need very different stocking than five-year-MTBF components.
04
Food Safety Consequence
FMCG-specific weighting. A worn seal that allows allergen carryover or CIP residue carries higher criticality than equivalent non-contact parts.
05
Single Source vs Multi-Source
OEM-only parts with no aftermarket alternative carry higher risk weight. Multi-source commodity parts can be ordered against demand without buffer.
06
Unit Cost
Drives the ABC value classification layer. A $40,000 gearbox demands different review cycles than a $4 V-belt regardless of criticality grade.
Where FMCG Storerooms Bleed Money
Four Hidden Cost Centers in Uncontrolled Spare Parts Management
A storeroom without a criticality framework is not just inefficient — it is actively destroying cash. The four cost leaks below typically run simultaneously in plants that have grown the catalog organically over 5-10 years without periodic cleanup. Match any of these to your operation? Start a free trial to baseline your storeroom, or book a demo to discuss the cleanup framework.
Cost Leak 01
Dead Stock from Retired Assets
When a packaging line is decommissioned, the spares stay on the shelf. No cross-check between asset register and parts catalog means 15-30% of inventory belongs to equipment that no longer exists in the plant.
Cost Leak 02
Duplicate SKUs from Different Planners
The same bearing gets cataloged three times under three different descriptions by three different planners. Plant audits typically find 8-15% of total catalog is functional duplication carrying separate stock on each entry.
Cost Leak 03
Emergency Freight on Long-Lead Parts
A 12-week-lead-time gearbox component is treated as a routine consumable. When it fails, the plant pays $3,000-$8,000 in expedited international freight to avoid a 4-week line stop. This recurs 6-12 times per year.
Cost Leak 04
Stockouts on Low-Cost High-Impact Parts
A $12 O-ring shuts down a $50,000-per-hour CIP cycle because nobody set a min level. The 1,000x cost ratio between part value and consequence is the textbook reason criticality must override cost in stocking decisions.
FMCG plants that complete a criticality-driven storeroom cleanup free up $200K-$800K in working capital within one quarter.
How OxMaint Solves It
How OxMaint Builds Criticality and Min/Max Into the Asset Record
Spare parts management cannot live in a separate spreadsheet from the assets they serve. OxMaint links every SKU directly to its parent component, so criticality scoring inherits from the asset's criticality, and consumption data feeds back from work order history automatically. Start a free trial or book a demo with our MRO specialists.
Parts-to-Asset Linking
Every SKU is bound to a specific component in the asset hierarchy. Decommission an asset and OxMaint flags its dedicated spares for review — eliminating the orphan-stock failure mode.
Inherited Criticality Scoring
When an asset is graded high-criticality, its dedicated spares inherit that scoring by default. Manual override is supported for commodity items and shared spares across multiple lines.
Auto-Calculated Reorder Points
Min levels generated from consumption history, lead time, and criticality grade. Max levels balance carrying cost against stockout risk — no more guess-driven setpoints.
Duplicate SKU Detection
Catalog cleanup tools that identify functional duplicates across plants using fuzzy matching on descriptions, OEM numbers, and dimensional specs — typical first-run finds 8-15% duplication.
Cross-Plant Spares Visibility
For multi-site portfolios, see total network inventory of any SKU. Pull a part from a sister plant before paying expedited freight to an OEM supplier on the other side of the world.
Audit-Ready Procurement Records
Every purchase order, receipt, and consumption transaction is logged against the asset, the work order, and the user — meeting BRCGS, SQF, and FDA traceability requirements without manual export.
Reactive vs Planned Storeroom Management
Uncontrolled Storeroom vs Criticality-Ranked MRO Inventory
The operational and financial gap between the two approaches is wider than most plants realize until they run the numbers side by side. The table below reflects typical 90-day improvement targets after implementing structured criticality ranking and min/max framework.
| Dimension |
Uncontrolled Storeroom |
Criticality-Ranked Inventory |
| Total Inventory Value |
$1.2M baseline (with $400K dead stock) |
$700K-850K active value |
| Active SKUs in Catalog |
4,500-6,000 (with duplicates) |
3,200-4,000 (deduplicated) |
| Stockout Frequency on A-Critical Items |
15-25 events per year |
1-3 events per year |
| Emergency Freight Spend |
$50,000-$120,000 per year |
$15,000-$30,000 per year |
| Inventory Turn Ratio |
0.4-0.7 turns per year |
1.8-2.5 turns per year |
| Storeroom Labor Hours |
Manual reactive picking and reordering |
40% reduction via automated reorder triggers |
| Carrying Cost as % of Inventory |
25-30% per year |
18-22% per year |
| Audit Preparation Time |
2-3 weeks of manual reconciliation |
Live reports — zero prep needed |
| Working Capital Released |
Baseline |
$200K-$800K freed in first 90 days |
| Vendor-Managed Inventory Coverage |
0-5% of catalog |
30-45% of C-class items on VMI |
ROI and Outcome Metrics
Measurable Results from FMCG Storeroom Restructure
$
$200K-800K
Working Capital Released
Cleanup of dead stock, duplicate SKUs, and obsolete revisions typically frees this much cash in the first quarter of restructure.
%
40-70%
Reduction in Emergency Procurement
Correctly set min levels on A-criticality long-lead parts eliminate the majority of expedited freight surcharges within 6 months.
x
3-5x
Improvement in Inventory Turn Ratio
From typical 0.4-0.7 turns per year to 1.8-2.5 turns within 12 months by eliminating non-moving stock and right-sizing buffers.
↓
85-95%
Reduction in Stockout-Driven Downtime
When the right parts are in stock for the right assets at the right reorder points, parts-driven line stops virtually disappear from the downtime ledger.
Storeroom restructure pays for itself in working capital release alone — typically within 90 days. Start a free trial to model the savings on your catalog, or book a demo for a guided ROI walkthrough.
Frequently Asked Questions
FMCG Spare Parts Criticality and Min/Max FAQ
How long does it take to complete a full criticality ranking on an existing FMCG storeroom?
For a mid-size plant with 4,000-6,000 active SKUs, expect 60-90 days for the full restructure — covering parts-to-asset linking, criticality scoring, duplicate detection, dead stock writeoff, and min/max recalculation. The first 30 days alone usually identify enough dead stock and duplicates to fund the rest of the project.
Book a demo to scope your specific catalog.
What is the difference between ABC analysis and criticality ranking?
ABC analysis classifies parts by dollar value — A items represent 80% of inventory value, B items 15%, and C items 5%. Criticality ranking classifies parts by stockout consequence — production impact, lead time, and failure frequency. A $4 O-ring can be C-value but A-criticality. Both layers are needed; one without the other produces incorrect stocking decisions.
Start a free trial to see the dual classification.
How are min and max reorder levels calculated for FMCG critical spares?
Min level equals lead time consumption plus safety stock for the criticality grade. Max level equals min level plus the economic order quantity. For an A-criticality long-lead part, safety stock is typically 1.5-2x average lead time consumption. For C-criticality short-lead parts, safety stock is near zero or vendor-managed. OxMaint automates these calculations using historic consumption data.
Can OxMaint handle multi-site spare parts visibility across an FMCG portfolio?
Yes. Portfolio-level dashboards show total network inventory of any SKU across all plants — so before paying expedited freight on a part, the planner can check if a sister plant has stock. Cross-plant transfer workflows are built in, with audit-ready transaction records linking the part to the source asset, destination asset, and approving manager.
FMCG MRO · 90-Day Restructure · Audit-Ready
Stop Losing Millions to Dead Stock and Emergency Orders
Turn every spare part into a criticality-ranked, min/max-controlled record linked to the asset it serves. OxMaint frees $200K-$800K in working capital within 90 days while cutting emergency procurement by 40-70% and eliminating stockout-driven downtime on critical lines.
Real-time asset and storeroom visibility
Predictive reorder-point automation
5-10 year CapEx forecasting on spares
Used by operations teams managing 10,000+ assets · Works across multi-site portfolios · Live in days, not months