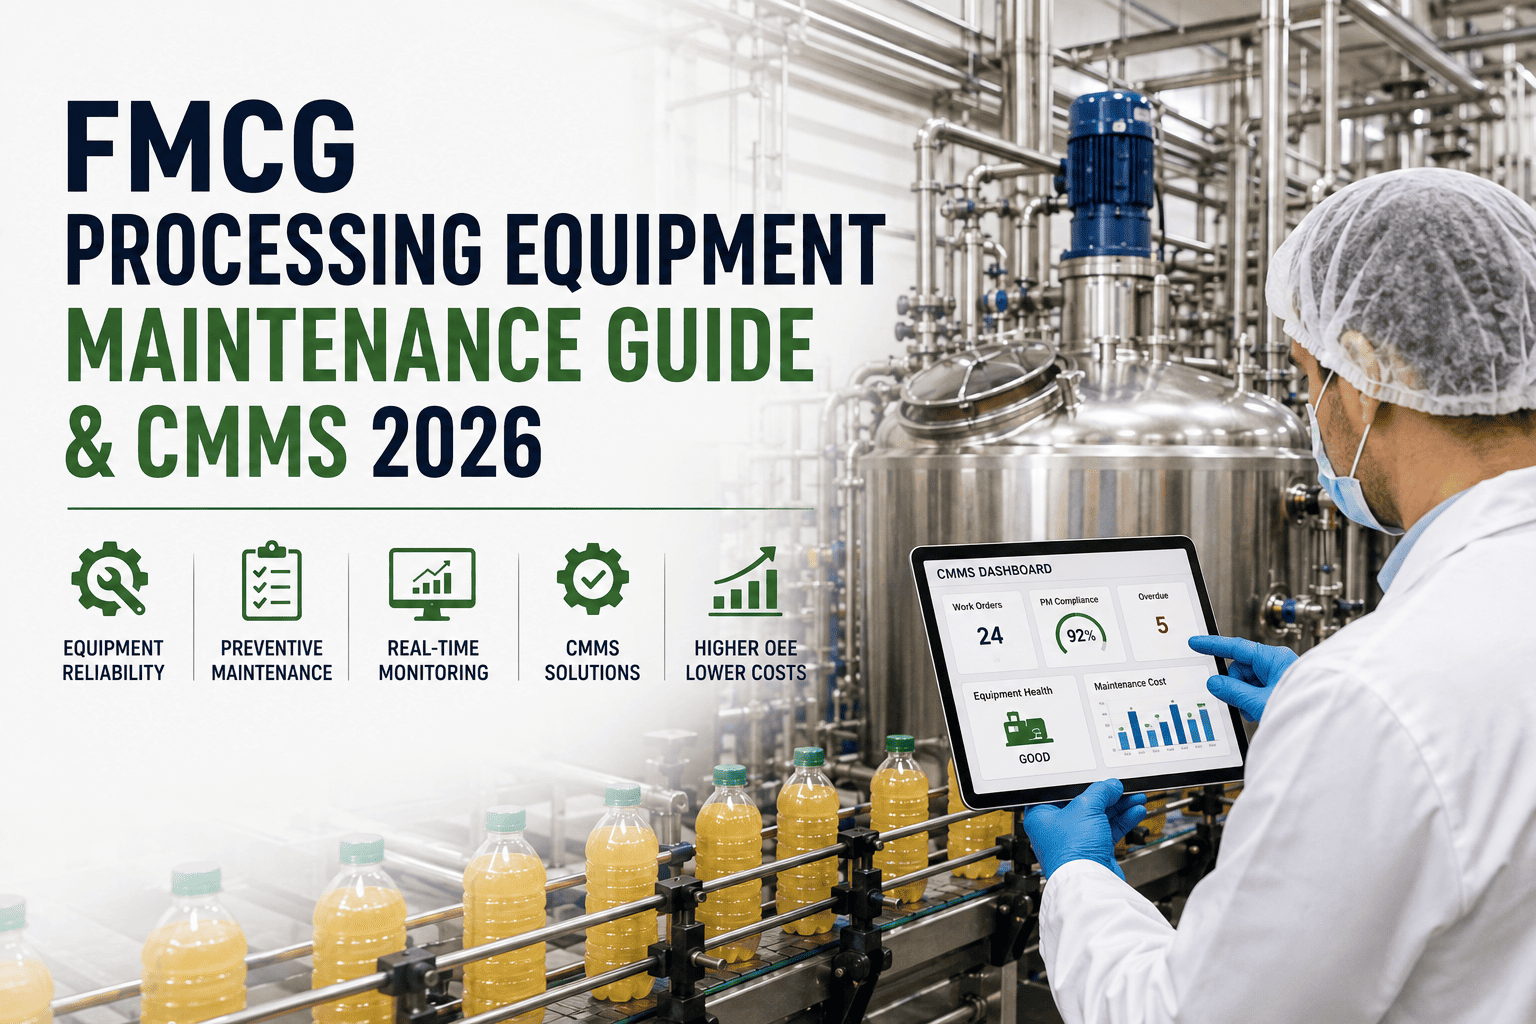
Fast-moving consumer goods production lives or dies on the wet side of the plant — every filler, capper and case packer downstream is silently held hostage by the availability of mixers, blenders, heat exchangers and homogenizers upstream. When a single 5,000-liter batch tank drops off-line for an unplanned four-hour repair, the consequence is rarely just the parts invoice; it is a starved packaging line, a missed OTIF window and an OEE number that takes weeks to recover. This 2026 guide breaks down the preventive maintenance library, sanitary-design considerations and CIP-integration tactics that separate top-quartile FMCG processors from the rest, and shows how a CMMS-driven reliability program keeps upstream availability locked to packaging demand. If you want to skip ahead and see the platform in your own plant, you can Start Free Trial and configure a processing-line PM library in under an hour.
Is your processing line feeding packaging — or starving it?
Across FMCG plants, packaging lines run at 72–78% OEE while processing availability drags 10–15 points behind. The gap is rarely a capacity problem — it is a PM, CIP-synchronization and asset-data problem, and it is exactly what a CMMS-driven processing reliability program is built to close.
Five wet-side asset classes, five failure signatures
A defensible PM library does not treat "processing equipment" as one bucket. Each asset class has a distinct failure distribution, sanitation constraint and criticality tier — and the CMMS must mirror that structure or the planner's work queue becomes noise.
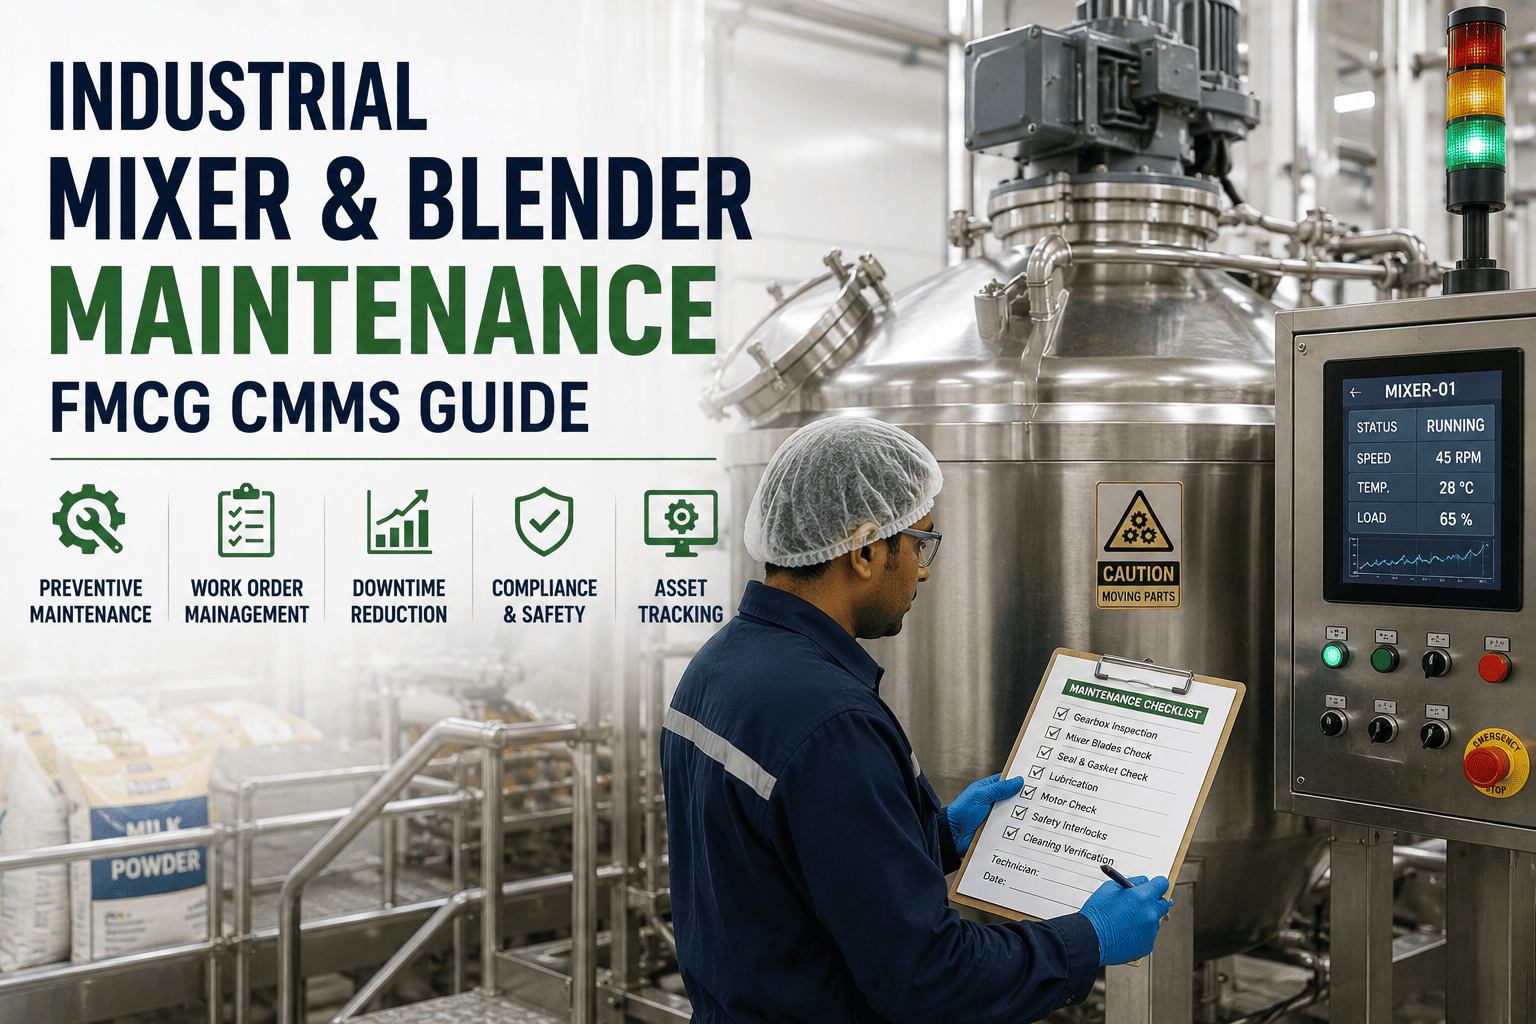
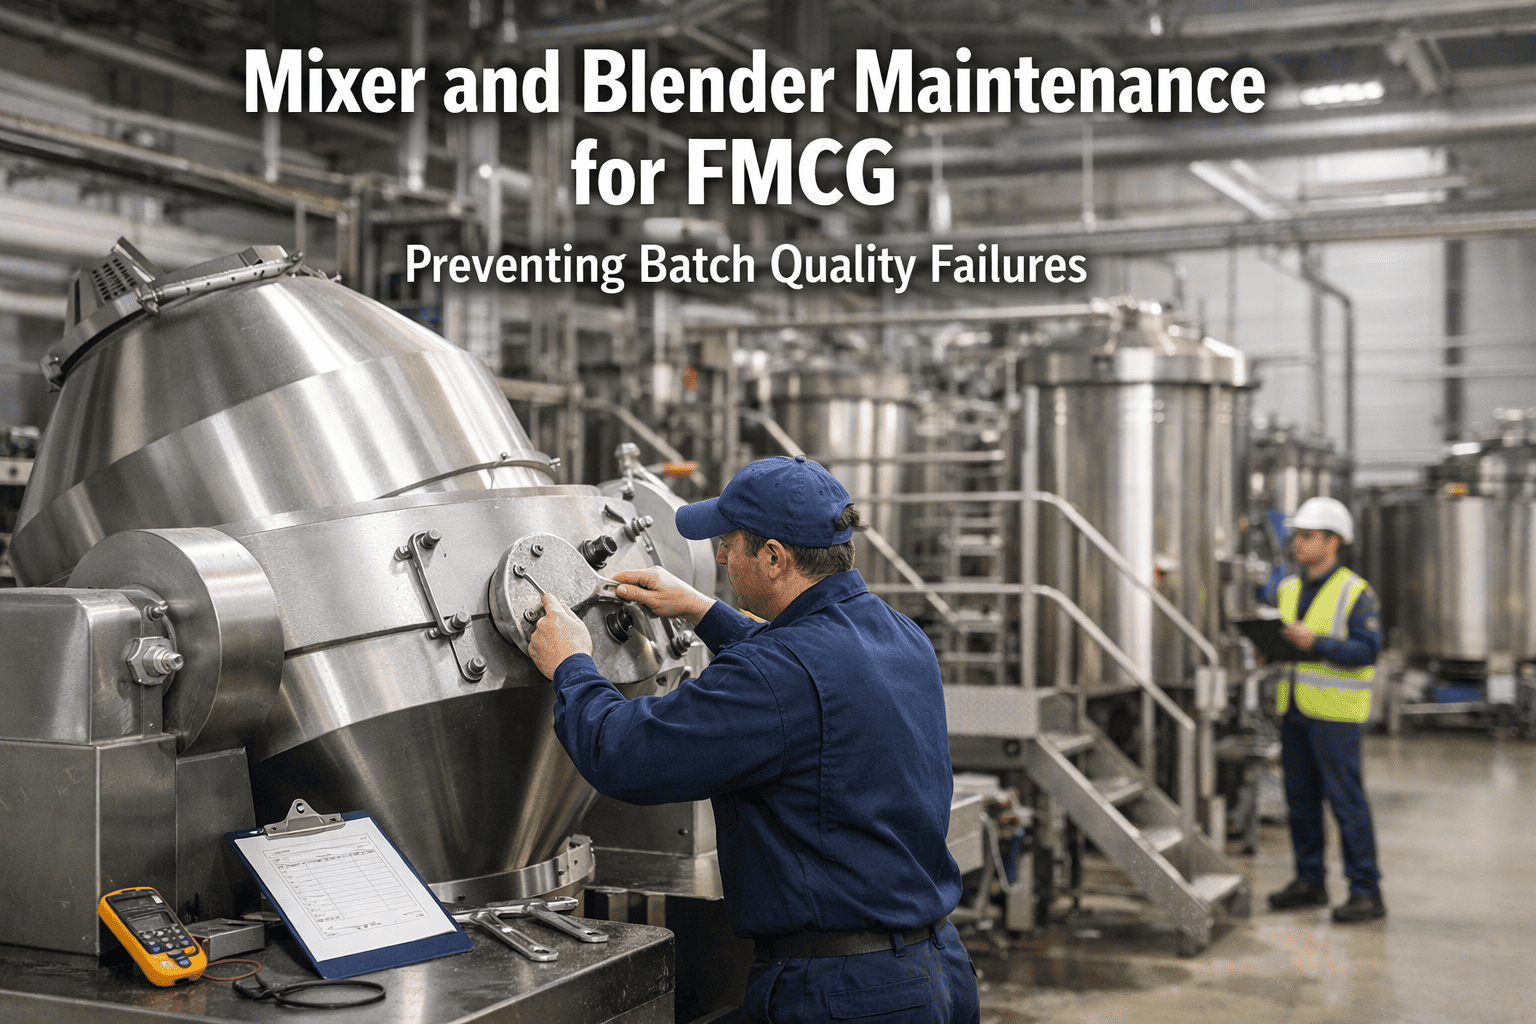
Ribbon & Paddle Mixers
Shaft seal weep, bearing temperature creep and ribbon-to-wall clearance drift account for roughly 61% of unplanned mixer stoppages. Vibration at the drive end almost always precedes a seal failure by 10–14 days.
Turbine & Vacuum Blenders
Vacuum pump oil degradation and shaft mechanical-seal washout are the two chronic offenders. A 12% drop in vacuum hold-time predicts a seal failure within 6 shifts — measurable, not guessable.
Plate & Tubular Heat Exchangers
Gasket fatigue, plate fouling and thermal-efficiency decay drive 68% of HX downtime. A 3°C rise in approach temperature at constant flow signals fouling that cleaning will no longer recover — re-gasket is overdue.
High-Pressure Homogenizers
Valve-seat and seat-insert wear dominate, with a typical 2,800–3,400 operating-hour life before particle-size drift breaches spec. Pressure-ripple signature is the leading indicator technicians should trend, not just peak PSI.
Process & Storage Tanks
Agitator gearbox oil, jacket-spray-ball integrity and load-cell drift are the silent availability killers. A 2° load-cell zero drift can trigger a 4% batch-weight error — enough to fail a QA hold on a tight formulation.
Positive Displacement Pumps
Stator wear in progressing-cavity and lobe pumps shows up first as a 5–8% flow decay at rated differential pressure. Trending flow-per-amp lets a CMMS auto-trigger a stator swap before a CIP cycle fails velocity threshold.
The processing-availability formula packaging feels
Most plants measure packaging OEE and wonder why it stalls at 75%. The constraint is rarely the filler — it is the upstream availability coefficient that governs whether the filler ever gets a chance to run. Quantify it, and the CMMS work-order backlog suddenly has a dollar value.
Processing availability is the product of each series asset's uptime (UA, UB, UC) multiplied by the CIP-cycle reliability coefficient. One asset at 88% drags the whole series to ~76% — before CIP risk is layered on.
Net savings equals the MTBF gain multiplied by hourly line value, minus the lifecycle cost of preventive plus corrective work. For an $8,200/hr line, a 90-hour MTBF gain is worth $738K before PM cost is netted.
A mid-size dairy and beverage plant running 180 processing assets across two lines was spending $42K/yr on reactive seal and bearing repairs, with an additional $311K in lost production from packaging starvation events. After mapping the PM library by asset class and shifting 64% of corrective work to planned PM triggers inside the CMMS, MTBF rose 41% over nine months. Reactive spend dropped to $14K, packaging-line availability gained 6.2 points, and the program paid for itself in under five months. The lever was not more labor — it was the right trigger at the right interval, enforced by the CMMS.
Where hygienic design meets maintenance trigger logic
3-A Sanitary Standards and EHEDG Doc. 8 are not just procurement checkboxes — they define the maintenance boundary. Every hygienic-design clause (drainability, surface finish Ra ≤ 0.8 µm, no dead legs > 1.5× pipe ID) maps directly to a PM trigger inside a mature CMMS. Ignore the mapping and the CIP cycle becomes a hidden failure mode.
Sanitary PM Triggers
- Gasket elastomer swap at 90-day or 200-cycle threshold
- Spray-ball rotation verify — monthly, before tank CIP
- Surface Ra audit at seal faces — quarterly profilometer
- Dead-leg inspection — borescope, semi-annual
- Valve-seat flush & re-seat after every 120 CIP cycles
CIP Integration Triggers
- Conductivity probe calibration — 30-day
- Heat-exchanger ΔT trend — log after each CIP
- Flow velocity verify > 1.5 m/s — weekly
- CIP return pump amp-trend — daily CMMS log
- Cycle-time deviation > 8% auto-creates work order
Reliability KPIs
- MTBF by asset class — monthly CMMS roll-up
- PM compliance > 92% — weekly planner review
- CIP first-pass success > 96% — trend per line
- Mean time to repair — target < 2.1 hr
- Wrench-time ratio — target > 38%
Time-based vs condition-based — when to shift
A 2026-grade CMMS does not ask technicians to choose between time-based and condition-based PM — it blends them. The matrix below shows the dominant trigger strategy per asset class and the leading indicator that justifies the shift from calendar to condition.
| Asset Class | Trigger Type | Cadence | Leading Indicator | Failure Window |
|---|---|---|---|---|
| Ribbon Mixer | Condition + Time | 250 / 1,500 hr | Vibration at drive end | 10–14 days |
| Vacuum Blender | Condition-led | 200 hr vac test | Vacuum hold-time decay | 6 shifts |
| Plate Heat Exchanger | Condition-led | Weekly ΔT | Approach-temp rise ≥ 3°C | 2–3 weeks |
| Homogenizer | Time + Condition | 500 / 3,000 hr | Pressure ripple signature | 200–400 hr |
| Process Tank | Time-based | 30 day / 6 mo | Load-cell zero drift | Batch-weight error |
| PD Pump | Condition-led | 1,000 / 4,000 hr | Flow-per-amp decay | 3–5 weeks |
From PM chaos to packaging-fed availability
A realistic CMMS rollout for an FMCG processing line is not a quarter-long IT project — it is a nine-month reliability program with measurable gates at each phase. The timeline below is the path top-quartile plants follow.
Asset criticality & data baseline
Map every processing asset to criticality tier, capture nameplate data, build the asset hierarchy and establish baseline MTBF, MTTR and OEE per line. Target: 100% asset register completeness with criticality scored.
PM library build & sanitation mapping
Author the PM library by asset class, map 3-A / EHEDG clauses to triggers and configure CIP-cycle KPIs. Target: PM coverage on 95% of Tier-1 assets, with task templates tied to sanitary-design points.
Condition-trigger migration
Shift the top 30% of high-failure assets from calendar PM to condition-led triggers — vibration, ΔT, vacuum hold, flow/amp. Target: 30% of work orders auto-generated from condition data.
CIP-CMMS loop & packaging sync
Close the loop between CIP cycle data and CMMS work-order generation, and sync processing PM windows to packaging-line changeover slots. Target: packaging starvation events down 60%, OEE up 4–6 points.
Stop firefighting processing downtime — start trending it.
Deploy a CMMS-built PM library for your mixers, homogenizers, heat exchangers and tanks in under a week, and watch packaging-line availability climb as upstream MTBF does.
FMCG processing maintenance & CMMS — answered
How does a CMMS specifically improve FMCG processing equipment availability?
A CMMS enforces the PM library by asset class — so a homogenizer gets valve-seat triggers at 3,000 hours, not a generic "check pump" task. It trends leading indicators like vibration, ΔT and vacuum hold-time, auto-generates work orders when thresholds breach, and gives planners a single view of PM compliance, MTBF and CIP first-pass success. Plants typically gain 4–6 OEE points on packaging within nine months because upstream availability stops being the constraint. You can see the configuration in your own asset list when you Start Free Trial.
What is the ideal PM cadence for mixers and blenders in an FMCG plant?
For ribbon and paddle mixers, a defensible baseline is a 250-hour lubrication and seal-inspection PM, with a 1,500-hour clearance and vibration check. Vacuum blenders should run a 200-hour vacuum hold-test and oil inspection, with a full seal teardown at 1,000 hours. The cadence should shift to condition-led once you have 90 days of vibration and vacuum data — calendar PM is the floor, not the ceiling.
How should CIP cycles be integrated with the CMMS?
Treat every CIP cycle as a data event, not just a cleaning step. Log conductivity probe calibration, heat-exchanger ΔT, flow velocity and return-pump amps into the CMMS after each cycle, and configure an auto-work-order when cycle-time deviates more than 8% from baseline or velocity drops below 1.5 m/s. This turns CIP from a hidden failure mode into a leading indicator of gasket, spray-ball and heat-exchanger health.
What sanitary-design standards should drive processing PM triggers?
3-A Sanitary Standards and EHEDG Doc. 8 are the two frameworks most FMCG plants anchor to. Each clause — surface finish Ra ≤ 0.8 µm, drainability, no dead legs greater than 1.5× pipe ID, gasket elastomer compatibility — maps to a concrete PM trigger. The CMMS should store the standard reference against the task so an auditor can trace any PM back to its hygienic-design basis in seconds.
How long does it take to deploy a CMMS for an FMCG processing line?
A focused rollout for a single processing line with 80–200 assets takes eight to twelve weeks to a functioning PM library, and nine months to a full condition-led reliability program with CIP integration.We will map your asset classes, criticality tiers and PM triggers before the call ends.
Your packaging line is waiting on your processing line. Fix the upstream first.
Join the FMCG plants using oxmaint to run PM libraries by asset class, integrate CIP data and push processing availability past 93% — so packaging finally gets the feed it was designed for.
Free 14-day trial · No credit card