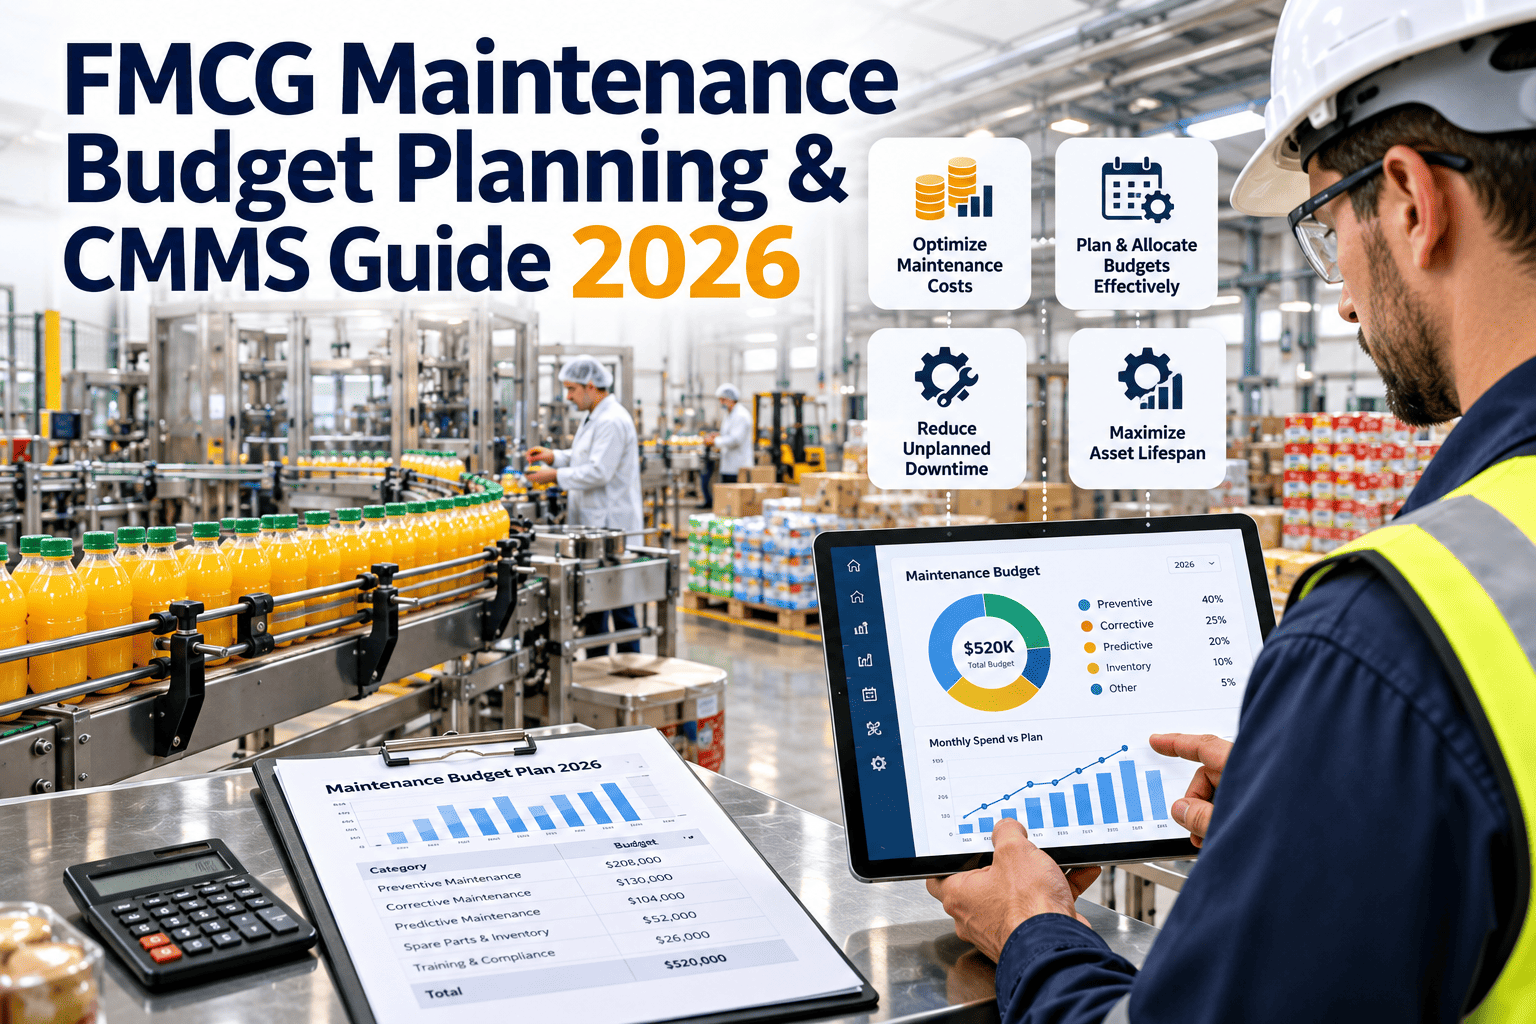
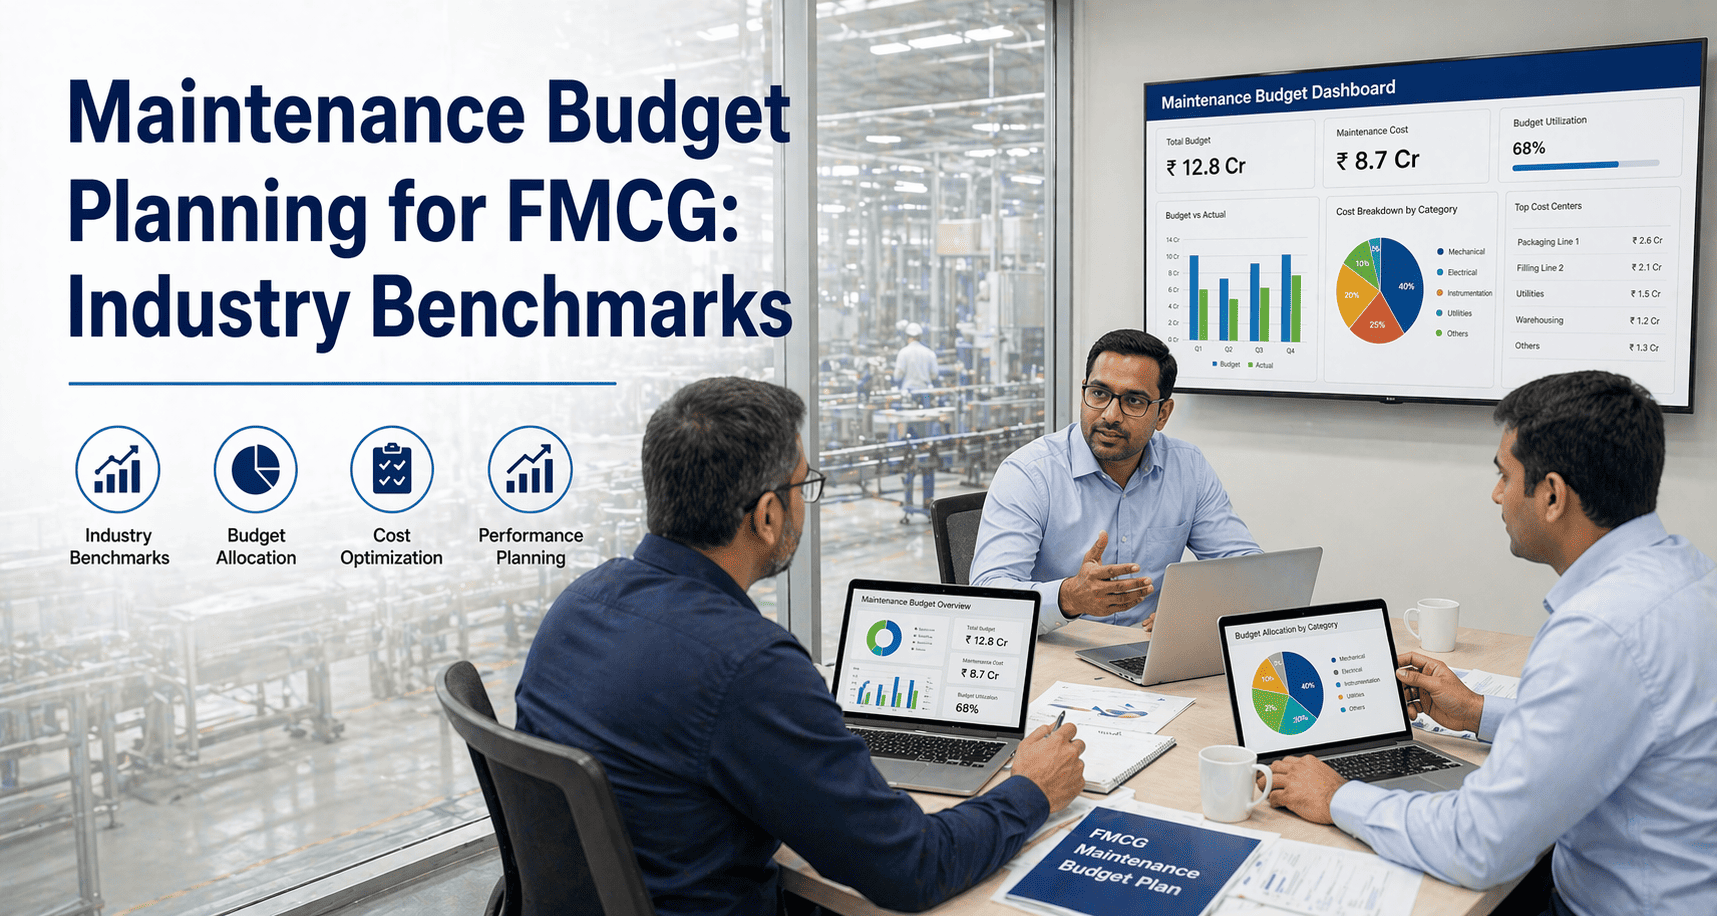
Maintenance budgets in FMCG plants are often built the same way every year: take last year's actual spend, add a percentage, and hope nothing breaks. That approach hides backlog, ignores asset age, and leaves the maintenance manager defending a number without a story. A better budget starts from the asset base, the work that must happen, and the risk the plant is willing to carry, then tests it against real cost history. This guide compares budgeting methods, shows which CMMS data to extract, explains the capex and opex split, and gives a structure for defending the number, with Oxmaint maintenance management software supplying the cost records behind it.
Build a maintenance budget you can explain line by line
Move from last year plus a percentage to a budget grounded in assets, work history, and risk, with the evidence ready for finance review.
Why last year plus a percentage keeps failing
Historical budgeting is simple, which is why it is popular. It also repeats last year's mistakes and hides what was never done.
Where the shortcut breaks
- Deferred maintenance is invisible because it never became spend
- One-off breakdown costs are carried forward as if they will recur
- Ageing equipment is treated the same as new equipment
- Production changes and new lines are not reflected
- Price changes for parts, contractors, and energy are guessed
- Cuts are applied evenly instead of by asset risk
What a stronger budget does
- Shows the cost of planned work and the backlog separately
- Normalizes one-off events before projecting forward
- Adjusts for asset age, condition, and expected failures
- Builds in new lines, shutdowns, and regulatory work
- Uses current quotes and contract rates
- Allocates money to the assets that matter most
Choosing a budgeting method
Most plants end up with a hybrid. Understand what each approach offers before deciding where to use it.
| Method | How it works | Strength | Weakness |
|---|---|---|---|
| Historical | Start from prior actuals and adjust for inflation or growth | Fast and easy to explain | Locks in past waste and past neglect |
| Zero-based | Justify every line from the work needed, starting at zero | Exposes unnecessary cost and real needs | Time-consuming and needs good data |
| Activity-based | Cost the planned tasks, labor hours, and parts per asset | Links money directly to work | Depends on accurate task and rate records |
| Risk-based hybrid | Zero-base critical assets, use history for low-risk ones | Focuses effort where it matters | Requires a trusted criticality ranking |
A pragmatic way to combine them
- Use zero-based thinking for critical lines such as filling, packing, and utilities
- Use history with adjustments for low-criticality buildings and general equipment
- Separate planned work, corrective work, and projects so each can be reviewed on its own
Which CMMS data to extract first
A good budget starts with a clean extract. Pull these views from your maintenance system before opening a spreadsheet.
Cost by asset and line
Labor, parts, and contractor cost for each asset, rolled up to line and area, so the top cost drivers are obvious.Planned versus reactive work
Hours and cost split between preventive, corrective, and emergency jobs, showing how much firefighting the plant carries.Repeat failures
Assets and failure codes that appear several times, which point to avoidable spend and candidates for redesign or replacement.Backlog
Open and deferred work orders with estimated hours and parts, representing cost the plant has postponed.Parts consumption
Usage, stock value, and emergency purchases, supporting both the parts budget and inventory decisions.Contractor and OEM spend
Call-outs, service contracts, and warranty recoveries by vendor, showing what is outsourced and why.Clean the data before trusting it
- Merge duplicate assets and standardize naming
- Check that labor hours were booked to the correct asset
- Flag one-off events such as a flood or a major rebuild
- Confirm that parts costs include the real purchase price, not placeholders
Building the budget from the bottom up
Stack the budget in layers. Each layer has a different basis and a different owner.
Walk into budget season with the data already in hand
Capture labor, parts, and contractor cost against every asset and work order, so each budget line has a record behind it.
Capex or opex: drawing the line consistently
Rules differ by company and country, so agree the policy with finance. What matters is applying it the same way every time.
| Work type | Usually treated as | Question to confirm with finance |
|---|---|---|
| Routine repairs and servicing | Operating expense | Does the work restore the asset without extending its life or capacity? |
| Like-for-like part replacement | Usually operating expense | Is the part small enough to fall below the capitalization threshold? |
| Major overhaul extending life | Often capital expenditure | Does it extend useful life or raise performance beyond the original? |
| Equipment replacement | Capital expenditure | What is the threshold and approval route? |
| Efficiency or capacity upgrades | Capital expenditure | Is there a business case with payback or compliance justification? |
| Contract service agreements | Operating expense | Are multi-year commitments disclosed in the plan? |
Avoid the common traps
- Do not hide recurring repairs in capital projects to protect the operating budget
- Do not defer replacement of a failing asset simply because capital approval is slow
- Record the repair-versus-replace logic so it can be reviewed later
Allocating money by asset risk, not by habit
Equal cuts and equal increases both ignore risk. Rank assets by consequence of failure and set service levels accordingly.
Band A: critical
Failure stops a line, affects food safety, or creates a safety hazard. Fund preventive and condition-based work fully and hold critical spares.Band B: important
Failure slows output or raises cost but has a workaround. Fund time-based preventive work and reasonable response times.Band C: supporting
Failure causes inconvenience only. Use run-to-failure or light inspection where safe and economical.Shifting the balance from reactive to planned work
The mix of planned and reactive work is one of the strongest predictors of cost and downtime. Budget for the shift you want to achieve.
Reactive-heavy budget
- Overtime and call-outs absorb a large share of labor cost
- Emergency parts are bought at premium prices
- Production loses output during unplanned stops
- Planners react to the day instead of preparing the week
Planned-heavy budget
- Labor is scheduled into available windows
- Parts are ordered ahead at normal prices
- Downtime is planned and shorter
- Preventive spend rises while emergency spend gradually falls
What to include in the transition plan
- An investment in preventive tasks and planner time in the first year
- A target for the planned work share that rises gradually
- A review of which failures keep repeating and the fix for each
- A realistic expectation that savings appear later than costs
Defending the budget in front of finance
Finance leaders respond to evidence, clarity, and trade-offs. Present the number as a set of decisions.
State the baseline
Show last year's actual cost by category, what was normalized, and why. Credibility starts with transparent numbers.Explain the drivers
List what changed: new lines, asset age, price rises, regulatory requirements, and backlog being cleared.Show the risk of cutting
For each proposed cut, state the likely consequence in downtime, safety, quality, or later cost.Prepare answers to the usual questions
- Why is the preventive share rising, and when will reactive spend fall?
- Which three assets drive the largest share of spend?
- What happens to output if the budget is reduced by a given amount?
- Which items can be deferred safely, and for how long?
Tracking variance through the year
A budget is useful only if it is reviewed. Monthly variance analysis catches drift while there is still time to act.
| Variance type | Typical cause | Response |
|---|---|---|
| Overspend on corrective work | An asset failing more often than forecast | Review root cause, consider rebuild or replacement |
| Underspend on preventive work | Tasks postponed or unplanned labor shortage | Reschedule and check for rising failures |
| Parts cost above plan | Emergency purchases or price increases | Review stock levels, supplier terms, and lead times |
| Contractor cost above plan | Skills gap or unplanned outsourcing | Assess training or a contract change |
| Project delay | Late approval, parts, or shutdown window | Reforecast and move spend between periods |
How Oxmaint supports each budgeting step
The budget is only as reliable as the cost history behind it. Oxmaint records work, labor, parts, and assets in one place.
| Budget step | Oxmaint capability | Result |
|---|---|---|
| Baseline cost by asset | Asset management with work order history | Spend linked to each asset and line |
| Planned work cost | Preventive maintenance schedules and task lists | Frequencies and labor hours available for costing |
| Reactive share | Corrective work orders with priority and cause | Clear view of firefighting and repeat failures |
| Parts budget | Inventory with usage and reorder points | Consumption data and stock value |
| Backlog estimate | Open work order tracking | Deferred work quantified for planning |
| Variance review | Dashboards and reports | Monthly cost and completion trends |
A budget calendar that avoids last-minute scrambles
Budget work takes weeks, not days. Work backward from the finance submission date and give each step an owner.
Ten to twelve weeks before
Extract and clean cost data, confirm the criticality ranking, and gather production plans, new lines, and shutdown dates.Six to eight weeks before
Cost planned work from task lists, request contractor and OEM quotes, and size the corrective allowance from normalized history.Three to four weeks before
Draft projects with business cases, agree capex and opex treatment with finance, and test the total against plant targets.Final two weeks
Prepare the narrative, rehearse the likely questions, and document what is excluded and the risk of exclusion.After approval
Phase the budget by month, load planned work into the schedule, and set variance thresholds for the monthly review.Mid-year checkpoint
Reforecast using actuals, move money between lines if justified, and adjust the second-half plan for what was learned.Items that are easy to forget in an FMCG plant budget
Some costs rarely appear in the first draft, then surprise everyone during the year. Check them deliberately.
Recurring but overlooked
- Statutory inspections of pressure systems, lifting equipment, and electrical installations
- Calibration of scales, metal detectors, sensors, and temperature probes
- Pest control and sanitation equipment maintenance
- Refrigerant leak checks and records
- Technician training and certification renewals
Variable and external
- Price rises for imported spares and currency effects
- Seasonal peaks that raise run hours and wear
- New product formats needing tooling and change parts
- Customer audit actions and corrective commitments
- End of warranty on recently installed lines
Mistakes that weaken a maintenance budget
| Mistake | Consequence | Better approach |
|---|---|---|
| Mixing planned and reactive spend in one line | Nobody can see whether the plant is improving | Report each work type separately |
| Ignoring backlog | Deferred work returns as failures | Estimate and show backlog cost explicitly |
| Cutting preventive work first | Breakdowns rise and cost more than the savings | Protect critical asset preventive work |
| No contingency rules | Reserve is spent on ordinary overruns | Define what qualifies as an emergency |
| Poor data quality | Finance challenges the numbers and trust drops | Clean and document the baseline |
Useful budget ratios to track, without chasing a universal target
Benchmarks differ widely by industry, asset age, and automation. Use ratios to compare your own plant over time and across similar lines.
- Maintenance cost divided by units produced, to show cost per output as volume changes
- Maintenance cost divided by asset replacement value, to compare lines of different size
- Share of labor hours spent on planned work compared with reactive work
- Emergency parts spend as a share of total parts spend
- Backlog hours divided by weekly available labor hours, which shows how many weeks of work are waiting
- Contractor spend as a share of total maintenance labor cost
How to use them well
- Define each ratio once and keep the definition fixed from year to year
- Look at the trend and the drivers, not a single snapshot
- Compare lines only when they run similar products and equipment
Budget planning checklist
Before drafting
- Clean asset and cost data extracted
- Critical assets ranked with production
- One-off events identified and normalized
- Capex and opex rules confirmed with finance
- Upcoming projects and shutdowns listed
Before submitting
- Each line has a basis and an owner
- Backlog and contingency shown separately
- Risk of reductions documented
- Monthly variance review scheduled
- Planned versus reactive target stated
Frequently asked questions
Is zero-based budgeting right for maintenance?
It works well for critical assets. Many plants use it there and apply adjusted history elsewhere.
What data do I need first?
Cost by asset, planned versus reactive work, repeat failures, backlog, and parts consumption from your maintenance records.
How do I decide between capex and opex?
Follow your company policy and capitalization threshold, and confirm borderline cases with finance before submission.
Where do I get reliable cost history?
From work orders that record labor and parts. You can capture them in Oxmaint.
Can I see cost reporting for a plant?
Yes. Book a demo to see cost by asset, backlog, and variance reporting.
Defend your 2026 maintenance budget with real cost data
Track every work order, part, and asset cost in one platform, so budget conversations start from facts instead of estimates.

.png)