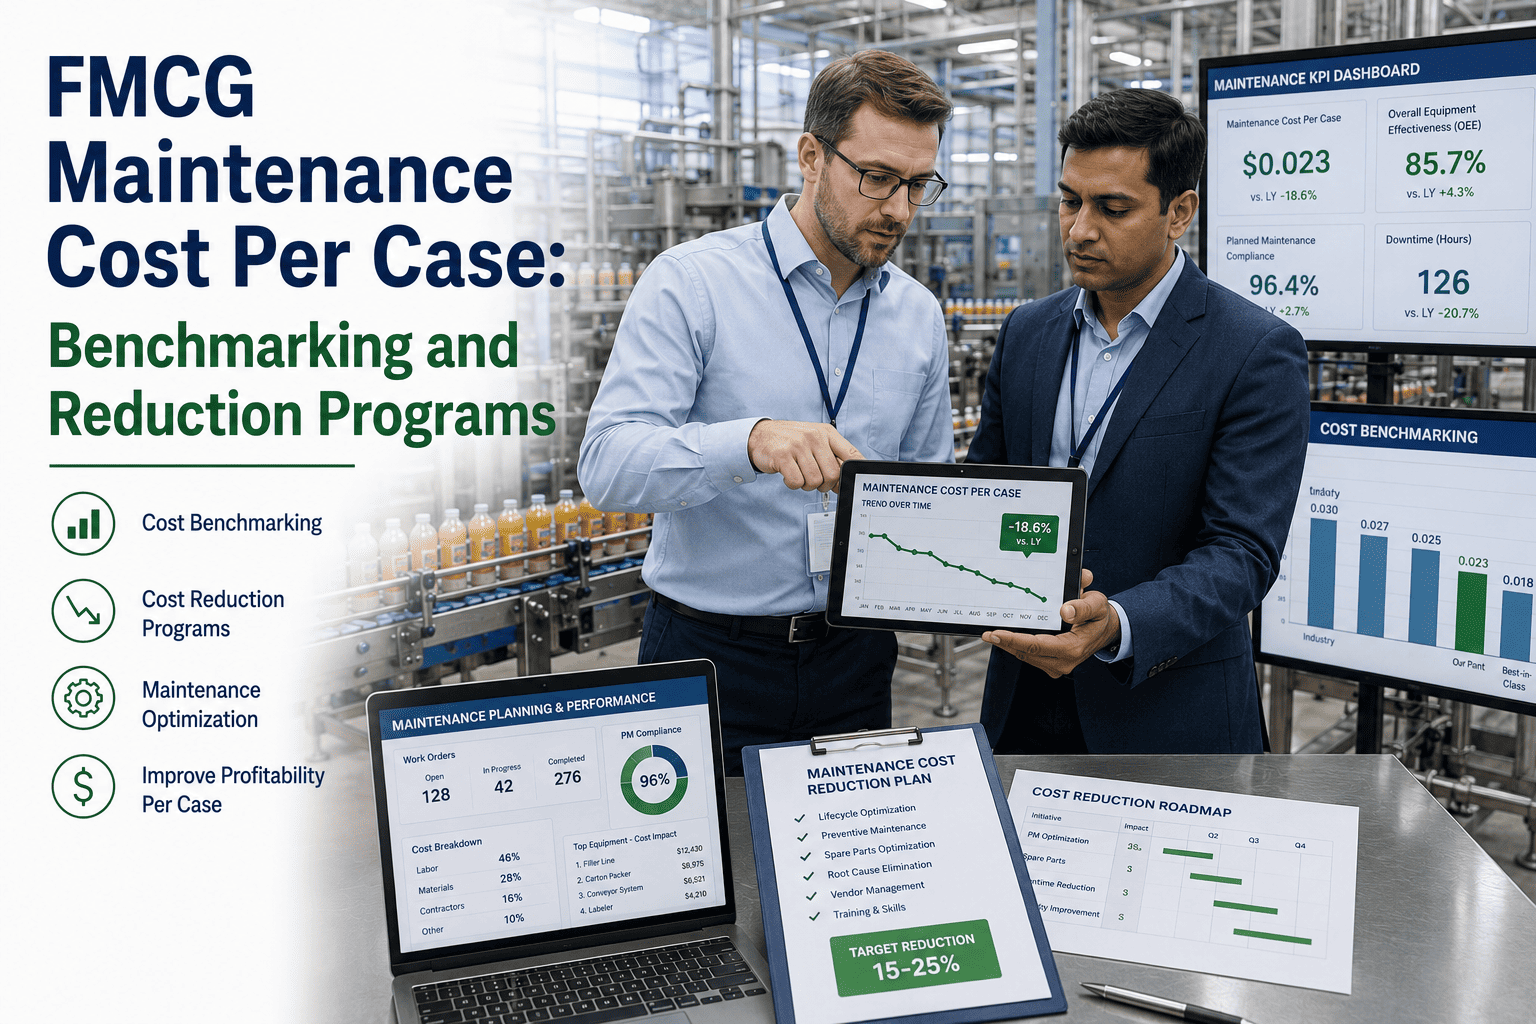
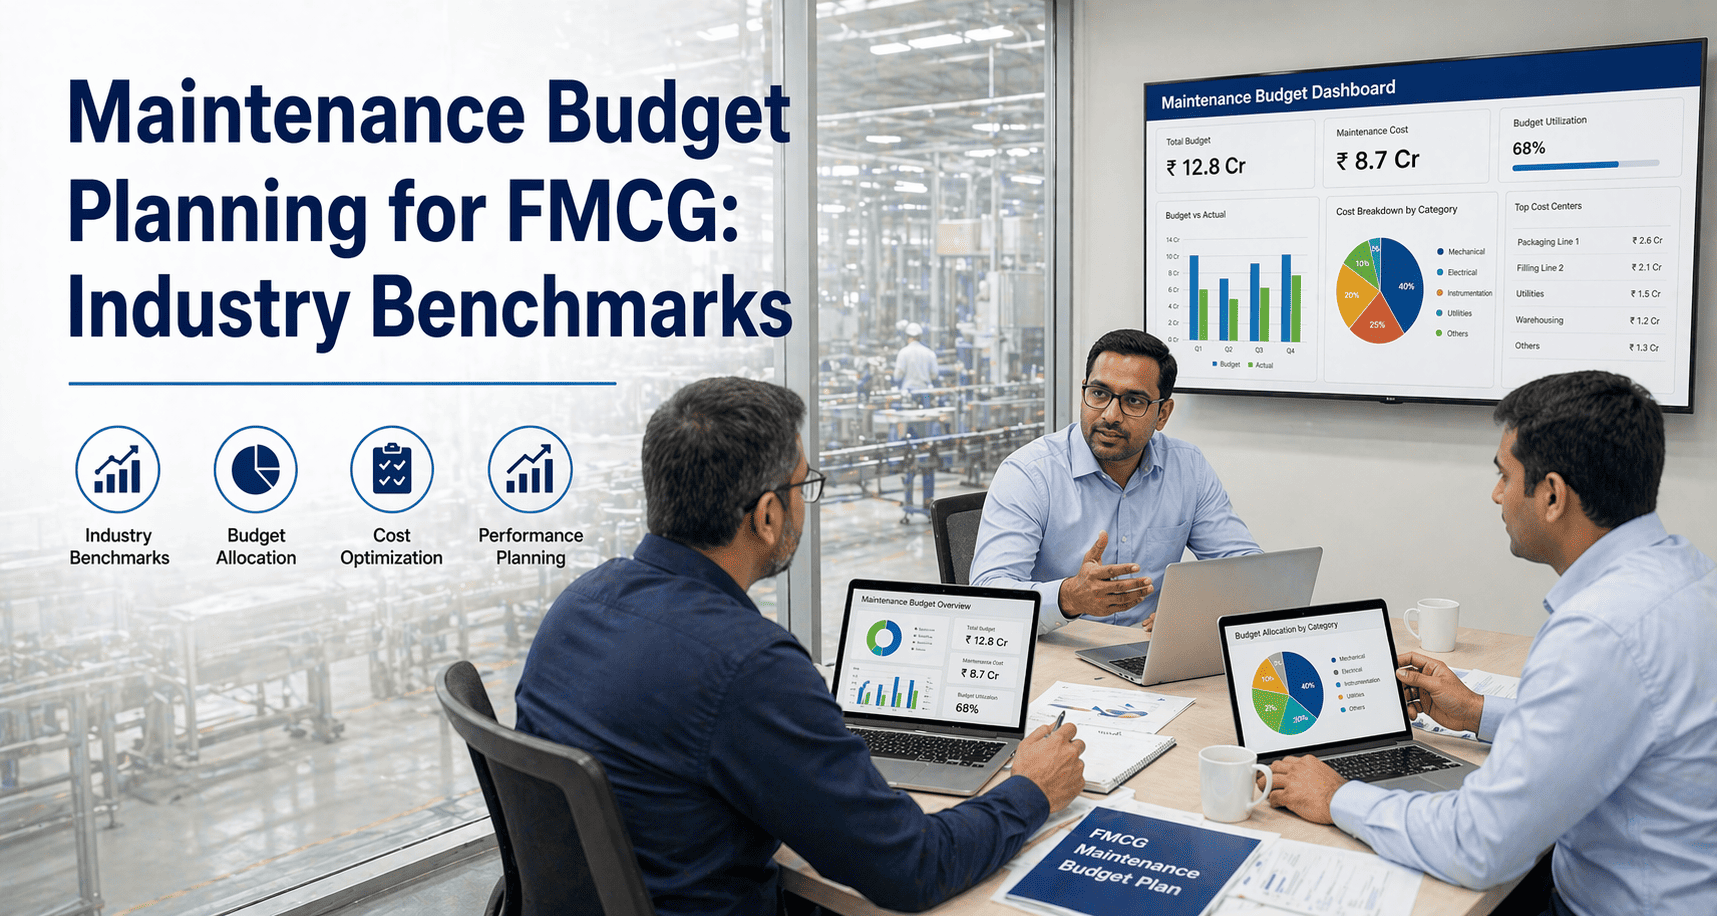
Your CFO does not care about Mean Time Between Failures. They care about one number the maintenance cost per case of finished product shipped. It is the only maintenance KPI that translates cleanly into gross margin, and it is the number every FMCG board member benchmarks against industry peers. Best-in-class beverage operations run at $0.008 to $0.015 per case in maintenance cost. Underperforming plants run 2-3x higher and never know it because nobody is tracking the right number. The good news is that cost per case is also the most actionable maintenance KPI you can manage with structured CMMS data and a 12-month reduction program, 20-30% cuts are routine. See how OxMaint's cost-per-case dashboards expose hidden waste across multi-site portfolios start a free trial or book a demo with our team.
FMCG Cost Per Case · CFO-Grade Benchmarking · 20-30% Reduction
FMCG Maintenance Cost Per Case: Benchmarking and Reduction Programs
Cost per case is the only maintenance KPI your CFO measures. See the benchmark ranges by sub-vertical, the seven cost levers that move the number, and the structured 12-month program that cuts it 20-30% without compromising compliance.
Cost Per Case Benchmarks
Best-in-class
$0.008-0.015
Industry median
$0.025-0.040
20-30%
Typical cost per case reduction in 12 months
4.8x
Cost of reactive repair vs planned intervention
15-20%
Of cost per case is contractor and emergency spend
$2-5M
Annual savings on a 200M case beverage operation
Understanding the Metric
What Is Maintenance Cost Per Case in FMCG?
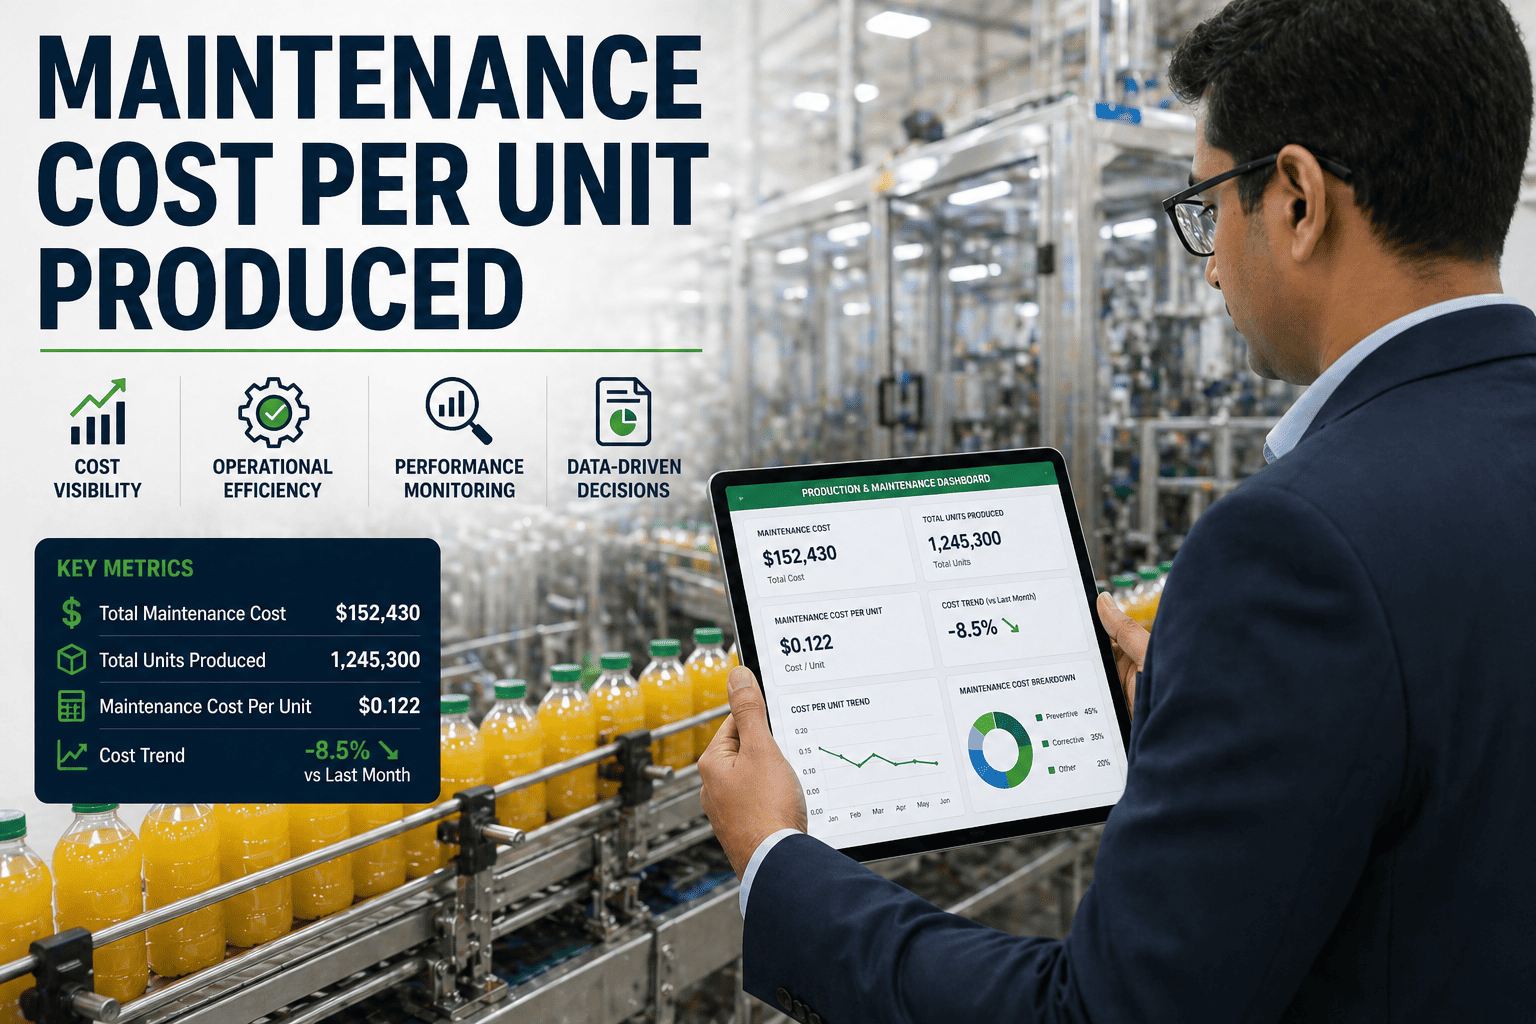
Maintenance cost per case is the total maintenance spend internal labor, contractor labor, spare parts, MRO consumables, and allocated overhead divided by the total cases of finished product shipped over the same period. It is the rare maintenance metric that scales directly with revenue and gross margin, which is why it appears on FMCG board decks alongside revenue per case and EBITDA per case.
The number reveals what other maintenance KPIs hide. A plant can show 95% PM compliance and 99% OEE and still run a $0.04 cost per case if it is bleeding money on contractor premiums and emergency airfreight for parts. Cost per case captures all of that in a single comparable number that lets a portfolio operator rank every plant against every other plant with no excuses. Start a free trial to see how OxMaint calculates and tracks cost per case automatically, or book a demo for a walkthrough.
Benchmarks by Sub-Vertical
FMCG Cost Per Case Benchmarks: Where Does Your Plant Sit?
Cost per case ranges vary significantly by sub-vertical because line speeds, asset complexity, and changeover frequency differ. Use these benchmarks as a directional anchor the goal is not to match the average, it is to move toward best-in-class within your specific category.
Beverage
$0.008 - $0.025 / case
Highest line speeds in FMCG (60,000+ cans/hour). Best-in-class plants run lean fillers, predictive seamer maintenance, and tight spare parts discipline.
Best-in-class: $0.008-0.012
Dairy
$0.020 - $0.045 / case
CIP-heavy environment drives elevated maintenance load. Pasteurizer, separator, and homogenizer reliability are the dominant cost drivers.
Best-in-class: $0.020-0.026
Frozen Foods
$0.030 - $0.060 / case
Refrigeration system reliability and IQF tunnel uptime dominate. Cold-environment lubrication and corrosion control elevate parts costs.
Best-in-class: $0.030-0.038
Bakery
$0.025 - $0.055 / case
Oven and proofer reliability plus dough-handling system uptime. High changeover frequency in private label operations drives elevated labor cost.
Best-in-class: $0.025-0.032
Personal Care
$0.040 - $0.085 / case
Highest SKU complexity in FMCG. Multi-format fillers, frequent changeovers, and tight tolerances push parts and labor cost per case higher.
Best-in-class: $0.040-0.052
Confectionery
$0.035 - $0.070 / case
Coating, enrobing, and depositing equipment require frequent intervention. Temperature-control system reliability is the dominant cost lever.
Best-in-class: $0.035-0.045
The Seven Levers
Seven Levers That Move Maintenance Cost Per Case
Most plants do not have a cost per case problem they have seven different smaller problems that compound. A structured reduction program isolates each lever, sets a 90-day target, and measures the cost-per-case delta. Most plants find that levers 1-3 alone deliver 60-70% of the achievable savings. Plants that systematically work through these levers see start a free trial or book a demo to see the lever framework on your specific operation.
01
Reactive-to-Planned Ratio
Every percentage point shifted from reactive to planned maintenance saves 3.8x on the cost of the underlying work. Target: 80%+ planned within 12 months.
02
Contractor Premium Spend
Emergency contractor rates run 2-4x internal labor. Reducing contractor reliance through better internal capability cuts 15-20% from cost per case in many plants.
03
Spare Parts Inventory Discipline
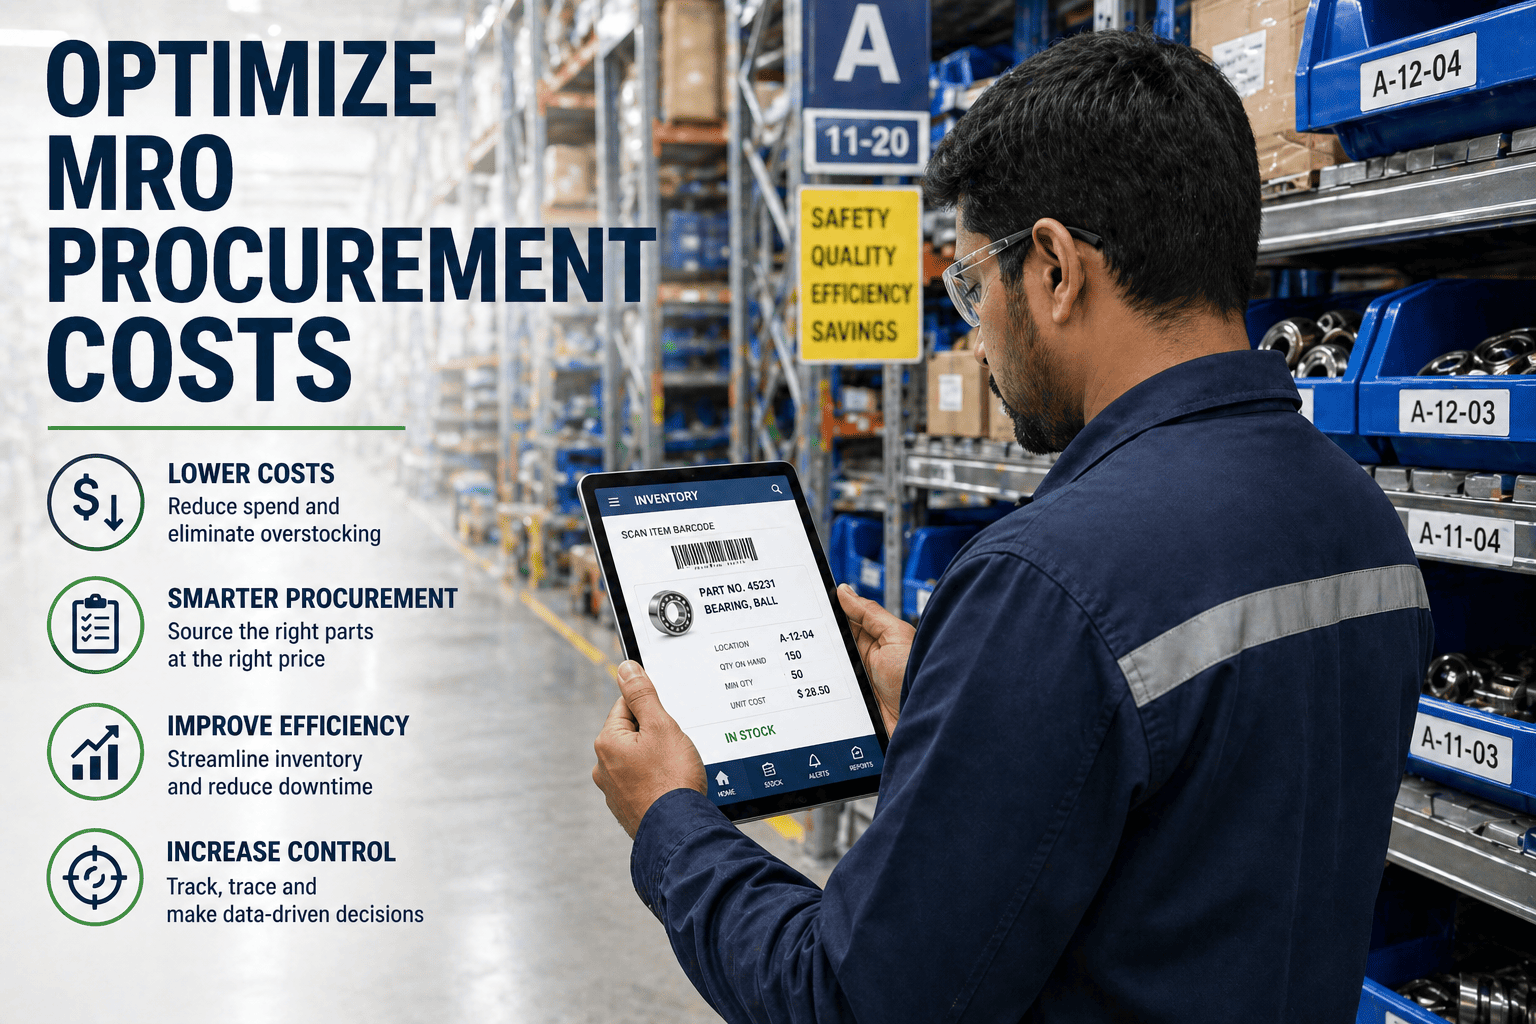
Carrying excess spares ties up working capital and inflates allocated overhead. Right-sizing spares to actual consumption rates cuts carrying cost meaningfully.
04
Airfreight and Emergency Logistics
When a plant runs out of a critical part, airfreight from Germany or Italy is the only option. Better demand forecasting eliminates 80%+ of these events.
05
PM Effectiveness, Not Just Compliance
PM compliance can be 100% while PM effectiveness is 40%. Right-sizing PM frequency and content based on actual failure data eliminates wasted labor.
06
Energy and Utility Coupling
Compressed air, steam, and water leaks show up in utility bills, not maintenance bills but their fix is a maintenance task. Coupling these drives shared accountability.
12-Month Program Structure
How OxMaint Drives 20-30% Cost Per Case Reduction in 12 Months
OxMaint provides the data backbone for structured cost-per-case reduction. The platform calculates cost per case automatically from work order labor, parts issue, and contractor invoices with production volume pulled directly from ERP integration. Plant managers see cost per case trends weekly; portfolio managers see cross-site rankings monthly. Start a free trial or book a demo to see the dashboards live.
Phase 1 · Months 1-3
Baseline and Diagnose
Establish cost per case baseline by line, by asset, by failure category. Identify the top 10 cost drivers. Typical finding: 60% of cost per case comes from 8-12 assets.
Phase 2 · Months 4-6
Reactive Conversion
Move the highest-cost reactive failure modes into planned PMs. Implement condition-based monitoring on top 5 assets. Track reactive-to-planned ratio weekly.
Phase 3 · Months 7-9
Spares and Contractor Optimization
Right-size spare parts inventory using 12 months of consumption data. Renegotiate top 5 contractor agreements based on actual usage patterns and SLA performance.
Phase 4 · Months 10-12
PM Right-Sizing and Sustainment
Audit every PM for effectiveness. Eliminate PMs with no failure-prevention value. Extend intervals where condition data supports it. Lock gains into CMMS workflows.
Before vs After Comparison
FMCG Plant Cost Per Case: Before and After Structured Program
| Cost Component | Before (Reactive) | After 12 Months | Reduction |
| Cost per case (blended) |
$0.042 |
$0.029 |
-31% |
| Reactive labor hours |
58% |
22% |
-36 pts |
| Planned PM hours |
42% |
78% |
+36 pts |
| Contractor spend |
$2.1M annual |
$1.3M annual |
-38% |
| Airfreight emergency parts |
$340K annual |
$55K annual |
-84% |
| Spare parts inventory value |
$4.8M held |
$3.2M held |
-33% |
| MTTR (top 10 assets) |
4.2 hours |
2.1 hours |
-50% |
| Unplanned downtime hours |
1,840/year |
1,100/year |
-40% |
ROI and Outcomes
What Cost Per Case Reduction Delivers in Hard Dollars
$2-5M
Annual Savings on 200M Cases
A 20-30% reduction in cost per case on a typical 200M case beverage operation delivers $2-5M in direct annual maintenance savings before counting OEE gains.
3-5 pts
Gross Margin Improvement
In thin-margin sub-verticals like dairy and bakery, maintenance cost-per-case reduction translates directly into 3-5 percentage points of gross margin expansion.
38%
Reduction in Contractor Spend
Structured programs cut contractor and emergency labor spend by 30-40% by building internal capability and reducing reactive failures that require premium-rate response.
84%
Reduction in Emergency Airfreight
Better spare parts forecasting and condition-based PMs eliminate the vast majority of emergency airfreight events that quietly inflate cost per case month after month.
Frequently Asked Questions
FMCG Maintenance Cost Per Case Common Questions
What costs should be included in maintenance cost per case?
Internal maintenance labor (including overtime), contractor labor, spare parts and MRO consumables, allocated maintenance overhead (supervisor time, training, tools), and energy waste tied to maintenance issues. Do not include capex, lubricants for production use, or general utilities. Consistency over time matters more than exact category boundaries.
Book a demo to see the OxMaint cost-per-case formula.How quickly can a plant see cost per case improvement?
Early-stage wins from reducing emergency airfreight and contractor premiums show up in the first 60-90 days. Structural wins from PM right-sizing and reactive-to-planned conversion show up in months 4-9. The full 20-30% reduction is typically realized by month 12.
Start a free trial to baseline your own cost per case today.Can OxMaint calculate cost per case across multiple plants automatically?
Yes. OxMaint pulls work order labor and parts data from CMMS, contractor invoices from AP, and case production volumes from ERP then calculates cost per case by plant, by line, by asset class. Portfolio dashboards rank every plant on a single comparable number, exposing outliers fast.
Is best-in-class cost per case achievable at every plant?
Within a sub-vertical, yes the variation between plants in the same sub-vertical is almost entirely driven by maintenance practices, not asset age. Plants with 30-year-old assets that have been disciplined about PMs and condition monitoring routinely outperform plants with newer assets and weaker practices.
Cost Per Case Reduction · CFO-Grade Metric · Free to Start
Cut $2-5M From Your Annual Maintenance Spend Without Touching CapEx
Cost per case is the one KPI your CFO cares about and it is the one maintenance metric where 20-30% improvement in 12 months is routine. OxMaint provides the cost-per-case dashboards, the reactive-to-planned conversion workflows, and the spare parts intelligence that makes the reduction happen. Live in days, not months. No heavy implementation.