Steam is the most expensive utility nobody audits. A typical FMCG plant operates 200-800 steam traps and industry surveys consistently show that 15-30% of them are failed open, blowing live steam straight to atmosphere or condensate return 24 hours a day. At current natural gas prices, a single failed 1/2-inch trap on a 100 PSI line wastes $4,000-8,000 per year, and most plants have dozens. Add uninsulated piping, valves, and fittings each foot of bare 4-inch steam line losing 350-500 BTU/hour and the typical FMCG facility quietly burns $500K-1.2M annually in steam losses that never appear on any maintenance KPI. To see how OxMaint turns steam trap surveys into structured PM workflows that actually get completed start a free trial or book a demo with our team.
Steam Trap Survey · Insulation Audit · Condensate Return
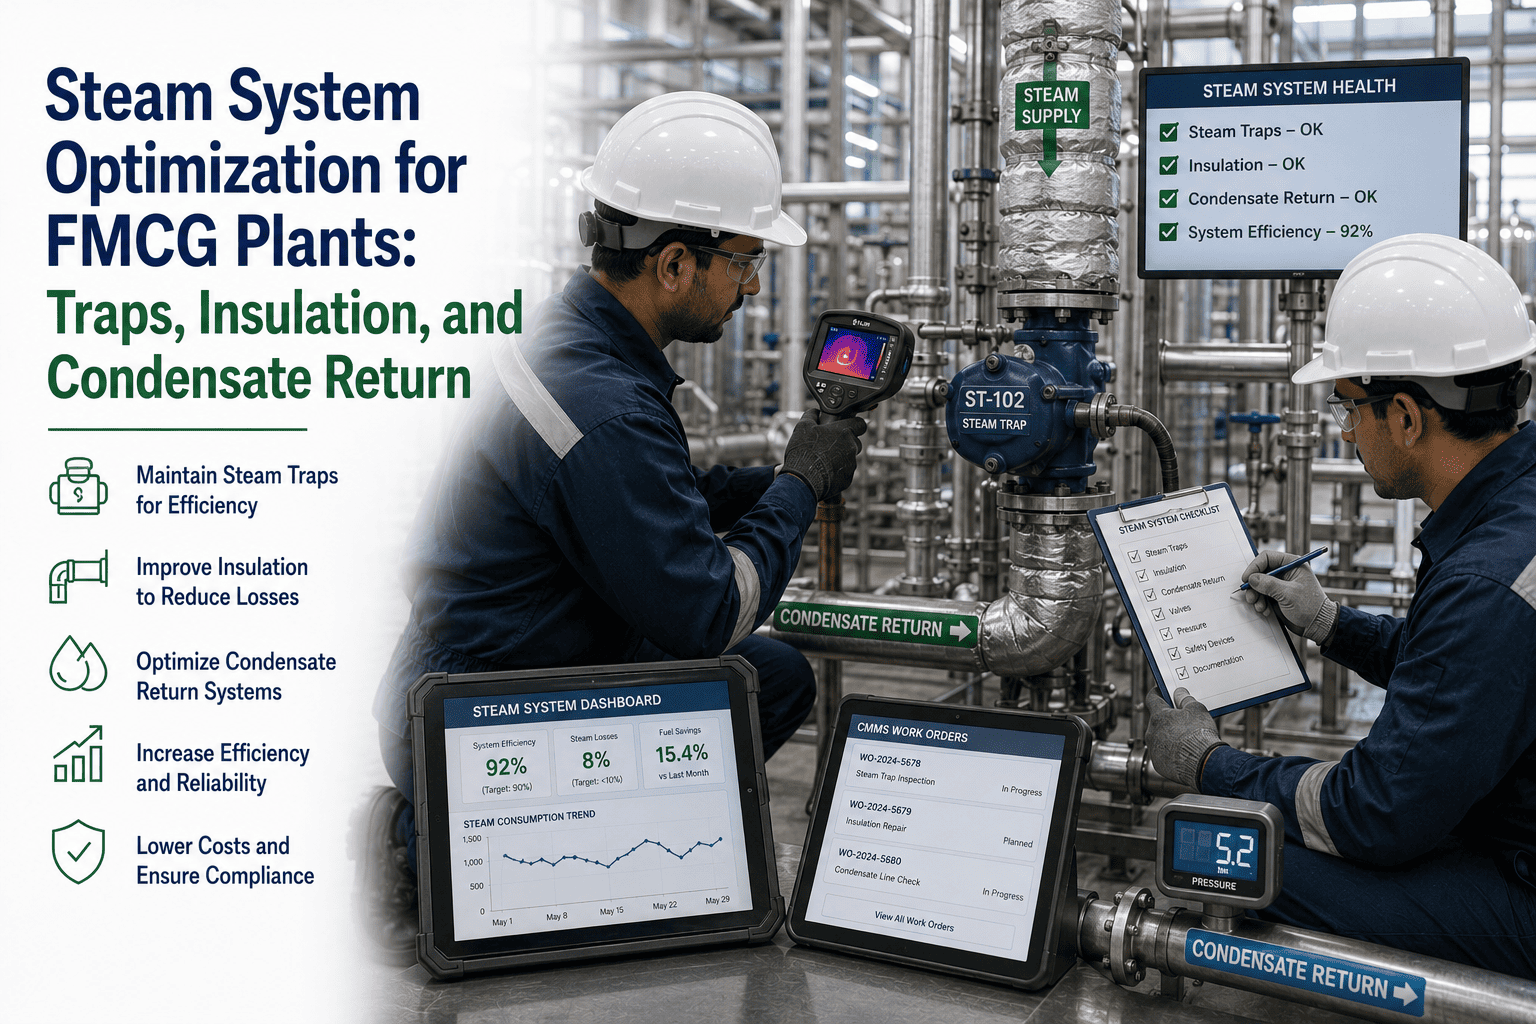
Steam System Optimization for FMCG Plants: Traps, Insulation, and Condensate Return
Failed steam traps and missing insulation quietly burn $500K-1.2M annually at a typical FMCG plant. See the survey, repair, and condensate return program that closes the leak permanently and creates auditable energy reduction evidence.
Steam Trap Population Status
Operating correctly
70-80%
Blow-through (failed)
15-22%
15-30%
Of steam traps failed in unaudited FMCG plants
$4-8K
Annual loss per failed 1/2-inch trap at 100 PSI
$500K+
Annual steam waste at a typical mid-size plant
3-6 mo
Typical program payback period
Understanding the Loss
What Is a Steam Trap Survey and Why Does Every FMCG Plant Need One?
A steam trap is an automatic valve that releases condensate (and air) from a steam line while preventing live steam from escaping. Every steam-using asset in an FMCG plant pasteurizers, jacketed kettles, retorts, dryers, CIP heaters, autoclaves has at least one trap, and large plants run hundreds. When a trap fails open, live steam blows straight through 24 hours a day. When it fails closed, condensate floods the line, hammering pipes and starving the process. Both failure modes are expensive, but blow-through is the more common and more costly mode in production environments.
Steam trap surveys use ultrasonic detection, surface temperature measurement, and visual inspection to classify each trap as operating, blow-through, leaking, or cold/plugged. Industry data consistently shows 15-30% of traps fail in plants without an active management program and the failure rate climbs to 40%+ in plants that have not surveyed in three years or more. A structured annual survey combined with CMMS-tracked repair workflow eliminates 90%+ of the loss. Start a free trial or book a demo to see the trap survey workflow inside OxMaint.
The Three-Lever Steam Program
Six Components of an FMCG Steam System Optimization Program
A complete program addresses three loss categories: traps (the largest single source), insulation (the most overlooked), and condensate return (the hidden compounder). Each lever stands alone but the combined program delivers the largest captured savings. Plants that work all three see total steam cost reduction of 20-35% within the first 18 months.
Component 01
Annual Steam Trap Survey
Ultrasonic and infrared inspection of every trap in the plant. Each trap tagged, classified, and recorded in CMMS with location, type, and last-survey date.
Component 02
Tagged Repair Work Orders
Each failed trap becomes a priority-ranked work order with annual dollar loss. Repairs scheduled by financial impact, not by location convenience.
Component 03
Insulation Audit
Thermal imaging survey of all steam piping, valves, and fittings. Missing or damaged insulation tagged with linear feet at risk and BTU/hour loss.
Component 04
Valve and Fitting Jackets
Removable insulation jackets for valves, flanges, and fittings that get pulled for maintenance. A bare 6-inch globe valve loses 1,500+ BTU/hour year-round.
Component 05
Condensate Return Optimization
Every gallon of condensate returned saves boiler makeup water, chemical treatment, and heating energy worth $1.50-2.50 per kgal returned vs lost.
Component 06
Boiler Combustion Tuning
Annual combustion analysis maintains 80-85% boiler efficiency. A 2-point efficiency drop on a 500-HP boiler adds $30K-50K annual fuel cost.
Industry Pain Points
Why Most FMCG Steam Programs Quietly Bleed Money
Most FMCG plants have done at least one steam trap survey. Few have sustained the savings beyond 18 months. The failure pattern is consistent across every sub-vertical. If your plant has had a survey that did not stick, start a free trial to see the CMMS-routed sustainment workflow, or book a demo.
01
Survey Report Sits in a Drawer
External surveyor delivers a PDF. It is filed in a shared drive. 40-60% of identified failed traps are never actually replaced. Savings on paper only.
02
No Trap Inventory in CMMS
Without a structured trap register with location, type, size, and history, the next survey has to rebuild the map. Repair tracking becomes impossible.
03
Insulation Never Replaced After Maintenance
Insulation gets cut off for valve repairs, then never replaced. Year after year, bare metal multiplies. Thermal losses become permanent.
04
Condensate Dumped, Not Returned
Plants with broken condensate return systems dump 200-500F water to drain. Boilers consume makeup water and reheat it from ambient doubling the energy loss.
05
Surveys Cover Only Easy Traps
Traps behind machinery, on rooftops, or in confined spaces get skipped. The hidden 20% of the trap population accounts for 40%+ of the failures.
06
No Verification of Replacement Quality
Replaced traps fail again within months because the wrong type was installed. Without trap-specification discipline, the survey becomes an annual repeat.
How Oxmaint Solves It
How OxMaint Turns Steam Trap Surveys Into Sustained Savings
OxMaint provides the structured trap register, the priority-ranked repair queue, and the sustainment PMs that make a steam program survive past the first 12 months. Every trap is tagged with location, type, size, last-survey result, and annual loss exposure. Plant managers see total dollar exposure on a single dashboard. Start a free trial or book a demo to see the workflow.
Trap Register
Structured Trap Inventory
Every trap registered with location, type, size, install date, last survey result, and annual dollar exposure. Mobile QR scan brings up full history at the trap location.
Survey Workflow
Mobile Survey Capture
Technician scans trap QR, enters ultrasonic and temperature readings, classifies status. OxMaint auto-creates work order if failed. No clipboard, no spreadsheet.
Prioritization
Dollar-Ranked Repair Queue
Failed traps sort by annual dollar loss descending. The $8,000/year blow-through trap gets scheduled before the $400/year leaker capturing 80% of savings in first 30 days.
Insulation Tracking
Bare-Metal Inventory
Missing insulation tagged by location with linear feet and BTU/hour loss. PMs trigger insulation restoration after every valve repair so bare metal does not accumulate.
Condensate
Return System Reliability
Condensate return pump and tank PMs prevent the failures that cause condensate dumping. Return rate tracked as a KPI, with alerts when return % drops below target.
ISO 50001
Audit-Ready Energy Evidence
Every trap repair, insulation restoration, and condensate event logged with before-and-after savings. The auditable evidence ISO 50001 and CSRD reporting both require.
Before vs After Optimization
Unmanaged Steam vs OxMaint-Tracked Steam: Side-by-Side
| Steam System Parameter | Unmanaged Baseline | OxMaint Optimized |
| Trap failure rate |
15-30% |
2-5% sustained |
| Trap inventory in CMMS |
None or partial |
Complete, QR-tagged |
| Repair completion rate |
40-60% within 12 months |
90%+ within 90 days |
| Insulation coverage |
70-85% of piping |
95%+ with jackets on fittings |
| Condensate return rate |
50-65% returned |
85-92% returned |
| Boiler combustion efficiency |
74-78% |
82-85% |
| Annual steam waste |
$500K-1.2M |
$50K-180K residual |
| ISO 50001 audit evidence |
None |
Per-trap, per-event chain |
ROI and Captured Savings
What FMCG Steam Programs Actually Deliver
$500K+
Annual Steam Cost Avoidance
Mid-size FMCG plants with active trap surveys plus insulation and condensate programs capture $500K-1.2M annually in eliminated steam losses within the first 12 months.
3-6 mo
Typical Program Payback
From initial survey to first repair completion to verified savings, structured steam programs pay back their entire program cost including survey labor in 3-6 months.
85-92%
Condensate Return Rate
Plants with structured condensate return programs sustain 85-92% return rates vs the 50-65% typical in unmanaged systems cutting boiler makeup water and energy substantially.
2-5%
Sustained Trap Failure Rate
Continuous CMMS-tracked surveys drive sustained trap failure rates below 5% versus the 15-30% baseline. The structural difference between one-time savings and permanent ones.
Frequently Asked Questions
FMCG Steam System Optimization Common Questions
How often should an FMCG plant survey its steam traps?
Annually at minimum, with quarterly spot checks on the highest-pressure and highest-volume traps. Annual-only programs see failure rates climb back to 15%+ within 18-24 months. Quarterly cadence on critical traps sustains the gains.
Book a demo to see the survey PM templates.What equipment is needed to run trap surveys in-house?
An ultrasonic trap tester ($1.5K-4K) and an infrared thermometer or thermal imaging camera ($500-3K) are sufficient for in-house surveys at small-to-mid plants. Large plants benefit from ultrasonic cameras that visualize blow-through directly. OxMaint integrates with all major test equipment data.
Start a free trial to see the integration.How much does missing insulation actually cost annually?
A single bare 6-inch globe valve on a 150 PSI steam line loses approximately 1,500 BTU/hour year-round about $450-600 per year at typical natural gas prices. A bare 4-inch pipe loses 350-500 BTU/hour per linear foot. Across hundreds of linear feet and dozens of fittings, the cost compounds into six figures fast.
Why does condensate return matter so much for steam economics?
Returned condensate is hot (180-200F) and chemically treated. Lost condensate becomes drain water that must be replaced with cold, untreated makeup water doubling the boiler energy required to reheat it and adding chemical treatment cost. Every percentage point of return rate is worth $20K-40K annually at mid-size FMCG plants.
Steam Optimization · Trap Surveys · Condensate Return · Free to Start
Stop Burning $500K+ in Steam Every Year for No Operational Benefit
Failed steam traps, missing insulation, and broken condensate return systems are the most expensive maintenance failures nobody talks about. OxMaint gives you the structured trap register, the dollar-ranked repair workflow, and the sustainment PMs that turn one-time surveys into permanent savings. Live in days, not months. Audit-ready evidence from day one.