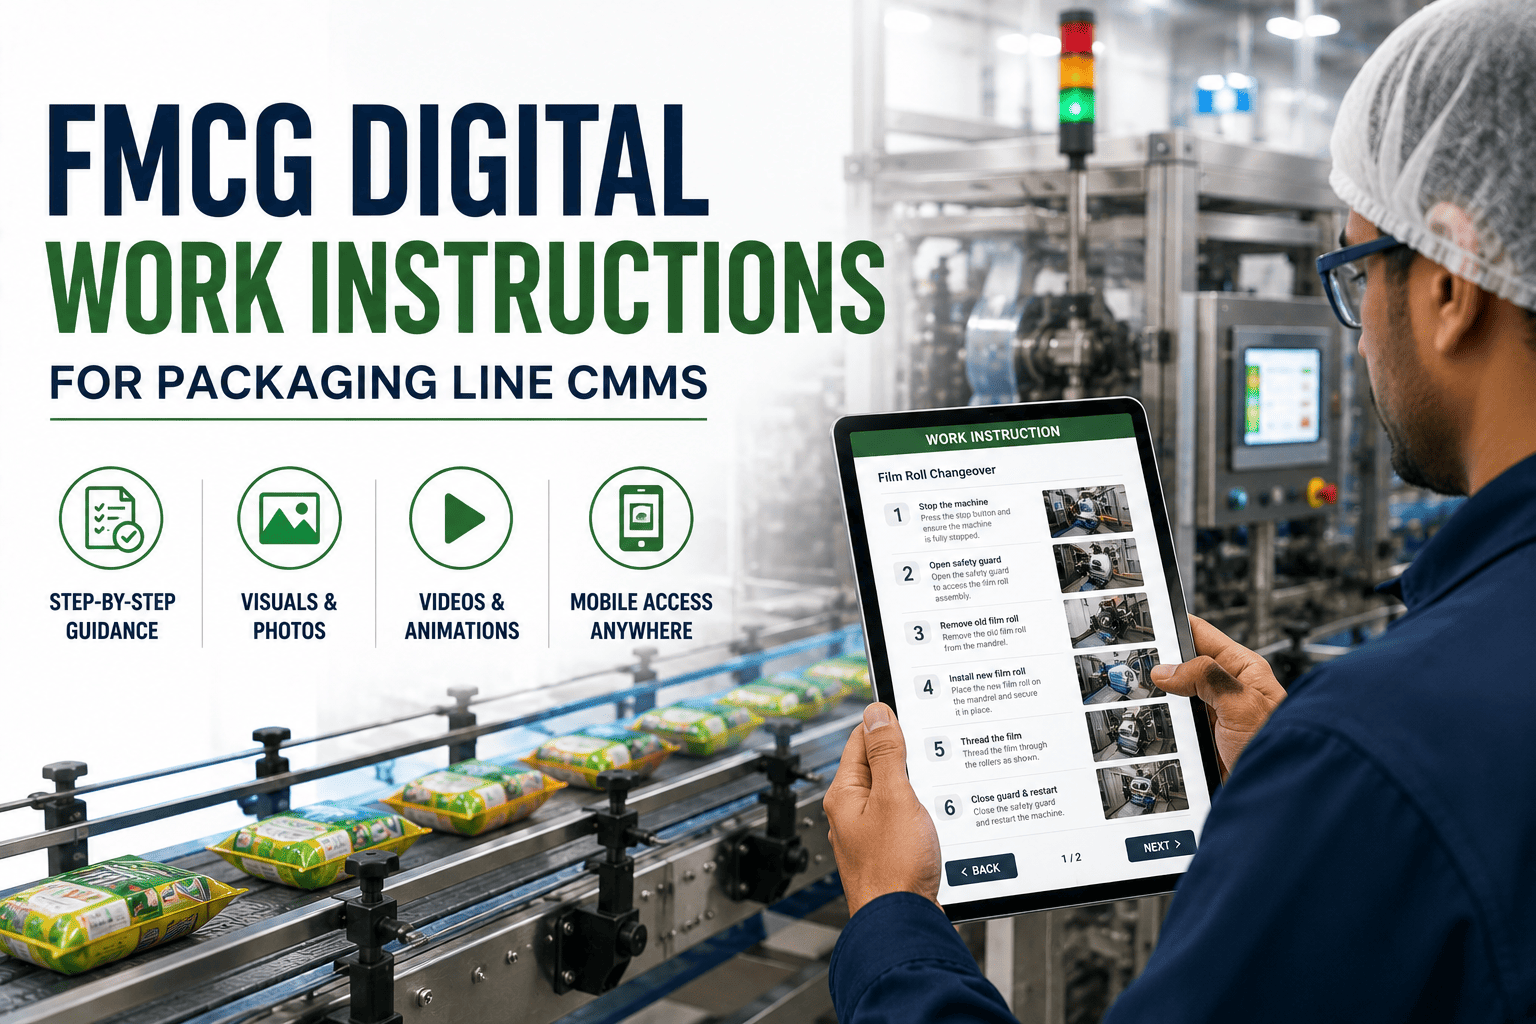
On a packaging line, the failures that hurt most are not always the loudest ones. A drifting sealing jaw or a reject gate that quietly stops diverting can run for hours before anyone notices, while a conveyor jam is fixed in minutes. Failure mode and effects analysis (FMEA) gives maintenance and quality teams a structured way to list what can fail, score how serious it is and decide where effort belongs. This guide shows how to run an FMEA for FMCG fillers, sealers, labelers and conveyors, and how a CMMS like Oxmaint can convert the highest-risk findings into scheduled PM tasks and inspections.
FMEA for FMCG Packaging Lines: Failure Mode Analysis That Drives Maintenance
Identify failure modes on fillers, sealers and conveyors, score risk consistently, and turn the results into maintenance tasks your team actually performs.
Why FMCG Lines Need Structured Failure Analysis
High speeds, short runs and frequent changeovers mean small deviations multiply quickly. Teams that rely on memory and fire-fighting tend to fix the same issues repeatedly.
Quality Escapes
Weak seals, short fills and misplaced labels may be found by customers, not by the line.
Minor Stoppage Loss
Short stops rarely appear in repair history, yet they erode OEE every shift.
Unequal Attention
Maintenance effort follows the last breakdown instead of the greatest risk.
Detection Gaps
Protective devices are assumed to work, but they are not always tested.
The FMEA Workflow on a Packaging Line
A line FMEA works best when each step has a clear output. Follow this sequence and keep the team small and cross-functional.
- 1Define the scope. Choose a line or machine and break it into subsystems, such as the dosing unit, nozzle, jaws, drive and sensors.
- 2List functions. State what each subsystem must do, with a measurable standard like fill tolerance or seal width.
- 3Identify failure modes. Describe how each function can be lost, using operator and technician experience.
- 4Describe effects and causes. Capture what the line, product and consumer experience, and what triggers it.
- 5Score and rank. Rate severity, occurrence and detection against an agreed scale.
- 6Act and re-score. Assign actions, complete them and verify that risk has dropped.
Building a Scoring Scale for Your Plant
Scores are only useful if everyone interprets them the same way. Anchor each band to real FMCG consequences and agree on them before scoring starts.
| Score band | Severity example | Occurrence example | Detection example |
|---|---|---|---|
| 1 to 3 | Minor slowdown, no product affected | Rare, not seen in the last year | Alarm or sensor catches it immediately |
| 4 to 6 | Rework, rejects or a longer stop | Occurs several times a year | Found by scheduled inspection or operator rounds |
| 7 to 8 | Batch hold, customer complaint risk | Occurs monthly or with each changeover | Found only by downstream checks |
| 9 to 10 | Food safety, regulatory or injury risk | Occurs repeatedly or is expected | No reliable means of detection |
Use your own failure history, OEE loss data and complaint records to set occurrence, rather than guessing.
Illustrative Worked Example: Ranking Packaging Failure Modes
The scores below are examples to show the method. Your team should score against your own equipment, products and history.
| Failure mode | Effect | S | O | D | RPN |
|---|---|---|---|---|---|
| Reject gate actuator seized | Nonconforming product passes | 9 | 3 | 8 | 216 |
| Flow meter drift on filler | Fill offset, declared volume risk | 7 | 4 | 7 | 196 |
| Sealing jaw temperature drift | Weak or burnt seals | 8 | 4 | 6 | 192 |
| Filler nozzle valve sticking | Drip, contamination, stoppage | 6 | 6 | 4 | 144 |
| Labeler sensor contamination | Skipped or skewed labels | 4 | 7 | 3 | 84 |
| Conveyor guide misalignment | Jams and product falls | 5 | 6 | 2 | 60 |
Reading Risk Beyond the RPN
A single multiplied number can hide important differences. A severity of 9 with low occurrence can score lower than a frequent nuisance, yet it deserves more attention.
- Review severity first. Any food safety or injury effect needs action regardless of the product score.
- Consider Action Priority. The AIAG-VDA FMEA handbook replaced RPN thresholds with Action Priority tables to address this weakness.
- Check detection honestly. A control that is never tested should not earn a low detection score.
Turn Your FMEA Into Tasks Instead of a Spreadsheet
A ranked list helps only if actions reach technicians. See how Oxmaint links failure modes to PM schedules, inspections and work orders.
Selecting Maintenance Actions for High-Risk Modes
Each high-priority mode needs an action that reduces occurrence, improves detection or lessens the effect. Maintenance tasks mainly address the first two.
| Failure mode | Recommended action | Risk lever | CMMS task type |
|---|---|---|---|
| Reject gate actuator seized | Test reject with a sample at shift start and clean the actuator | Detection | Recurring inspection with sign-off |
| Flow meter drift | Verify against a calibrated reference at set intervals | Detection | Calibration PM |
| Jaw temperature drift | Measure actual versus setpoint and replace worn elements | Occurrence | PM with recorded readings |
| Nozzle valve sticking | Inspect seals and residue at each changeover | Occurrence | Checklist tied to changeover |
| Sensor contamination | Add lens cleaning to the cleaning routine | Occurrence | Sanitation task with maintenance check |
Before and After: Re-Scoring Proves the Action Worked
An action is not complete until the risk is re-evaluated. Compare the original and revised scores using the same scale.
Before Action
- Reject test done when someone remembers
- Detection scored 8 for lack of verification
- Findings remain in a spreadsheet
- No record of who checked what
After Action
- Shift-start test scheduled automatically
- Detection re-scored after test results are recorded
- Failure codes feed the next review
- Audit trail available by asset and date
How a CMMS Keeps FMEA Alive
Without a system, FMEA becomes a document that is filed after the workshop. A CMMS keeps the analysis connected to day-to-day work.
Asset Register
Attach failure modes to the filler, sealer or conveyor record.
PM Generation
Create recurring tasks from actions, by calendar or running hours.
Mobile Execution
Technicians complete checklists and record readings on the line.
Failure Coding
Corrective work orders capture the actual mode and cause.
Reporting
Dashboards reveal repeat modes and update occurrence scores.
Preparing for an FMEA Session
Good preparation reduces debate and produces more accurate scores.
- Bring failure history. Work orders, downtime logs and OEE loss categories give occurrence evidence.
- Include operators. They see early symptoms such as small drips, unusual noise or label drift.
- Involve quality. They can judge severity for product safety and complaint risk.
- Gather drawings and manuals. OEM documentation helps define functions and limits.
- Agree on scale anchors. Write them down so scores can be defended later.
Which Type of FMEA Fits Your Question
The label matters because each type looks at a different part of the problem. Maintenance teams usually work with equipment-level analysis.
| Type | Focus | Typical user | Packaging line example |
|---|---|---|---|
| Design FMEA | How a product or machine design could fail | Engineering, machine builders | Evaluating a new nozzle design |
| Process FMEA | How a process step could produce a defect | Quality and production | Seal formation across a range of films |
| Equipment or machinery FMEA | How equipment failures affect output and safety | Maintenance and reliability | Filler, sealer and conveyor failure modes |
Process and equipment FMEAs overlap on a packaging line. Run them together when a machine fault directly produces a product defect.
Writing Failure Modes That Lead to Action
Vague entries produce vague actions. Describe what physically goes wrong, on which part, and what the effect is.
| Weak statement | Stronger statement | Why it is better |
|---|---|---|
| Filler problem | Nozzle valve seal worn, allowing drip after cut-off | Points to a part, a symptom and a task |
| Sealer not working | Heater cartridge degraded, jaw temperature below setpoint | Suggests a measurement and a spare |
| Labeler issue | Label sensor lens fouled, causing missed gap detection | Leads to a cleaning or inspection task |
| Conveyor jam | Guide rail displaced after changeover, tipping containers | Points to a setting standard |
Detection Controls on a Packaging Line
Detection scores should reflect how reliably a failure would be caught before it reaches the customer. List the controls that already exist.
- In-line devices. Checkweighers, vision systems, metal detectors and seal inspection stations.
- Machine alarms. Temperature, pressure, presence and torque alarms that stop or warn the line.
- Operator checks. Scheduled sampling, visual checks and start-up verification.
- Quality tests. Leak tests, seal strength tests and weight audits.
- Preventive inspections. Measurements that reveal wear before a failure occurs.
A control earns a good detection score only if it is working, tested and reliably acted upon.
Worked Cause-and-Effect Chain: Sealer Temperature Drift
This illustration shows how one failure mode is traced from cause to customer effect before it is scored.
Cause
Heater cartridge degrades gradually or thermocouple contact loosens.
Failure Mode
Actual jaw temperature drifts from the setpoint.
Local Effect
Seal strength or appearance falls outside specification.
Line Effect
Rejects, rework or leaker risk if not detected.
Customer Effect
Leaking or spoiled product if a defective pack escapes.
Scoring Traps to Avoid
Recency Bias
The last breakdown feels more frequent than it is. Use history.
Dominant Voice
One senior person sets every score. Let each member rate first.
Optimistic Detection
Assuming alarms work without testing them inflates confidence.
Score Inflation
If everything is high, nothing is prioritized. Anchor to the scale.
How FMEA Relates to HACCP and Quality Plans
FMEA and food safety plans ask related questions but are not interchangeable. A hazard analysis looks at food safety hazards, while an equipment FMEA looks at failures of machines and their consequences.
- Use quality input for severity. Quality teams know which defects matter for product safety, legal and customer requirements.
- Link controls. If a metal detector is a control point, its failure modes and tests should appear in both documents.
- Keep one change process. When equipment or settings change, update both the FMEA and relevant quality records.
Using CMMS History to Score Occurrence
Occurrence scores are most defensible when they come from recorded events, not from memory.
Memory-Based Scoring
- Estimates vary between participants
- Rare dramatic events dominate
- Minor stops go uncounted
History-Based Scoring
- Counts taken from coded work orders
- Repeat failures stand out
- Scores can be revised as data grows
When to Review the FMEA
- After a significant failure or near miss. Check whether the mode was listed and scored correctly.
- When equipment or settings change. New formats, speeds or components can introduce new modes.
- After completed actions. Re-score to confirm that risk has fallen.
- On a regular schedule. Annual review for critical assets keeps the analysis current.
Turning Recommended Actions Into an Action Plan
Each action needs an owner, a date and a measurable result. Without them, the FMEA stays a document.
| Element | What to record | Example |
|---|---|---|
| Action | The specific change or task | Add weekly jaw temperature measurement |
| Risk lever | Occurrence, detection or severity | Detection |
| Owner | One accountable person | Maintenance planner |
| Due date | When it will be in place | Before the next planned stop |
| Evidence | How completion will be shown | Recorded readings on the work order |
| Re-score | Revised severity, occurrence and detection | Reviewed after several recorded cycles |
Roles in a Packaging Line FMEA Session
- Facilitator. Keeps the team on the method and ensures every participant scores independently.
- Maintenance technician. Provides repair history, wear patterns and realistic task options.
- Operator. Describes early symptoms, changeover issues and workarounds.
- Quality representative. Rates product and compliance severity.
- Process or machine engineer. Explains design limits and modification options.
- Recorder. Captures decisions so the analysis can be loaded into the CMMS.
Teams that want to see how findings turn into recurring work can schedule an Oxmaint demo and walk through a sample PM and inspection setup.
Common FMEA Mistakes on Packaging Lines
- Analyzing the whole plant at once. Start with the filler, sealer or the machine that limits output, then extend the method.
- Treating RPN as the only answer. Review severity and detection separately so serious but rare events are not missed.
- Leaving out minor stops. Short, frequent stops often explain more lost output than rare major failures.
- Never closing actions. A list of recommendations without owners and dates changes nothing on the line.
- Not updating after changes. New formats, films or settings can create failure modes the original analysis did not consider.
Practical Starting Point
Choose one machine, such as the sealer, and list its ten most important functions. Score them with a small team in a single focused session, then load the highest-risk actions into your maintenance system and review them after a few weeks of recorded results.
FMEA FAQs for FMCG Plants
What is a good RPN threshold?
There is no universal cut-off. Rank within your own analysis and always review high-severity items separately.
Should we analyze the whole line at once?
Start with the bottleneck machine or the filler and sealer, then extend as the team gains experience.
How is FMEA different from RCM?
FMEA ranks risk. RCM adds consequence classification and a structured task selection process.
Can a CMMS store FMEA results?
Yes. Oxmaint can track the resulting PM tasks and failure history by asset.
How often should we update it?
Revisit after incidents, equipment changes or new products. Book a demo to see a review workflow.
Make Every High-Risk Failure Mode Someone's Scheduled Task
Connect your FMEA findings to preventive maintenance, inspections and failure data in one platform, and focus technicians on the risks that matter most.