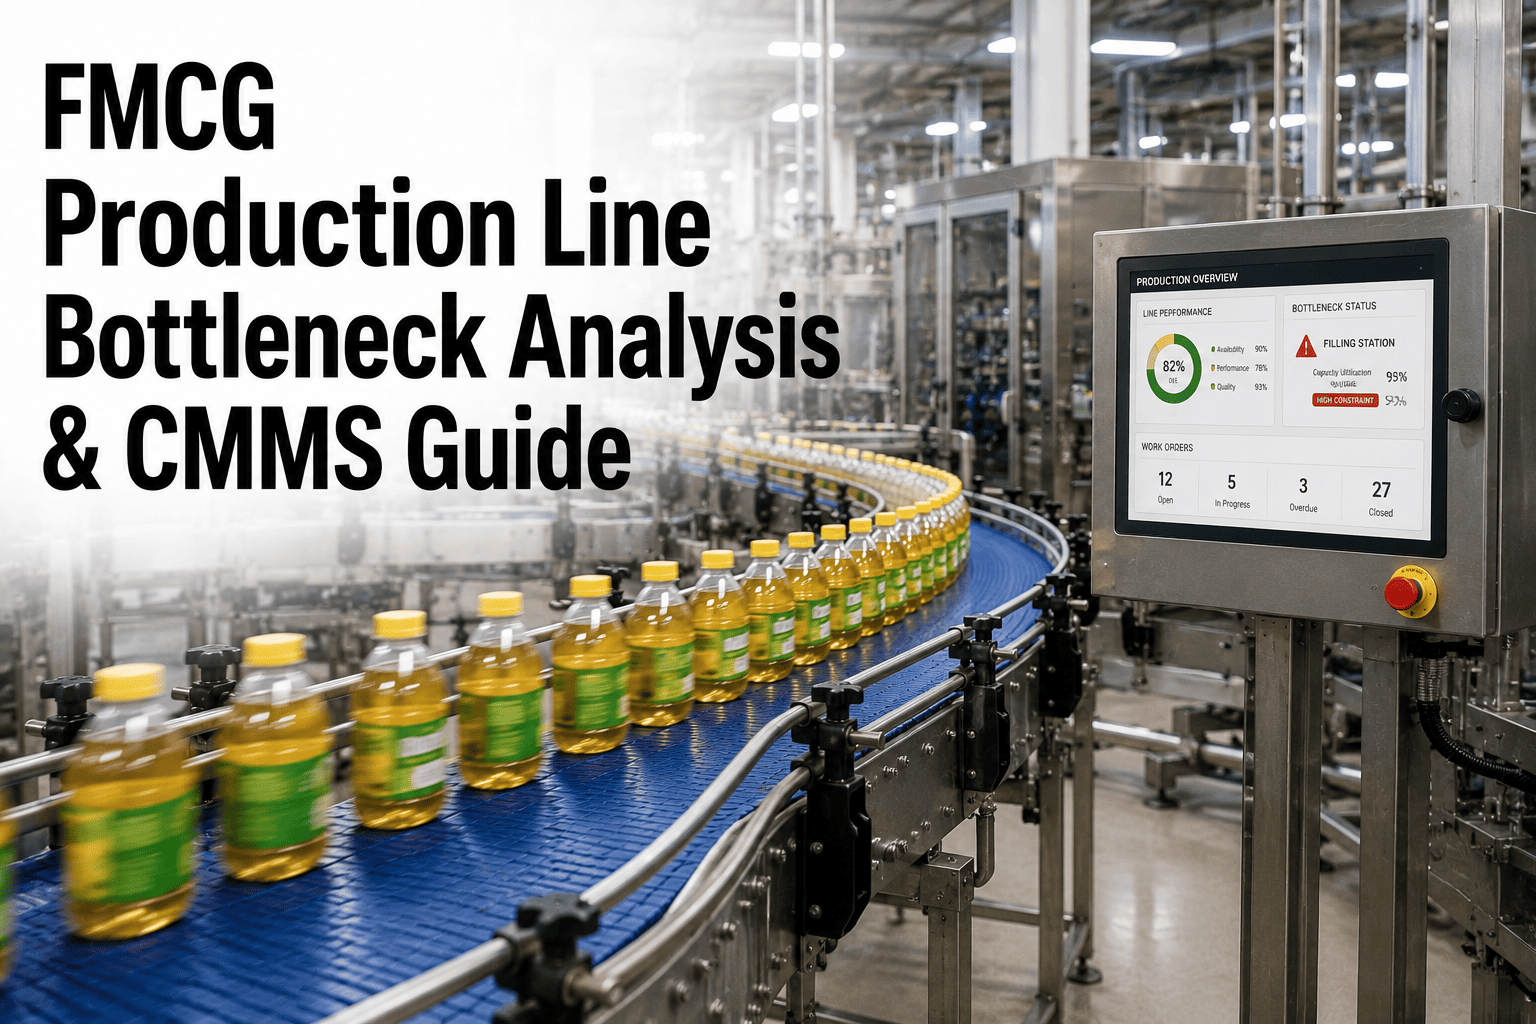
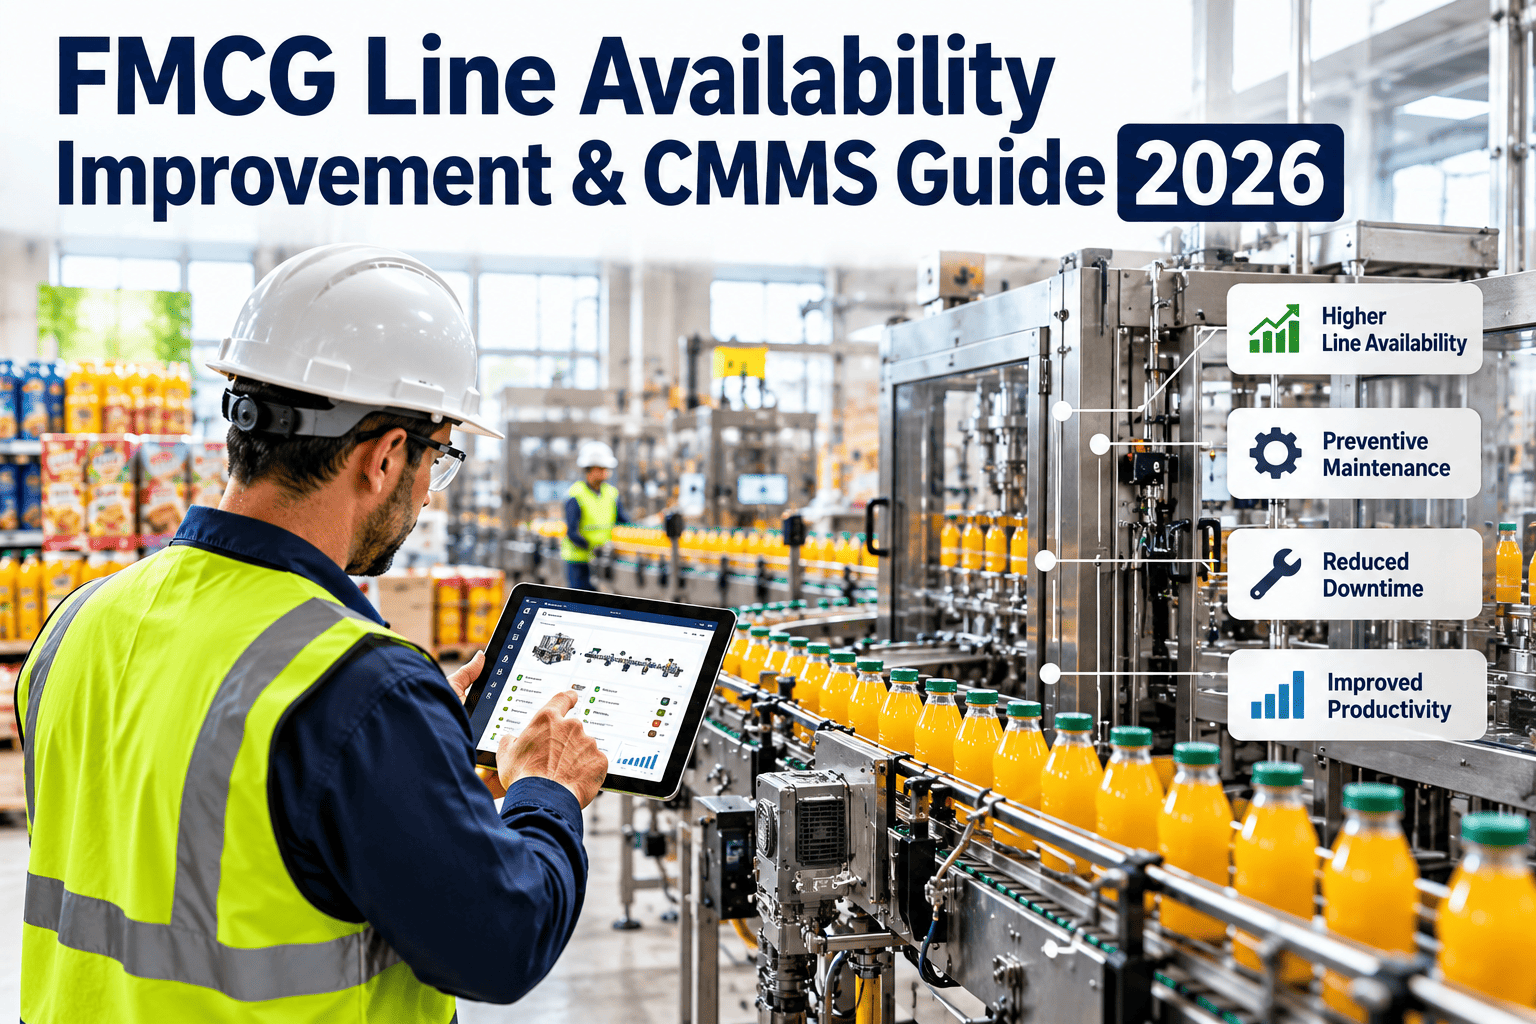
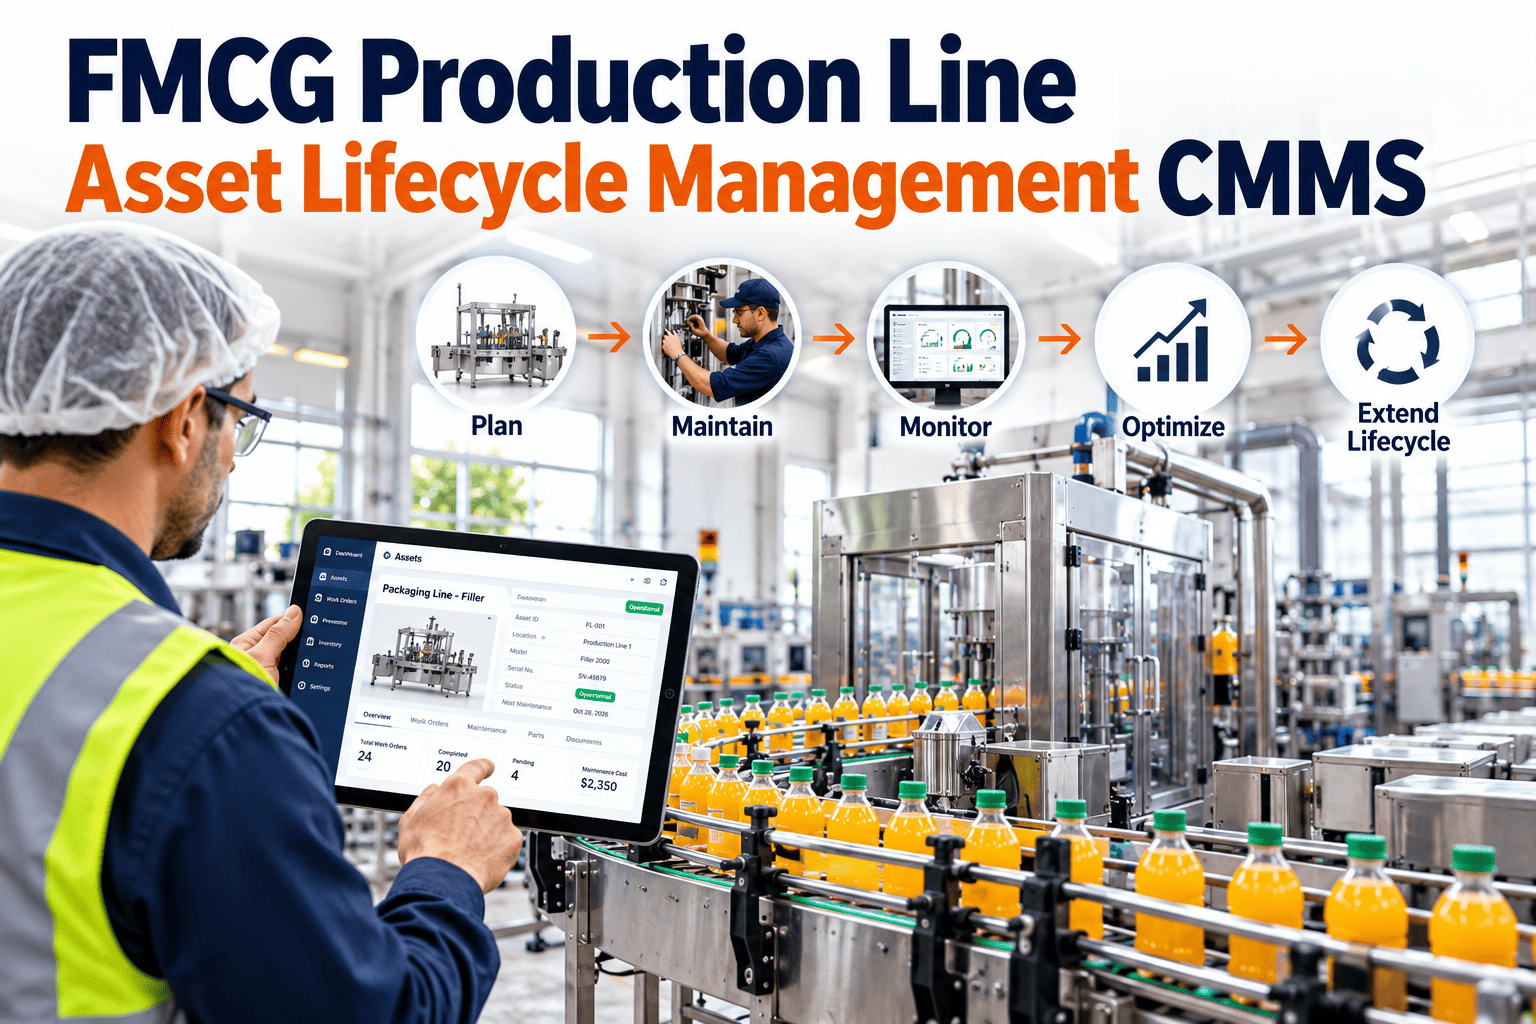
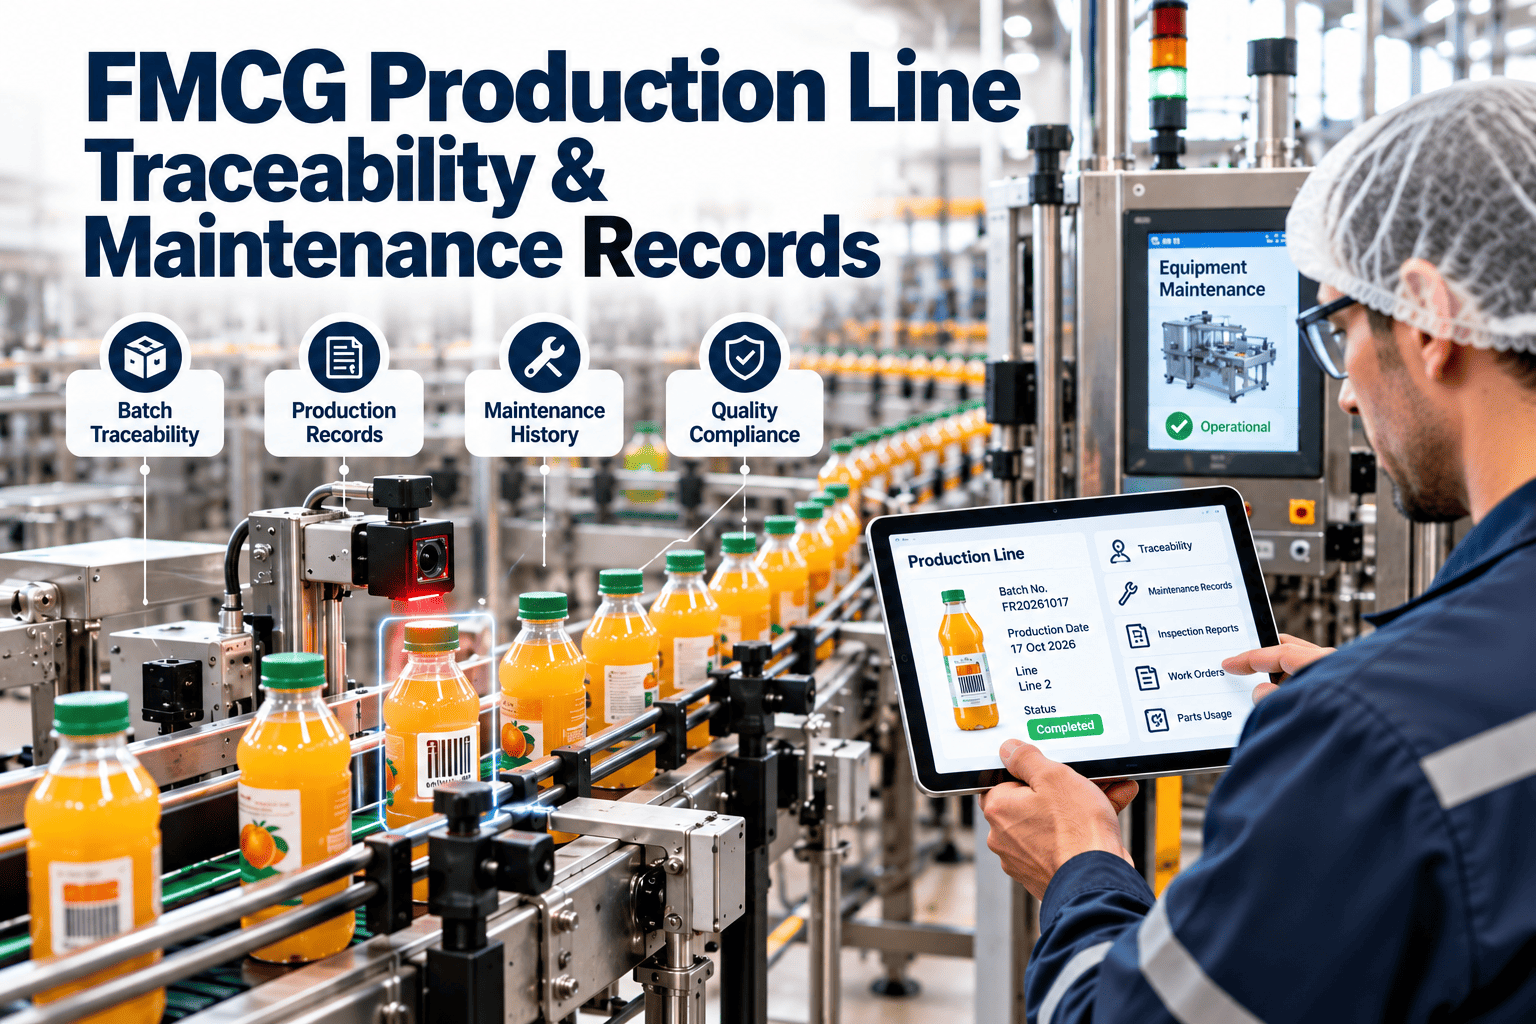
Every line has five stations and one constraint, but most improvement effort gets spread across all five anyway. A filler running at 94% availability looks fine in isolation. It's only a bottleneck once you see it's the slowest station on the line, and every minute lost there is a minute the whole line can never make up. Sign up to find your actual constraint before spending another reliability budget on the wrong asset.
What This Guide Covers
This guide covers FMCG production line bottleneck analysis in CMMS: bottleneck identification methodology, theory of constraints application, downtime attribution by asset, and how a CMMS concentrates reliability effort on the one station that actually limits throughput.
Spotting The Constraint On The Line
Depalletizer
97%
availability
Capper
88%
the constraint
Case Packer
97%
availability
The capper looks close to the others on a percentage basis, but it's still the station setting the ceiling for what the entire line can produce. Fixing anything else first buys nothing.
Where Bottleneck Analysis Goes Wrong
| Mistake |
Why It Wastes Improvement Effort |
| Line-level OEE only |
A single blended number hides which station is actually setting the pace, so effort gets spread evenly instead of targeted |
| Fixing the loudest complaint |
The station operators complain about most isn't always the one actually limiting throughput on the line |
| Ignoring the shifted constraint |
Fixing today's bottleneck moves the constraint elsewhere, and analysis that isn't repeated keeps chasing yesterday's problem |
| No downtime attribution by asset |
Without downtime logged per station, nobody can say with confidence which asset is really the constraint |
Four Steps To Find And Fix The Real Constraint
1
Attribute Downtime By Station, Not Just By Line
Logging stoppages against each individual asset is the only way to see which station is actually setting the pace
2
Confirm The Constraint Before Committing Budget
Comparing throughput-limiting downtime across stations, not just failure counts, confirms which asset is the true constraint
3
Concentrate Reliability Effort On That One Asset
PM frequency, spare parts priority, and technician attention shift to the constraint until it's no longer the ceiling
4
Re-Run The Analysis After Every Fix
Once the constraint moves to a different station, the whole cycle repeats there instead of on the station just fixed
Find Your Line's Real Constraint, Not Its Loudest One
OxMaint attributes downtime by station so you can see exactly which asset is limiting your line's throughput. Sign up for a free trial to start your bottleneck analysis, or book a demo to see it mapped to your production lines.
What A CMMS Adds To Bottleneck Analysis
Downtime Logged By Asset
Every stoppage is tied to a specific station, building the station-by-station picture manual OEE tracking misses
Constraint Ranking Over Time
Comparing throughput-limiting downtime week over week shows when the constraint has actually moved to another station
Targeted PM Reprioritization
PM frequency and technician assignment can shift to the identified constraint instead of staying spread evenly
Throughput Impact Visibility
Each fix on the constraint asset can be tied to an estimated line throughput gain, making the next investment easy to justify
Not Every Slow Station Is The Bottleneck
A station can run below its own best availability and still not be the line's constraint. The lines that actually improve throughput are the ones ranking stations by downtime and fixing the one at the top, not the ones improving whichever asset gets the most attention.
Frequently Asked Questions
Q
What is the theory of constraints, applied to a production line?
It holds that a line's output is set by its single slowest station, so improving any other station without addressing that one produces no gain in overall throughput.
Q
Why isn't line-level OEE enough to find the bottleneck?
A blended line-wide figure averages away the differences between stations, which is exactly the detail needed to identify which one is actually setting the ceiling.
Q
How often should bottleneck analysis be repeated?
It's worth re-running after every meaningful fix to the current constraint, since resolving one station's limitation typically shifts the constraint to whichever station is next slowest.
Stop Guessing Which Station Is Holding Your Line Back
OxMaint attributes downtime station by station and ranks your real constraint, so reliability effort goes exactly where throughput is being lost. Sign up for a free trial to run your first bottleneck analysis, or book a demo to see it built around your lines.