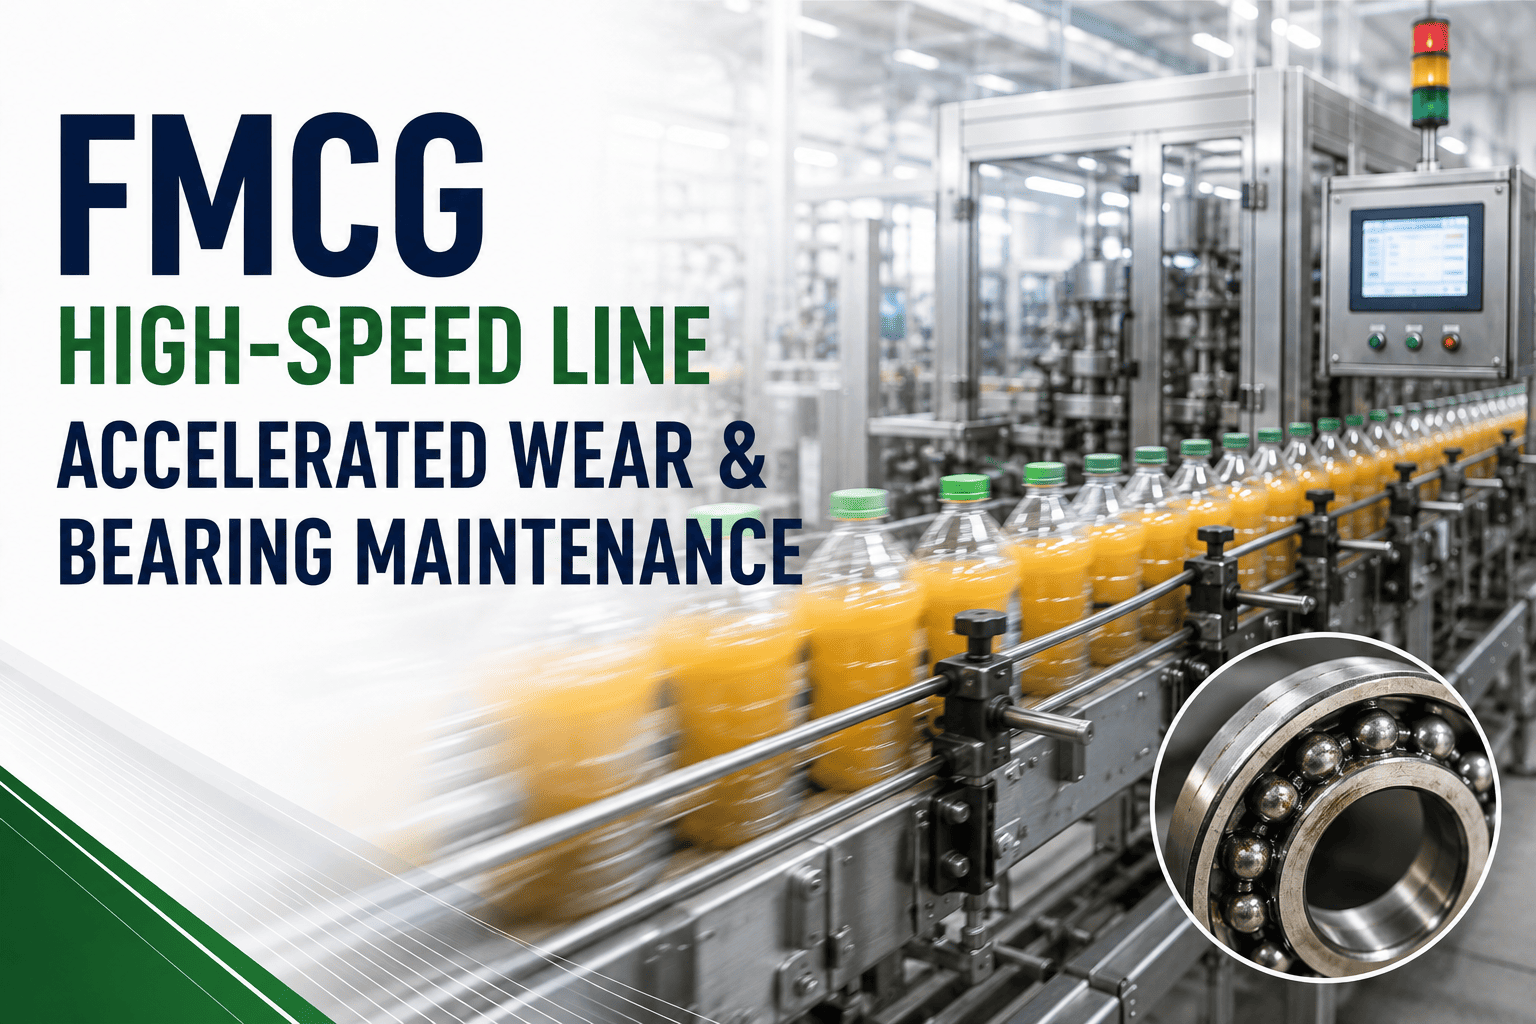
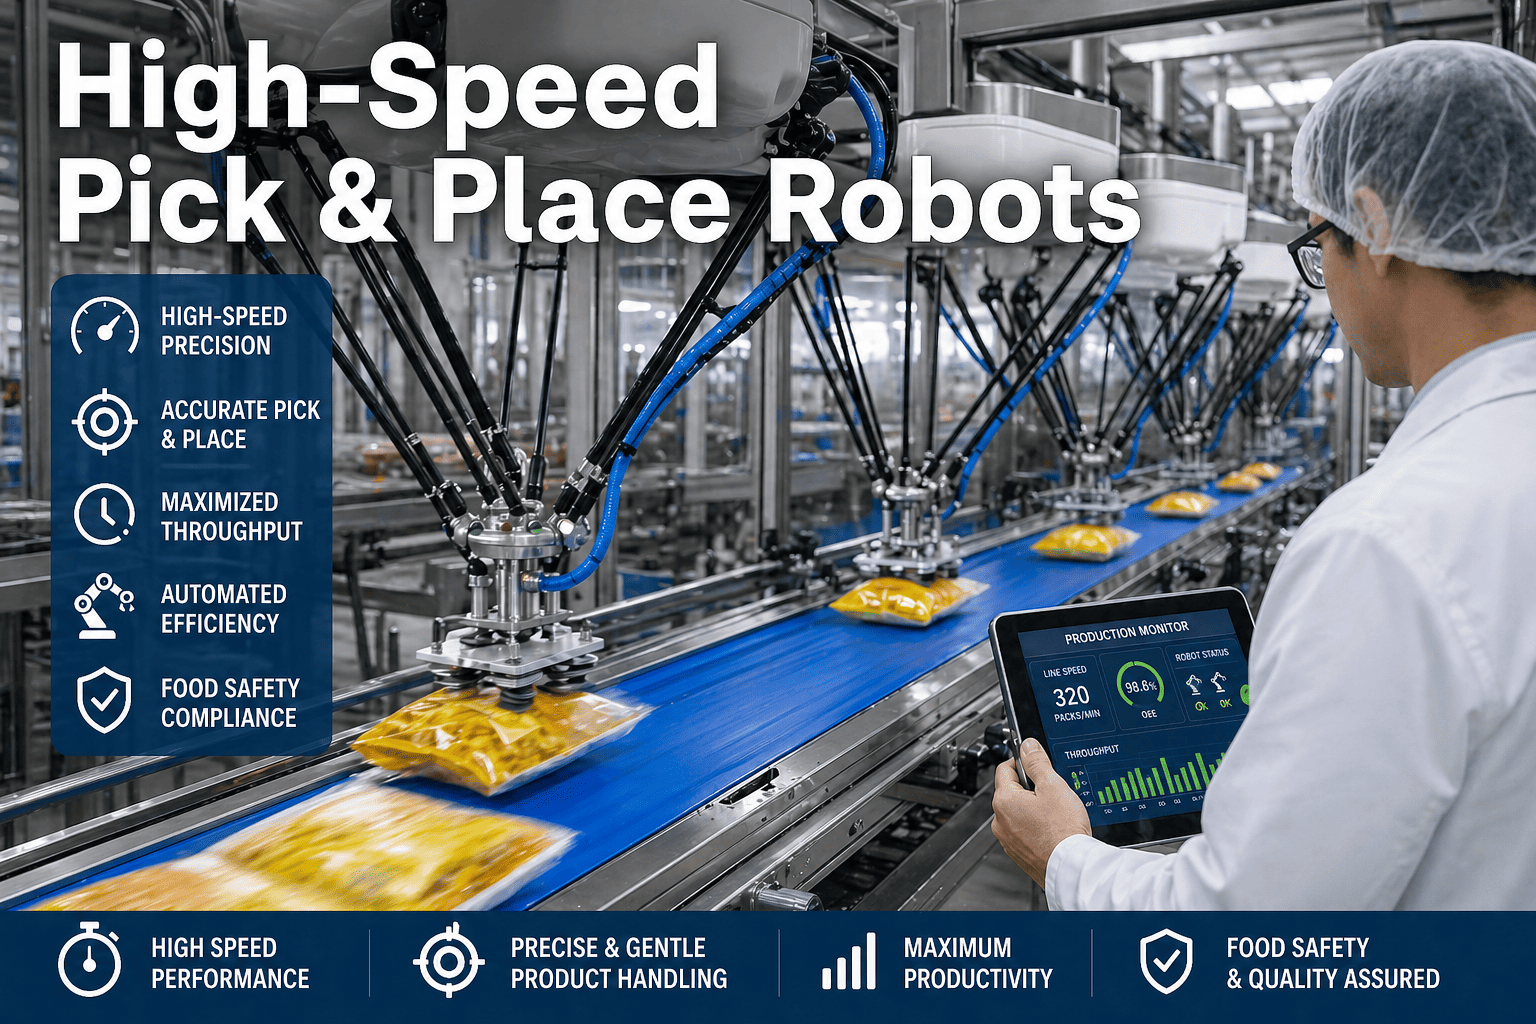
Running a high-speed FMCG production line at its theoretical maximum speed is not the goal — running it at the highest speed that consistently delivers good quality product with zero unplanned stops is. Most high-speed packaging, filling, and labeling lines in food and beverage manufacturing are operating at 72 to 82 percent of their design throughput capacity because the triangle of speed, quality, and reliability is out of balance. Push the line faster and defects climb. Run it conservatively and throughput suffers. The plants closing this gap are not doing it with new capital equipment — they are doing it with real-time data, asset condition visibility, and AI-driven line balancing that finds and holds the optimal operating point for every combination of product, packaging, and asset condition. Start a free trial and connect your production line data to Oxmaint's performance analytics today, or book a demo to see live line efficiency tracking in action.
72–82%
Actual vs. Design Throughput
typical performance gap on high-speed FMCG lines
15–25%
Hidden Speed Losses
from micro-stops, defects, and conservative speed settings
300+
Units Per Minute
common design speed on beverage and personal care packaging lines
+10–18%
Throughput Recoverable
through data-driven speed and condition optimization
Your line is faster than you think — you just need the data to prove it safely
Oxmaint's real-time production analytics connects line speed, asset condition scores, quality deviation data, and OEE in a single dashboard — giving plant managers the confidence to push throughput without risking reliability or quality.
The High-Speed Line Efficiency Triangle
High-speed production line performance is governed by the relationship between three variables that operators and plant managers must balance simultaneously. Optimizing any one variable without tracking the other two creates a new problem. Understanding this triangle is the foundation of sustainable high-speed line performance.
Speed
Throughput Rate
Line speed in units per minute relative to design specification. Running below design speed to "protect" quality or reliability is a hidden OEE performance loss — often 8 to 15 percentage points that operators accept as normal without realizing it is recoverable.
Loss if 10% below design: 1,728 units/shift on a 300 UPM line
Quality
Good Product Rate
The share of total production that passes all quality checks on the first pass. Speed-quality tension is real — components running with degraded seals, worn guides, or uncalibrated sensors produce more defects at higher speeds, creating a quality-throughput trade-off that requires condition data to resolve correctly.
Every 1% defect rate at 300 UPM = 4,320 waste units per shift
Reliability
Availability & Uptime
The proportion of scheduled production time the line runs without unplanned stops. High-speed lines are disproportionately sensitive to component wear — a bearing degrading 15% generates no performance issue at 80% speed but causes micro-stops and eventual failure at 100% speed.
A 5% availability loss on a 300 UPM line = 43,200 units per shift
The Solution
Real-Time Data Integration
The only way to optimize all three simultaneously is real-time data connecting line speed, quality output, asset condition scores, and micro-stop patterns in a single view. Data makes the invisible trade-offs visible — and points to the specific asset or process change needed to push throughput safely.
Plants with integrated data recover 10–18% throughput without reliability loss
Why High-Speed Lines Run Below Their Potential
The speed gap — the difference between a line's design throughput and its actual sustained operating speed — is not a design flaw. It is the accumulated result of unresolved maintenance issues, conservative operator settings made without data, and process drift that no one has the visibility to track. The specific causes differ by line type but share a common root: the absence of connected real-time performance data.
01
Conservative Speed Defaults
Operators manually reduce line speed after a quality or jamming incident and rarely increase it back. Without data showing the asset is now in spec, the speed reduction stays — becoming the permanent "normal" for that shift and line.
02
Component Wear and Drift
Worn packaging film guides, degraded filling nozzle seals, and belt tension loss all restrict the speed at which the line can run without generating defects — but the link between maintenance condition and speed ceiling is almost never tracked or measured.
03
Accumulation Bottlenecks
When a downstream section (labeler, caser, palletizer) cannot keep pace with the upstream filler or wrapper, the line is throttled to the slowest element. Line balancing analysis — matching section speeds to throughput targets — is rarely conducted with real throughput data.
04
Micro-Stop Tolerance
Short stoppages that clear in under 3 minutes are tolerated as "normal" rather than investigated. On a 300-unit-per-minute line, each 3-minute micro-stop costs 900 units of output. Frequency and pattern go untracked without automated data capture.
Line Efficiency by Equipment Type: What the Data Shows
How Oxmaint Optimizes High-Speed Production Line Efficiency
Oxmaint connects asset condition, production performance, quality data, and maintenance history in a single platform — giving plant managers and line technicians the real-time intelligence to operate high-speed lines at their optimal throughput point, not a conservative estimate of it. Start a free trial and get live throughput analytics on your lines, or book a demo to see the full production analytics suite.
Speed Intelligence
Real-Time Throughput Tracking
Live UPM tracking against design speed and shift target — by section, by line, and by shift. See exactly where the line is running below design speed and whether it correlates with an asset condition event or a manual speed reduction.
Condition Link
Speed-to-Asset Health Correlation
Oxmaint links production speed data to asset condition scores — identifying which specific components are constraining throughput and whether a maintenance intervention would unlock higher sustained speed safely.
Quality Guard
Defect Rate at Speed Monitoring
Quality deviation rate tracked alongside throughput speed — revealing the actual speed-quality operating range for each line and product combination. Data replaces operator instinct on where the speed ceiling truly is.
Stop Analysis
Micro-Stop Pareto at Speed Breakpoints
Automatic detection of whether micro-stop frequency increases above specific speed thresholds — pinpointing the speed at which component wear becomes a reliability constraint, before it becomes a breakdown event.
High-Speed Line Efficiency: Results From Data-Driven Management
+10–18%
Throughput Recovered
From closing the speed gap between conservative operating speed and validated maximum with real-time condition data
60%
Fewer Speed Reductions
Operator-initiated speed reductions drop when condition data shows the asset is in spec and the speed reduction is unnecessary
1.8%
Down to Under 1% Defect Rate
Quality deviation reduction from targeted component maintenance that expands the safe high-speed operating range
Zero CapEx
Capacity Increase
All throughput gains achieved through data and maintenance optimization — not new equipment purchase or line expansion
Frequently Asked Questions
Why do high-speed FMCG lines routinely run below their design speed?
The most common causes are conservative operator speed settings made after quality incidents (and never reversed), component wear that shifts the speed-quality relationship without anyone tracking it, downstream bottlenecks that throttle the full line to the slowest section, and micro-stop patterns that operators accept as normal without measuring their cumulative throughput impact. All of these are resolvable with real-time data connecting line speed, asset condition, and quality deviation in one view.
How do you increase production line speed without increasing defects or breakdowns?
The safe path to higher sustained line speed requires three steps: first, establish the actual relationship between speed and defect rate for your current asset condition using real production data. Second, identify which specific components are limiting the speed-quality operating range — these are maintenance targets, not equipment replacement candidates. Third, track micro-stop frequency at different speed levels to find the threshold where reliability degrades. Maintenance interventions that address these constraints expand the safe operating range, allowing higher sustained speeds without reliability or quality trade-offs.
What is line balancing and how does it affect high-speed production efficiency?
Line balancing is the process of matching the throughput capacity of each section of a production line — filler, wrapper, labeler, caser — to prevent bottlenecks that throttle overall line speed. When one section runs 15% slower than the others, the entire line is limited to that section's capacity regardless of how well-maintained the other assets are. Real-time section speed monitoring identifies where bottlenecks occur and whether they are maintenance-related or capacity-related — guiding targeted interventions that unlock full line throughput.
How quickly can a food plant recover throughput using production data analytics?
Most plants see actionable throughput improvement opportunities within the first 2 weeks of deploying real-time line speed and condition tracking — because conservative speed settings and uncorrected bottlenecks are often immediately visible in the data. Actual throughput recovery through targeted maintenance on the identified speed-constraining components typically follows within 30 to 60 days, delivering 10 to 18 percent throughput increase without capital investment.
Recover 10–18% of throughput you are already losing — without buying new equipment
Oxmaint's production analytics platform gives plant managers live line speed tracking, asset-condition-to-throughput correlation, quality-deviation monitoring, and micro-stop analysis — all in one dashboard connected to your maintenance work order system. Deploy in days, not months.