Line 4 at a mid-size beverage bottling plant runs 22 hours a day, 6 days a week. The nameplate capacity is 600 bottles per minute. But last quarter, the line averaged 389 bottles per minute—a 64.8% OEE that the plant manager knew was "about average for the industry." What he didn't know was where the other 35.2% went. Changeover times averaged 47 minutes when the standard was 22. Micro-stops under 5 minutes—too brief for operators to log manually—accumulated to 68 minutes per shift. Quality rejects spiked 340% during the first 12 minutes after every changeover because fill-head calibration drifted during cleaning. None of this was visible in the plant's monthly production reports, which tracked total output but not the losses hiding inside every shift. When an AI analytics platform connected to the line's PLCs and started decomposing every second of runtime, the picture changed completely. Within 90 days, the same line was running at 78.3% OEE—a 13.5-point improvement worth $2.1 million in annualized throughput on a single line, with zero capital equipment investment.
OEE—Overall Equipment Effectiveness—is the single most important metric in FMCG manufacturing. It multiplies three factors: Availability (are you running?), Performance (are you running fast?), and Quality (are you making good product?). World-class FMCG plants achieve 85%+ OEE. The industry average hovers around 60–65%. The gap between average and world-class represents millions in unrealized production capacity hiding inside equipment you've already paid for. AI analytics doesn't just measure OEE—it decomposes losses into their root causes in real time and tells your team exactly where to focus for maximum improvement. Schedule a demo to see AI-driven OEE analytics in action.
This guide explains how AI-powered production analytics transforms OEE measurement from a lagging monthly report into a real-time operational tool that drives continuous improvement across FMCG packaging and processing lines. Sign up free to start tracking production performance digitally.
Your lines are running. But how much of their capacity are you actually capturing?
AI analytics connects directly to your PLCs and SCADA systems to decompose every second of production into productive time or specific loss categories—automatically, in real time, with zero operator burden. See exactly where throughput disappears on every line, every shift, and get prioritized recommendations ranked by financial impact so your team knows precisely where to focus for maximum recovery.
Why FMCG Plants Need AI-Driven OEE Analytics
FMCG manufacturing operates on razor-thin margins where production efficiency determines profitability. A snack food plant running 12 packaging lines at 62% OEE versus 78% OEE isn't just leaving output on the table—it's leaving profit, capacity, and competitive advantage on the table. Traditional OEE tracking methods—manual logs, end-of-shift reports, monthly summaries—capture the number but miss the story behind it. AI analytics captures every second of production data and decomposes losses with granularity that human observation simply cannot match.
| Challenge | Traditional OEE Tracking | AI-Powered OEE Analytics |
|---|---|---|
| Data Collection | Manual operator logs, end-of-shift forms, delayed entry | Automated PLC/SCADA data capture every second, zero operator burden |
| Loss Categorization | Broad categories (breakdown, changeover, "other") | Granular auto-classification of 50+ loss types with root cause tagging |
| Micro-Stop Visibility | Stops under 5 minutes rarely logged; accumulate invisibly | Every stop ≥1 second captured, categorized, and trended automatically |
| Speed Loss Detection | Operators may not notice 5–10% speed reductions | Real-time speed monitoring against ideal cycle time, alerts on drift |
| Root Cause Analysis | Monthly Pareto charts from aggregated data; delayed and imprecise | Real-time Pareto with drill-down to shift, product, operator, and condition |
How AI Production Analytics Transforms OEE
AI-powered production analytics connects directly to existing PLC, SCADA, and MES infrastructure to capture machine-level data in real time. The system doesn't just calculate OEE—it decomposes every percentage point of loss into actionable categories, identifies patterns across shifts and products, and prioritizes improvement opportunities by financial impact.
Machine signals captured every second: run/stop, speed, counts, faults, changeover states
AI classifies every second into productive time or specific loss category automatically
Algorithms correlate losses with products, operators, shifts, ambient conditions, and sequences
Dashboard shows highest-impact opportunities ranked by recoverable throughput and cost
What AI Sees That Operators Cannot
Human operators are excellent at identifying major breakdowns and obvious quality issues. But FMCG production losses are dominated by subtle, cumulative inefficiencies that are invisible to the human eye: micro-stops that accumulate to hours per shift, speed reductions of 3–5% that persist unnoticed, and quality degradation patterns that correlate with conditions no one thought to track.
| Loss Type | Manual Tracking Captures | AI Analytics Reveals |
|---|---|---|
| Changeover | Total changeover time logged at shift end | Phase-by-phase breakdown: drain, clean, setup, first-article—with variance by product and operator |
| Micro-Stops | Rarely captured; lumped into "minor stops" or missed entirely | Every stop ≥1 sec classified by location, duration, frequency, and preceding conditions |
| Speed Loss | "Line was running"—no speed deviation tracking | Real-time speed vs. ideal cycle time with drift detection and root cause correlation |
| Startup Waste | Total rejects counted; not segmented by phase | Reject rate mapped to minutes post-changeover with specific failure mode identification |
| Planned Stops | Scheduled time excluded from OEE calculation | Planned stop overruns quantified—a 30-min planned CIP that consistently takes 48 min |
| Idle Time | Logged as "waiting for materials" or "no orders" | Upstream/downstream correlation identifies true bottleneck causing idle condition |
The Three Pillars of OEE: AI-Powered Deep Dive
AI analytics transforms each OEE pillar from a single number into a diagnostic tool that pinpoints exactly where losses occur and what causes them. Sign up free to start decomposing your production losses.
| OEE Pillar | What It Measures | Common FMCG Losses | AI Detection Method | Typical Improvement |
|---|---|---|---|---|
| Availability | Planned production time minus downtime, ÷ planned time | Breakdowns, changeovers, material shortages, cleaning overruns | Automatic stop classification from PLC fault codes and state transitions | 5–8% improvement from changeover optimization and breakdown reduction |
| Performance | Actual throughput ÷ theoretical maximum throughput | Micro-stops, reduced speed, idling, minor jams, feeding issues | Cycle-by-cycle speed analysis detecting deviations from ideal rate | 4–7% improvement from micro-stop elimination and speed optimization |
| Quality | Good units produced ÷ total units produced | Startup rejects, in-run defects, rework, weight/fill variance | SPC integration with process parameter correlation per reject type | 2–4% improvement from startup optimization and process control |
FMCG Line-Specific OEE Applications
Different FMCG production lines have distinct loss profiles and improvement opportunities. AI analytics adapts its detection algorithms to the specific equipment, products, and failure modes of each line type.
| Line Type | Key OEE Challenges | AI Analytics Focus | Primary Loss Driver | Recovery Potential |
|---|---|---|---|---|
| Beverage Filling | Filler efficiency, CIP duration, changeover for flavor/size | Fill-head performance monitoring, CIP cycle optimization, changeover phase analysis | Micro-stops from label jams and cap feeding (35–45% of total losses) | $1.5–$3.5M/line/year |
| Snack Packaging | Film tracking, weigher accuracy, seal integrity, product feed | Weigher head optimization, film waste correlation, seal temperature trending | Speed losses from product feed inconsistency (30–40% of total losses) | $800K–$2.2M/line/year |
| Dairy Processing | CIP frequency, pasteurizer efficiency, aseptic fill integrity | CIP duration trending, pasteurizer energy efficiency, contamination prediction | Planned stop overruns from extended CIP cycles (25–35% of total losses) | $1.2–$2.8M/line/year |
| Personal Care | Viscosity variation, pump calibration, label placement accuracy | Pump performance degradation, fill weight SPC, label vision system integration | Quality losses from fill weight variance after product changeover (20–30%) | $600K–$1.8M/line/year |
| Bakery/Confection | Oven temperature uniformity, dough consistency, wrapper feeding | Oven zone optimization, dough rheology correlation, wrapper tension monitoring | Performance losses from wrapper feeding issues and oven recovery time (35–45%) | $700K–$2.0M/line/year |
| Frozen Foods | IQF tunnel efficiency, carton erector jams, case packer speed | Tunnel temperature profiling, product flow optimization, downstream bottleneck ID | Availability losses from tunnel recovery and downstream jams (30–40%) | $1.0–$2.5M/line/year |
From beverage fillers to snack wrappers—see exactly where your lines are losing throughput and what it's costing you per shift.
AI analytics adapts to the specific equipment, products, and failure modes on each of your lines. Whether you're battling micro-stops on a beverage filler, CIP overruns on a dairy line, or film tracking issues on a snack wrapper, the platform decomposes losses with granularity that manual tracking simply cannot achieve. Every loss is classified, quantified in dollars, and ranked by recovery potential so your improvement efforts target the highest-value opportunities first.
Changeover Optimization: The Biggest Quick Win
In multi-SKU FMCG plants, changeover losses are typically the single largest availability drain. AI analytics doesn't just measure total changeover time—it decomposes every changeover into discrete phases, identifies variance between operators and product transitions, and reveals which specific steps are consuming excess time.
| Changeover Phase | What AI Tracks | Typical Finding | Improvement Action |
|---|---|---|---|
| Line Drain | Time from last good unit to line empty | Operators wait for line to fully clear instead of beginning external tasks | SMED external task identification; begin prep while line drains |
| Cleaning/CIP | Actual CIP duration vs. standard, chemical usage, rinse times | CIP cycles overrun standard by 15–25 minutes due to temperature recovery delays | Pre-heat CIP solution, optimize chemical concentrations, verify steam availability |
| Mechanical Setup | Individual adjustment times: guides, sensors, heads, conveyors | 3 of 12 adjustments account for 60% of setup time; operators use different methods | Standardize adjustment procedures, invest in quick-change tooling for top 3 adjustments |
| First Article | Time from restart to first saleable unit, reject count during ramp-up | Post-changeover reject rate 8–15x normal for first 12–18 minutes | Calibration verification protocol, saved recipes per SKU, automated setup parameters |
| Speed Ramp | Time to reach target speed from restart | Operators run at reduced speed for 20–30 min post-changeover "to be safe" | Data-driven ramp profiles showing optimal acceleration curve per product |
Implementation Roadmap
Deploying AI-powered OEE analytics in an FMCG plant follows a proven sequence that builds from data infrastructure through pilot validation to full-scale rollout. Start with your highest-value line, prove ROI, and expand. Schedule a demo to plan your implementation.
- Audit PLC/SCADA data availability on target lines—identify signals for run/stop, speed, counts, faults
- Calculate current OEE baseline using available historical data (even if imperfect)
- Map all loss categories: breakdowns, changeovers, micro-stops, speed losses, quality rejects
- Identify ideal cycle times per product/SKU for performance calculation
- Quantify financial value of 1% OEE improvement per line to build ROI case
- Connect analytics platform to PLC/SCADA on 1–2 pilot lines via OPC-UA, Modbus, or API
- Configure automatic loss categorization rules based on machine state signals
- Establish CMMS integration for maintenance-related downtime work order flow
- Deploy real-time OEE dashboards on shop floor displays and supervisor mobile devices
- Train operators and supervisors on dashboard interpretation and loss reporting workflow
- AI system refines loss classification accuracy from operator feedback and validation
- Launch targeted improvement sprints on top 3 loss categories identified by Pareto analysis
- Implement changeover optimization using phase-by-phase timing data
- Address top micro-stop causes with focused maintenance and engineering interventions
- Validate OEE improvement against financial targets—document verified throughput gains
- Expand to all production lines using validated configuration templates from pilot
- Implement predictive maintenance alerts correlating equipment degradation with OEE impact
- Deploy cross-line benchmarking dashboards for shift and operator performance comparison
- Integrate quality system data for closed-loop SPC with automatic process correction
- Launch continuous improvement program with AI-prioritized improvement projects
Reactive vs. Predictive OEE Management
The difference between plants that plateau at 60–65% OEE and those that achieve 80%+ comes down to one thing: whether they react to losses after the fact or predict and prevent them in real time.
| Metric | Reactive OEE Tracking | AI-Powered OEE Analytics |
|---|---|---|
| Data Latency | End-of-shift or end-of-week reports; losses discovered hours or days late | Real-time dashboards with second-by-second loss decomposition |
| Loss Visibility | Major stops logged; micro-stops and speed losses invisible | Every loss ≥1 second captured, classified, and financially quantified |
| Changeover Analysis | Total time only—no phase breakdown or variance analysis | Phase-by-phase with operator, product, and sequence comparison |
| Improvement Targeting | Monthly Pareto from aggregated data; delayed and approximate | Real-time Pareto with drill-down by shift, operator, product, and condition |
| Maintenance Integration | Breakdown time logged; no correlation to OEE impact | Equipment degradation correlated with OEE decline; predictive work orders |
| Operator Performance | Subjective supervisor assessment | Objective, data-driven performance comparison enabling targeted coaching |
| Annual OEE Trajectory | Flat or declining; improvement projects show temporary gains that fade | Sustained year-over-year improvement driven by continuous loss elimination |
Stop guessing where your production losses hide. See every second of every shift decomposed into actionable insights.
AI-powered OEE analytics captures every stop, every slowdown, and every quality event across all your lines—automatically classifying losses into 50+ categories with zero operator input. Real-time Pareto analysis shows your team exactly which losses to attack first, while predictive alerts flag emerging equipment issues before they cause downtime. Plants using AI analytics achieve 12–18 points of OEE improvement in the first year, recovering $1.5M–$3.5M per high-speed line in throughput that was previously invisible.
Frequently Asked Questions
How does AI OEE analytics connect to our existing PLC and SCADA systems?
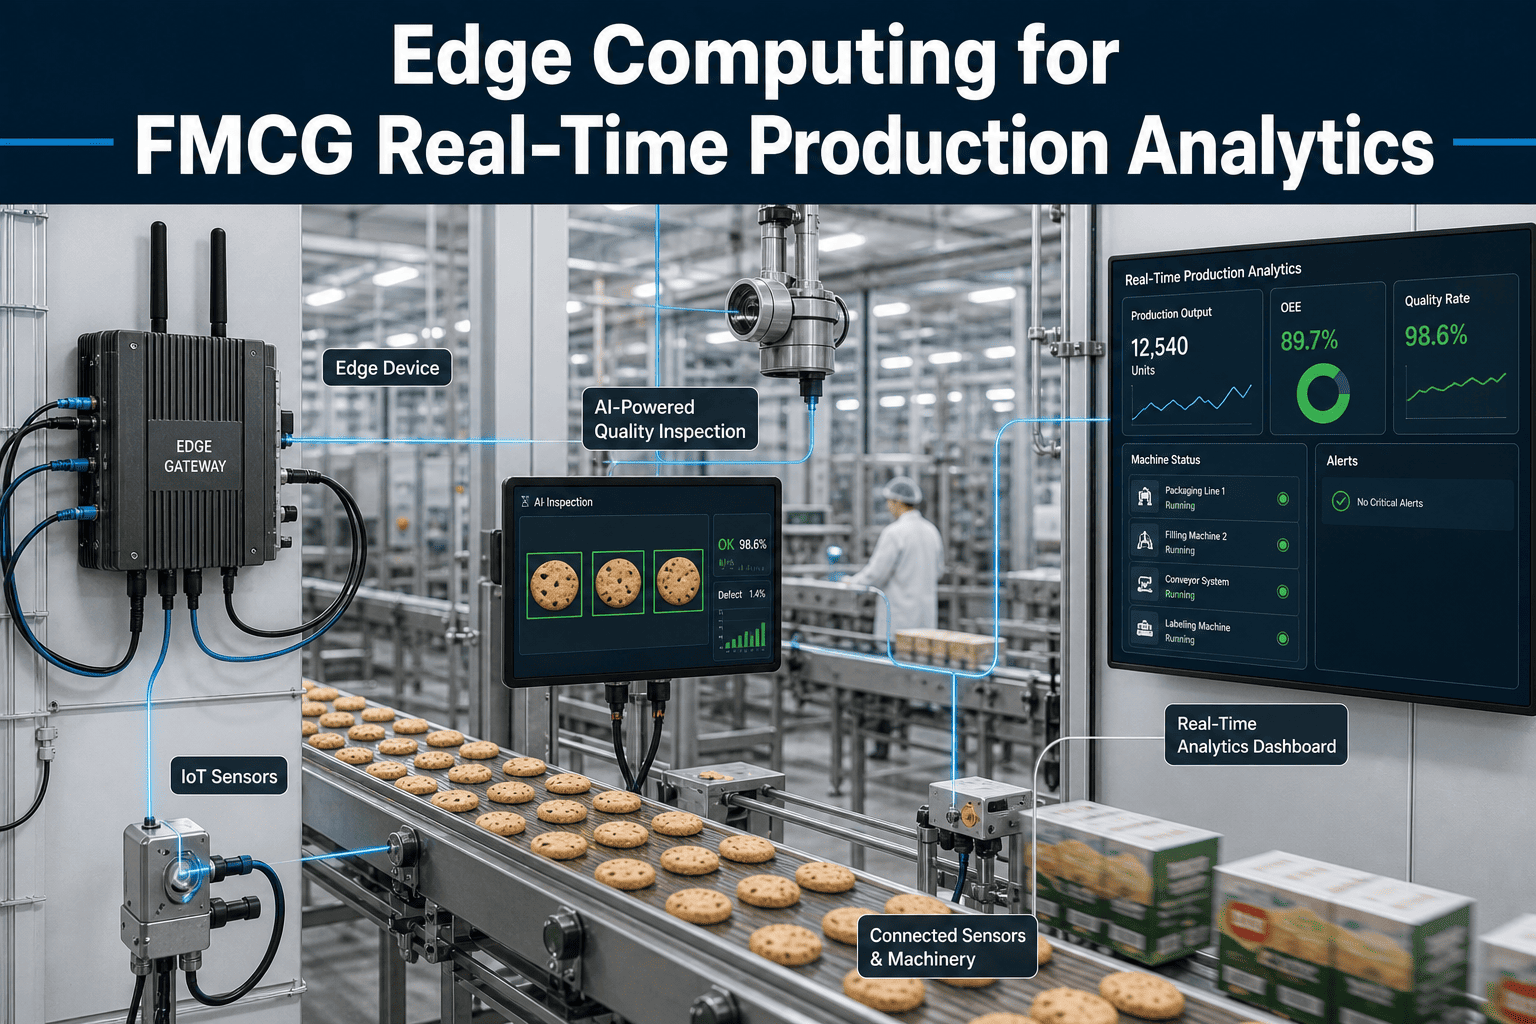
Modern AI analytics platforms connect via standard industrial protocols: OPC-UA, Modbus TCP, MQTT, or direct PLC drivers for major manufacturers (Siemens, Rockwell, Schneider, Beckhoff). Most implementations require no PLC programming changes—the analytics platform reads existing signals (run/stop, speed, counts, fault codes) that your PLCs already generate. An edge gateway device installed in the control cabinet handles protocol conversion and data buffering. Typical integration takes 2–4 days per line with zero production interruption. Plants with existing MES or historian systems can often integrate via API without any hardware additions.
What OEE improvement should we realistically expect in the first year?
FMCG plants deploying AI analytics typically see 12–18 percentage points of OEE improvement in the first 12 months on monitored lines. The first 5–8 points come quickly (within 90 days) from "low-hanging fruit" that was previously invisible: micro-stops with common causes, changeover overruns, and speed losses from operator habits. The next 5–10 points require more structured improvement efforts targeting specific equipment issues and process optimization. Plants starting below 60% OEE often see larger initial gains; those starting above 75% see smaller but higher-value improvements. Each percentage point of OEE on a high-speed FMCG line is worth $150,000–$350,000 annually in throughput value.
How do we handle operator resistance to real-time performance monitoring?
This is the most common implementation concern—and the most predictable to solve. Frame the system as a tool that helps operators succeed, not one that watches them fail. Start by showing operators the data that vindicates their experience: the micro-stops they've been complaining about, the changeover steps that take too long because of equipment issues, the speed losses caused by upstream feeding problems. When operators see the system identifying equipment and process problems rather than blaming individuals, adoption accelerates. The best implementations involve operators in loss categorization setup so they own the definitions. Never rank operators publicly in the first 6 months—focus on line performance and use individual data only for private coaching.
Can AI analytics work on older equipment without modern PLCs?
Yes, though with some adaptation. Older equipment without PLC outputs can be monitored with add-on sensors: photoelectric sensors for count detection, current transformers for run/stop and speed inference, vibration sensors for equipment health. These retrofit sensors connect to IoT edge devices that provide the data feed AI analytics needs. You won't get the same granularity of fault code classification as modern PLC-equipped lines, but you can still capture the core OEE metrics—availability, performance, and quality—which is where 80% of the value comes from. Many plants run a mix of modern and legacy lines on the same analytics platform.
What does an AI OEE analytics system cost for a typical FMCG plant?
Total investment for a multi-line FMCG plant typically ranges from $80,000–$250,000 for hardware, software, and implementation across 8–15 lines. Per-line costs decrease significantly at scale—a single pilot line runs $15,000–25,000, while adding subsequent lines costs $5,000–12,000 each using validated templates. Annual software subscription runs $2,000–5,000 per line. With each OEE percentage point worth $150,000–$350,000 per high-speed line, most plants achieve full payback within 3–6 months of their pilot deployment. The ROI case is strongest on high-speed, high-value lines with frequent changeovers. Book a demo for a customized ROI analysis for your plant.
How does OEE analytics integrate with our CMMS and maintenance planning?
The integration is bidirectional and critical for maximum value. When AI analytics detects equipment degradation affecting OEE—increasing micro-stops from a specific station, rising reject rates correlated with a process parameter drift, or gradual speed decline on a particular machine—it generates a maintenance work order in your CMMS with diagnostic context. The maintenance team sees not just "machine needs attention" but "Station 7 fill head 4 showing 23% more micro-stops this week, correlated with rising vibration on the cam follower—estimated $8,400/week in lost throughput." Conversely, completed maintenance work orders feed back into the analytics system to validate that repairs restored expected performance levels. Sign up free to connect OEE analytics with maintenance workflows.
AI analytics connects to your existing PLCs and SCADA systems to decompose every second of production into actionable data. It finds the micro-stops accumulating invisibly, the changeover phases consuming excess time, the speed losses persisting unnoticed, and the quality patterns no one thought to track—then quantifies each loss in dollars and shows your team exactly where to capture it. Plants typically recover $1.5M–$3.5M per high-speed line in the first year with 12–18 points of OEE improvement.