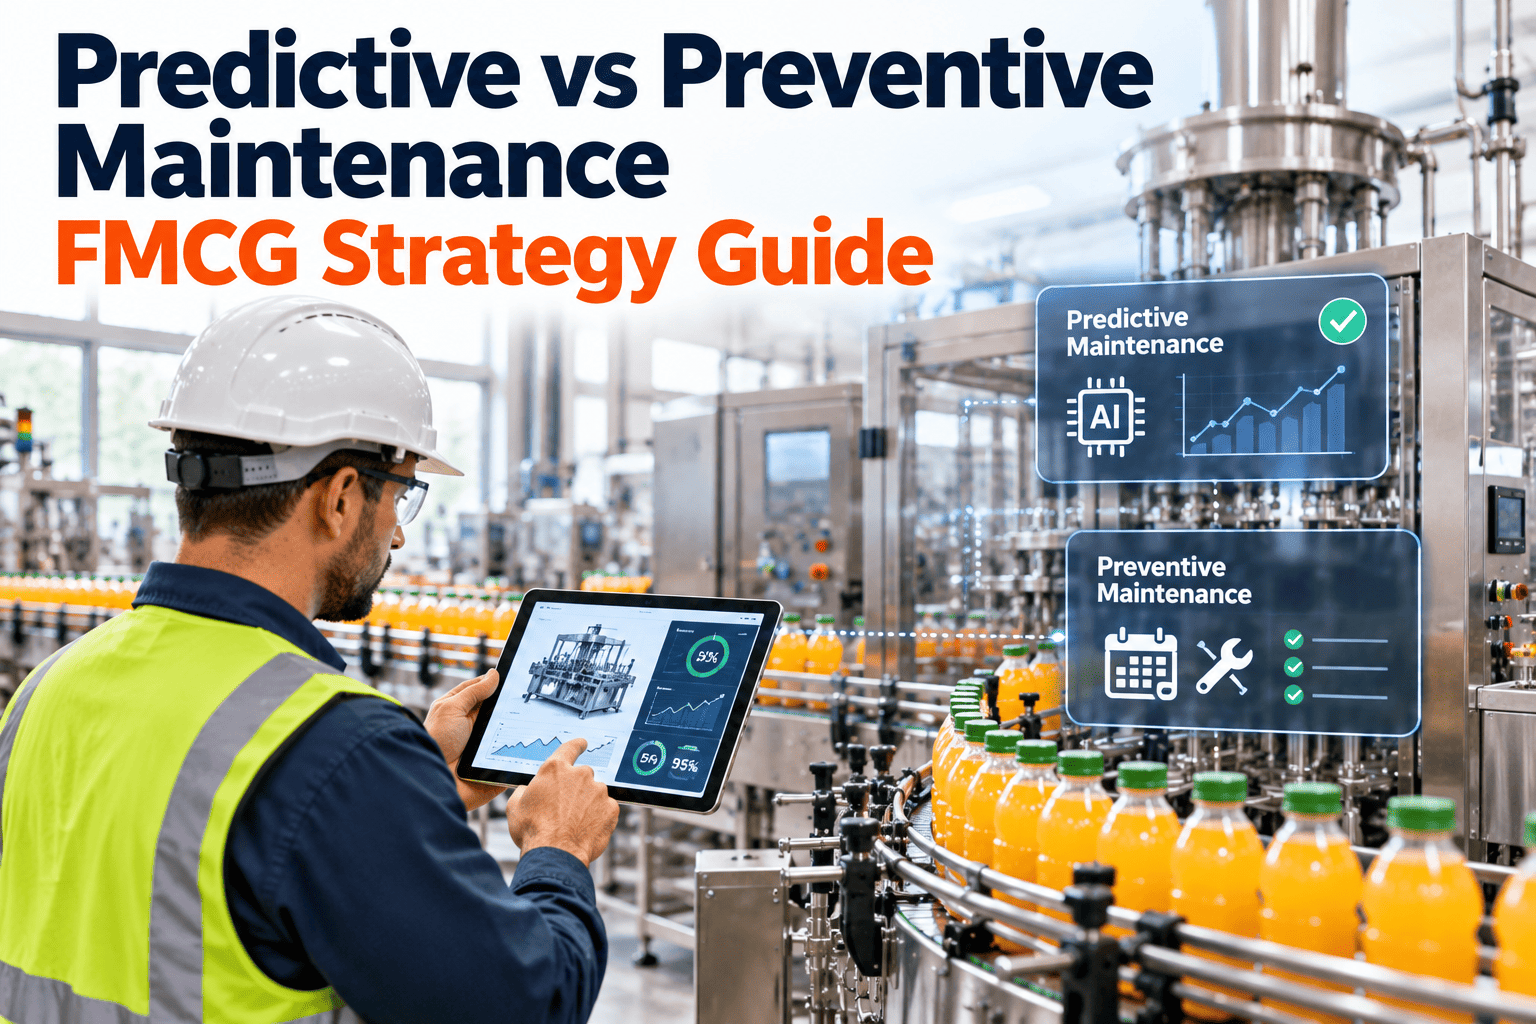
Few maintenance debates are as common as predictive versus preventive. Some plants rush to sensors and analytics before their basic PM routines work, while others keep replacing parts on a calendar long after the data shows they are still healthy. For FMCG plants, where fillers, sealers, labelers and conveyors run at speed with little room for unplanned stops, the answer is rarely one or the other. This guide compares both approaches, explains where each fits and shows how a CMMS such as Oxmaint can run preventive schedules and condition-based triggers in one workflow.
Predictive vs Preventive Maintenance for FMCG Plants: A Strategy Guide
Compare cost, failure coverage and technology needs, then build a maintenance mix that matches each machine on your filling and packaging lines.
- ReactiveFix after failure
- PreventiveTime or usage based
- Condition-BasedAct on measured limits
- PredictiveForecast from trends
Two Strategies, Two Triggers
The core difference is what tells you to act: the calendar or the machine.
Preventive Maintenance
- Triggered by time, running hours or production counts
- Tasks such as lubrication, cleaning, inspection and scheduled replacement
- Works well for wear that is predictable by age or use
- Simple to plan, resource and audit
- Risk of doing work that is not yet needed
Predictive Maintenance
- Triggered by measured condition and trends
- Uses vibration, temperature, current, ultrasound or process data
- Works well when failures give measurable warning
- Needs instruments, data discipline and analysis skills
- Risk of alerts nobody acts on
Condition-based maintenance sits between the two. A technician measuring jaw temperature each week and acting at a defined limit is already working this way, without any special analytics.
Side-by-Side Comparison
| Factor | Preventive | Predictive |
|---|---|---|
| Task trigger | Calendar, hours or output count | Condition limit or trend |
| Data needed | Usage and failure history | Regular measurements with reliable baselines |
| Upfront investment | Low to moderate | Moderate to high, depending on sensors and software |
| Skills required | Planning and standard task execution | Measurement, data interpretation and response planning |
| Failure coverage | Age-related wear and routine care | Failures that develop gradually and show symptoms |
| Main weakness | Misses random failures, can replace healthy parts | Cannot predict sudden failures with no warning |
| Best use | Basic care for all assets | Critical assets where warning is measurable |
The P-F Interval: Why Timing Matters
A failure often develops over time. The period between a detectable warning sign (P) and functional failure (F) is the P-F interval. Condition checks must happen more often than that window.
Healthy
Normal operation with stable readings.
Potential Failure (P)
A symptom is detectable, such as rising bearing vibration or slow jaw heating.
Degrading
The condition worsens. This is the window to plan the repair.
Functional Failure (F)
The machine can no longer meet its performance standard.
If the P-F interval is a few days, monthly checks will miss it. If it is hours, only continuous monitoring or protective alarms are suitable.
Matching Strategy to Failure Pattern
Not all failures behave the same way. Choosing the right approach starts with how each failure mode develops.
Wear That Follows Age or Use
Items like belts, filter elements and some seals degrade with running time. Scheduled replacement or restoration often works when the life is consistent.
Favors preventiveGradual Failure With Warning
Bearings, gearboxes, heating elements and servo drives often show symptoms before failing. Measurement can catch them in time.
Favors predictiveSudden Failure Without Warning
Some electronic or random faults give no usable signal. Spares, redundancy, design changes or run to failure may be the best response.
Neither fits wellCondition Monitoring Methods Used in FMCG Plants
Choose the method for the failure mode, not because a tool is available. Each technique detects different problems.
| Method | Typical targets | What it can reveal | Practical note |
|---|---|---|---|
| Vibration analysis | Motors, gearboxes, pumps, main drives | Bearing wear, misalignment, imbalance, looseness | Needs baselines and trained interpretation |
| Infrared thermography | Electrical cabinets, motors, heater circuits | Hot connections, overloaded circuits, failing components | Must be done under representative load |
| Motor current analysis | Drives and conveyor motors | Overload, mechanical resistance, some electrical faults | Useful where mounting sensors is difficult |
| Ultrasound | Compressed air, bearings, steam traps | Leaks, lubrication issues, early bearing friction | Helpful in noisy production areas |
| Oil analysis | Gearboxes and hydraulics | Wear particles, contamination, lubricant condition | Check food-grade lubricant requirements |
| Process data trends | Fillers, sealers, labelers | Jaw temperature drift, fill variance, servo torque change | Often available from existing controls |
Process data is often the easiest place to start. Many machines already record temperatures, pressures and torque values that are not trended.
Where Each Approach Fits on the Line
| Asset | Preventive focus | Predictive or condition-based focus |
|---|---|---|
| Filler | Seal and O-ring replacement, cleaning, lubrication | Fill variance trend, flow meter drift, servo or pump condition |
| Sealer | Tape replacement, alignment, cleaning | Jaw temperature trend, heater response, pneumatic pressure |
| Labeler | Cleaning, roller and wiper checks | Sensor signal quality, drive load trend |
| Case packer | Adjustments, lubrication, wear part changes | Motor current, cycle time drift, vacuum performance |
| Conveyor | Chain lubrication, guide settings, cleaning | Chain elongation, gearbox vibration, motor temperature |
Run Preventive Schedules and Condition Triggers Together
Plan PM, record inspection readings and generate work orders from condition limits in one maintenance platform.
Comparing Cost Fairly
Neither approach is automatically cheaper. Compare the full cost, including the cost of what each one fails to prevent.
Preventive Cost Elements
- Technician time for routine tasks
- Parts replaced before end of useful life
- Planned downtime for scheduled work
- Unplanned failures between intervals
- Risk of errors introduced during intrusive tasks
Predictive Cost Elements
- Sensors, instruments and software
- Training and analysis time
- Installation and wiring effort
- False alarms and unneeded investigations
- Missed failures that give no warning
A Decision Path for Each Failure Mode
- 1
How serious is the consequence?
Failures affecting safety, product quality or the whole line justify more attention than minor stops.
- 2
Does the failure show a warning?
If a measurable symptom appears before failure, condition-based methods are possible.
- 3
Is the P-F interval long enough?
There must be time to detect the symptom and plan the repair.
- 4
Is the wear age-related?
If life is consistent, a scheduled task may be simpler and cheaper.
- 5
Does the task cost less than the failure?
If not, consider redesign, spares or run to failure.
Building the Right Mix in Stages
Predictive methods work best on top of solid preventive basics. Add capability step by step.
- Stage 1
Fix the Preventive Basics
Clean up PM tasks, remove those with no purpose and make sure completion is recorded.
- Stage 2
Add Manual Condition Checks
Introduce measurements with defined limits on critical machines.
- Stage 3
Use Existing Machine Data
Trend temperatures, torque and fill data already available from controls.
- Stage 4
Add Targeted Sensors
Install monitoring where failure is costly and warning is measurable.
- Stage 5
Review and Adjust
Compare predictions with findings and refine thresholds and intervals.
What Predictive Maintenance Needs Before It Works
- A clean asset register. Readings must be tied to the correct machine and component.
- Baselines and limits. Know what normal looks like and agree alert and action thresholds.
- A response workflow. An alert must create a work order with an owner and a due date.
- Planning capacity. Parts, skills and downtime must be available to act on early warnings.
- Feedback from findings. Record what was found when the part was opened, so thresholds improve.
A warning that never becomes a planned repair has no value. The gap is usually workflow, not technology.
How a CMMS Connects Both Strategies
Preventive Scheduling
Create calendar, running-hour or production-count PM for every asset.
Inspection Readings
Record temperatures, pressures and measurements on mobile checklists.
Condition-Based Work Orders
Raise tasks when readings pass defined limits.
Parts and Planning
Reserve spares and schedule repairs inside planned windows.
Reporting
Compare PM findings, condition alerts and failures by asset.
Teams can book a demo to see how inspection readings generate follow-up work orders before deciding how far to extend monitoring.
Before and After: Moving From Calendar-Only to a Balanced Mix
Calendar-Only PM
- All parts replaced at fixed intervals
- Gradual faults found only when they stop the line
- Technicians busy with low-value tasks
- Limited evidence for interval choices
Balanced Maintenance Mix
- Scheduled tasks for age-related wear
- Condition checks for gradual failures
- Critical assets monitored more closely
- Intervals adjusted using findings
Setting Limits for Condition-Based Triggers
A reading is only useful if everyone agrees what it means. Define limits in layers so action matches severity.
- 1
Baseline
Record normal values for each asset after a repair or commissioning, under typical load and product.
- 2
Alert Level
Set a level that prompts a closer look, such as a repeat measurement or a note on the next PM.
- 3
Action Level
Set a level that creates a planned work order with parts reserved and a target date.
- 4
Stop Level
Define when the machine should not continue running, particularly for safety or product risk.
Use supplier guidance, recorded findings and standards as inputs, and revise limits when inspections show they are too tight or too loose.
Food Plant Constraints on Monitoring
Packaging and filling areas bring requirements that general industrial guidance may not mention.
- Washdown and hygiene. Sensors and cables must withstand cleaning chemicals and water, and should not create places for residue to collect.
- Foreign matter control. Mounting hardware and cable ties need to follow site rules to avoid contamination risk.
- Lubricant selection. Oil sampling and greasing need food-grade products where incidental contact is possible.
- Access during production. Some readings can only be taken safely during stops, which affects the interval you can achieve.
- Records for audits. Condition checks and the actions taken should be easy to retrieve by asset and date.
Example: A Sealer Handled Three Ways
This hypothetical comparison shows how the same failure mode is managed under each strategy. It is an illustration, not measured data.
Reactive
The heater fails during a run. The line stops, a technician diagnoses the fault and the part is fetched. Output and some packs are lost.
Failure firstPreventive
The heater is replaced at a set number of running hours. Most failures are avoided, but some replaced heaters could have lasted longer.
Interval basedCondition-Based
Weekly jaw temperature readings trend away from the setpoint. A work order is raised at the action level and the heater is replaced at a planned stop.
Data drivenWho Is Responsible for What
Operators
Perform simple checks, report abnormal sounds, leaks or product defects and follow cleaning standards.
Technicians
Take readings, perform PM and record findings accurately on the work order.
Reliability Engineer
Chooses methods, sets limits and reviews whether tasks are effective.
Planner
Turns alerts into scheduled work with parts and downtime arranged.
Deciding Where to Start on Your Lines
- List your top downtime causes. Use recent work orders and line stoppage records to find the failures that matter most.
- Sort them by failure pattern. Mark which are age-related, which show warning and which strike suddenly.
- Check existing data. Find out which temperatures, currents and counts your machines already record.
- Pilot on one asset. Choose a critical filler or sealer, set limits and run for several cycles before expanding.
- Review results with the team. Keep what finds real problems and retire what does not.
Reviewing Whether a Task Earns Its Place
Every preventive or condition-based task should justify the time it takes. Review completed work orders on a regular schedule and ask a few direct questions.
- Does it find anything? Tasks that never produce findings may have intervals that are too short or methods that miss the problem.
- Does it prevent a known failure mode? Link each task to a failure mode, and remove tasks with no clear purpose.
- Is it intrusive? Dismantling healthy equipment can introduce errors, so prefer non-intrusive checks where they work.
- Is the interval supported by data? Adjust it using recorded wear, failure history and the P-F interval.
Common Mistakes
- Buying sensors before fixing PM. Data from machines with poor basic care often shows problems that routine work would have prevented.
- Monitoring everything. Focus on critical assets and failure modes with measurable warning.
- Setting thresholds by guess. Use baselines, supplier guidance and recorded findings.
- Ignoring the people side. Technicians need training and trust in alerts.
- Not measuring results. Track avoided failures, findings and cost, not just the number of alerts.
KPIs to Judge the Maintenance Mix
| KPI | What it shows | Strategy link |
|---|---|---|
| PM compliance | Whether scheduled work is completed | Preventive basics |
| Findings per inspection | Whether checks detect real problems | Task usefulness |
| Planned versus unplanned work | Shift away from reactive repairs | Both strategies |
| Failures caught before stopping the line | Value of early warning | Predictive and condition-based |
| Alerts leading to action | Quality of thresholds and workflow | Predictive |
| MTBF and downtime by failure mode | Reliability improvement over time | Overall results |
Predictive vs Preventive FAQs
Is predictive maintenance better than preventive?
Not universally. Each suits different failure modes, and most plants need both.
Do we need sensors to start?
No. Manual readings and existing machine data can begin a condition-based program.
Which FMCG assets suit predictive methods first?
Critical rotating equipment and process trends on fillers and sealers are common starts.
Can a CMMS handle both?
Yes. Oxmaint supports PM schedules, inspections and work orders together.
How do we choose intervals?
Use failure history, P-F intervals and inspection findings. Ask Oxmaint for a walkthrough.
Build a Maintenance Mix Based on How Your Machines Fail
Combine solid preventive routines with condition-based triggers where they pay off, and manage both from one maintenance system.