A cereal manufacturer in Michigan spent $2.4 million installing two new palletizing robots and a vision-guided case packer on Line 7 — and the project ran 11 weeks behind schedule. The robots arrived, were bolted to the floor, and then the integration problems began: the case packer's reject conveyor interfered with the palletizer's pick zone by 140 millimeters, the cycle time calculations assumed instantaneous product infeed that never materialized on the actual line, and the safety scanner zones overlapped with an existing AGV path that nobody had modeled. Each problem required mechanical rework, reprogramming, and revalidation on the live production floor — burning $18,000 per day in lost output while engineers troubleshot issues that would have been visible in 30 minutes of simulation. A digital twin of Line 7 — built before a single bolt was turned — would have exposed the spatial conflict, validated the cycle time against real infeed rates, and tested the safety zone interaction with the AGV fleet in a virtual environment where mistakes cost nothing. Oxmaint tracks simulation-to-commissioning change logs for every robotic cell — Book a Demo.
68%
Reduction in on-floor commissioning time with virtual pre-validation
$0
Cost of catching a spatial conflict in simulation vs. $18K/day on the live line
92%
Of integration issues detectable before physical installation begins
3–5×
More layout alternatives tested in simulation vs. physical trial-and-error
Why FMCG Lines Fail During Physical Commissioning
FMCG production lines are dense, fast, and interdependent — a palletizer that runs perfectly in isolation fails the moment it connects to a case packer running a different SKU pattern, an infeed conveyor with variable accumulation, and an AGV fleet with its own traffic logic. Traditional commissioning discovers these interactions on the production floor, where every hour of debugging is an hour of lost output. Simulation and digital twin technology moves the discovery phase into a virtual environment where every interaction can be tested, measured, and optimized before anything is built. Plants that track simulation baselines and commissioning deviations in Oxmaint — Sign Up Free maintain the link between what was designed and what was built — the gap where most performance problems hide.
Physical Commissioning Failures
Spatial conflicts between robots, conveyors, and safety zones discovered after installation
Cycle time shortfalls from idealized motion profiles that ignore real infeed variability
Safety scanner overlap with AGV paths, forklift zones, or adjacent cell envelopes
Changeover sequences that work on paper but create deadlock conditions on the physical line
What Simulation Catches First
Reach envelope violations and collision paths visible in 3D kinematic models before fabrication
Throughput bottlenecks from accumulation gaps, reject handling, and infeed variability
Safety zone interactions tested against every vehicle path and operator access scenario
Changeover timing validated across all SKU transitions before the first product runs
Stop discovering integration problems on your production floor. Oxmaint links simulation models to asset records so every design decision is tracked, validated, and auditable through commissioning and beyond.
Sign Up
Digital Twin Architecture for FMCG Robotic Lines
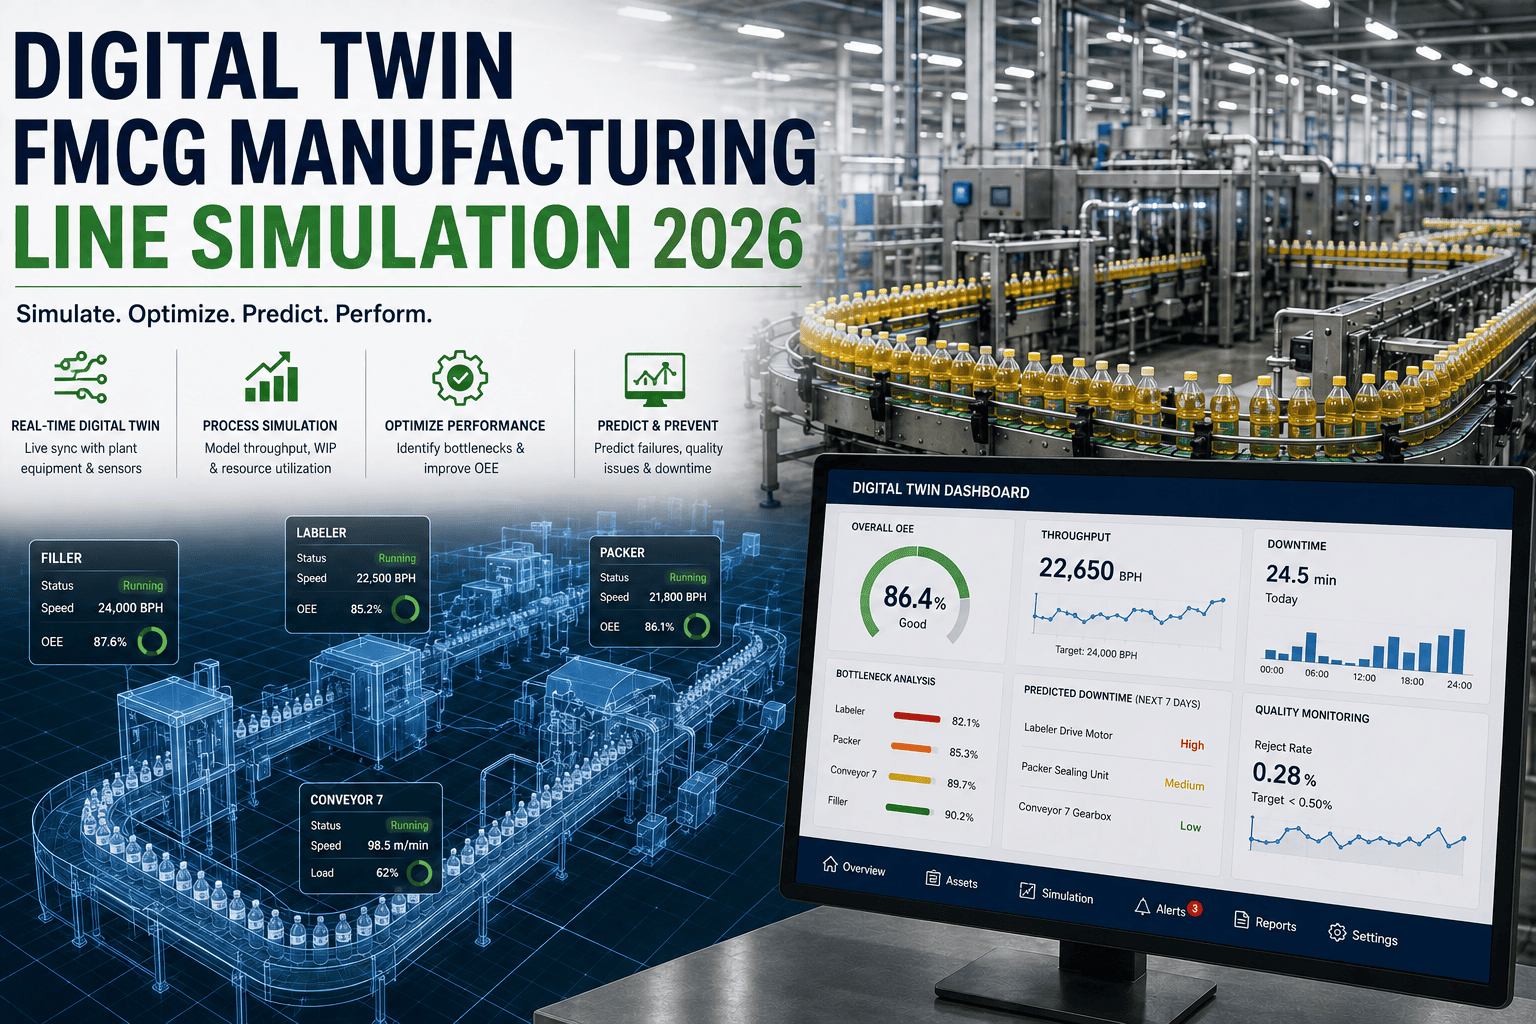
A digital twin of an FMCG robotic line is not a single model — it is a layered architecture where each layer answers different questions at different project phases. Understanding what each layer does prevents the common mistake of building a detailed 3D visualization that looks impressive but cannot predict throughput, validate safety zones, or optimize changeover sequences.
3D Kinematic Model
Robot reach envelopes | Collision detection | Spatial clearance validation
Validates that every robot can reach every pick and place point without colliding with adjacent equipment, conveyors, or structural columns. Catches the 140mm spatial conflicts that cost weeks of rework when discovered during physical installation. Built from CAD models of every component in the cell.
Discrete Event Simulation (DES)
Throughput modeling | Bottleneck detection | Buffer sizing | Variability analysis
Models the flow of products through the line as discrete events — arrivals, processing, queuing, blocking, starving. Reveals throughput bottlenecks, optimal buffer sizes, and the impact of variability (infeed gaps, reject rates, changeover duration) on actual vs. theoretical output. The layer that predicts real OEE.
Safety Zone Simulation
Scanner field validation | AGV interaction | Operator access modeling
Tests safety scanner configurations against every operational scenario — robot at full speed, operator entering from any access point, AGV passing through adjacent zones, maintenance access with guards open. Prevents the safety rework that delays 40% of robotic cell commissioning projects in FMCG.
Virtual Commissioning (vPLC)
PLC logic testing | HMI validation | Signal-level I/O verification
Connects actual PLC code to the simulation model through hardware-in-the-loop or software-in-the-loop testing. Every I/O signal, interlock, and sequence runs against the virtual plant before the physical plant is powered on. Catches logic errors that would otherwise appear as mysterious faults during startup.
Simulation Use Cases Across FMCG Line Types
Different FMCG line configurations demand different simulation approaches. A high-speed beverage filling line operating at 1,200 bottles per minute has fundamentally different bottleneck patterns than a mixed-SKU snack packaging line running 15 changeovers per shift. The simulation model must match the operational reality — not just the equipment specifications.
Virtual Commissioning: Testing PLC Logic Before Power-On
Virtual commissioning is the highest-value simulation layer for FMCG robotic lines because it tests the actual control logic — not an abstraction of it — against a physics-accurate model of the plant. Every PLC program, HMI screen, safety interlock, and robot motion sequence runs in the virtual environment exactly as it will on the physical floor. Oxmaint tracks virtual commissioning test results and change requests per cell — Book a Demo.
1
Build Virtual Plant Model
Import 3D CAD geometry for every component — robots, conveyors, guarding, sensors, tooling. Assign kinematic properties (joint limits, speeds, accelerations) and physics behaviors (gravity, friction, collision). Model accuracy here determines virtual commissioning accuracy downstream.
2
Connect PLC Code via SiL or HiL
Software-in-the-loop (SiL) runs PLC code on a virtual controller emulator. Hardware-in-the-loop (HiL) runs code on the actual PLC hardware connected to the simulation via I/O mapping. HiL provides higher fidelity — catching timing issues that SiL can miss — but requires the physical PLC hardware on-site.
3
Run Scenario Test Matrix
Execute every operational scenario: normal production at target speed, each SKU changeover sequence, fault recovery from every anticipated failure mode, safety system response to every entry point, and emergency stop from every operating state. Log pass/fail results per scenario in the CMMS as commissioning test records.
4
Resolve Issues in Virtual Environment
Every failed test becomes a change request — PLC logic correction, robot path adjustment, sensor repositioning, interlock timing change. Resolve and retest in the virtual environment at zero cost. Track every change in the CMMS with before/after documentation for audit traceability.
5
Deploy to Physical Plant with Confidence
Transfer validated PLC programs, robot paths, and configuration files to the physical equipment. On-floor commissioning focuses on sensor calibration, mechanical alignment, and production verification — not logic debugging. Typical commissioning time reduction: 50–68% versus traditional approach.
What-If Analysis: Optimizing Before You Build
Simulation's second major value — after virtual commissioning — is the ability to run what-if scenarios that would be impossible, dangerous, or prohibitively expensive on a live production line. Each scenario tests a different design decision and produces quantified KPI predictions that inform capital investment, layout changes, and operational strategy.
Add a Second Robot — Does adding a second palletizer to Line 3 actually increase throughput, or does the merge conveyor become the new bottleneck? Simulation answers in hours; physical trial takes weeks and $200K+ in equipment rental.
Relocate the Case Packer — Moving the case packer 2 meters upstream creates space for a new labeler. Simulation validates that the shorter conveyor gap does not cause product collisions at full speed before any concrete is cut.
Change the Buffer Strategy — FIFO accumulation table vs. LIFO spiral buffer vs. dynamic bypass. Each buffer type changes line behavior during upstream stoppages. DES models predict which strategy sustains the highest OEE for your specific stoppage profile.
Test a New Gripper Design — Virtual pick-place trials with new gripper geometry validate cycle time, reach, and product handling before ordering the physical tooling. Catches design flaws at the CAD stage.
Add a Third Shift — What throughput does a third shift actually deliver after accounting for changeover accumulation, PM windows, and operator handoff time? Simulation models the real number, not the theoretical maximum.
Change the SKU Sequence — Running SKU-A before SKU-B requires a 12-minute changeover. Running SKU-B before SKU-A takes 6 minutes. Simulation optimizes the daily production sequence across all SKUs to minimize total changeover time.
Increase Line Speed 10% — Raising belt speed from 100 to 110 units/minute. Will the vision system still catch defects? Will the reject diverter actuate in time? Will the case packer maintain pattern accuracy? Simulation tests all three before any parameter is changed on the floor.
Simulate Equipment Failure — What happens when the labeler stops for 3 minutes? How much accumulation is needed to prevent upstream starvation? At what stoppage duration does the filler need to slow down? DES provides exact thresholds for every failure scenario.
Test Every Change in Simulation. Deploy Only What Works.
Oxmaint connects simulation models to your physical asset records — tracking which design was validated, which parameters were tested, and which changes were approved. When the simulated line becomes the physical line, every decision has a documented trail from virtual test to production floor verification.
Digital Twin for Ongoing Operations: Beyond Commissioning
The digital twin's value does not end when the line goes live. A continuously updated twin — fed with real production data from the CMMS, MES, and PLC — becomes an operational optimization tool that answers questions about the running line that would be impossible to test in production without risk. Oxmaint feeds real maintenance and downtime data into digital twin models — Sign Up Free.
Simulation vs. Physical Commissioning: Cost and Time Comparison
The economic case for simulation is straightforward: every problem found in the virtual environment costs nothing to fix. The same problem found during physical commissioning costs production downtime, mechanical rework, reprogramming labor, and schedule delays. The comparison below uses actual project data from FMCG robotic cell installations.
Physical Only
Metric
Simulation + Physical
4–8 weeks on-floor commissioning
Timeline
1.5–3 weeks on-floor after virtual validation
$12,000–$25,000/day in lost production
Downtime Cost
50–68% reduction in production-impacting days
Issues found sequentially — fix one, discover next
Problem Discovery
92% of issues found in parallel before installation
1–3 layout alternatives tested (time-limited)
Design Iterations
10–50+ alternatives tested in simulation hours
PLC logic debugged on live equipment
Control Validation
PLC logic validated before equipment is powered on
$150K–$400K
typical commissioning overrun cost
3–8× ROI
on simulation investment from avoided overruns
Every commissioning delay was a simulation gap. Oxmaint tracks what was simulated, what changed during installation, and what needs re-validation — closing the loop between digital design and physical reality.
Book a Demo
Implementation: Building Your First FMCG Digital Twin
Building a digital twin of an FMCG robotic line is a phased process that starts with the highest-value simulation layer and expands as the organization builds capability. Most FMCG plants achieve measurable ROI from Phase 1 alone — discrete event simulation of a single bottleneck line — and expand to full virtual commissioning as confidence and skill develop. Oxmaint manages simulation project milestones and commissioning validation records — Book a Demo.
Phase 1: Weeks 1–4
Single-Line DES Model
Select highest-value line (worst OEE or upcoming project)
Build discrete event model from PLC cycle times and stoppage logs
Validate model against 30 days of actual production data from CMMS
Phase 2: Weeks 5–10
3D Kinematic + Safety Validation
Import equipment CAD models into 3D simulation environment
Validate robot reach envelopes, collision paths, and safety zones
Test all operator access scenarios and AGV interactions
Phase 3: Weeks 11–16
Virtual Commissioning
Connect PLC code to simulation via SiL or HiL interface
Execute full scenario test matrix with pass/fail documentation
Resolve all logic issues in virtual environment before physical startup
Phase 4: Ongoing
Operational Twin
Feed live CMMS data (OEE, stoppages, PM records) into twin model
Run what-if scenarios for new SKUs, speed changes, and layout mods
Validate every proposed change in simulation before floor deployment
Build It Virtually. Validate It Digitally. Deploy It Once.
Oxmaint connects your digital twin to the physical maintenance reality — tracking which simulation model matches which production line, logging every design-to-floor deviation as a change request, and ensuring that the optimized virtual line becomes the optimized physical line. One platform from simulation baseline to daily operational performance.
Frequently Asked Questions
What is the difference between simulation and a digital twin in FMCG?
Simulation is a model used for a specific analysis — testing a layout, validating cycle times, or optimizing changeover sequences. It runs scenarios and produces predictions but does not stay connected to the physical line after the analysis is complete. A digital twin is a continuously updated simulation that receives real-time data from the physical line (OEE, cycle times, stoppages, maintenance records) and reflects the current state of the equipment. The twin enables ongoing optimization, predictive bottleneck detection, and what-if analysis on the running line — not just during the design phase. Most FMCG plants start with project-based simulation and evolve to operational digital twins as they build data infrastructure and modeling capability.
How accurate are simulation predictions for FMCG line throughput?
Properly calibrated discrete event simulation models predict FMCG line throughput within 3–8% of actual production when validated against real operational data. Accuracy depends on input data quality — cycle times measured from PLC logs rather than equipment specifications, actual stoppage frequencies and durations from CMMS records, and measured changeover times rather than estimates. Models using specification-sheet data without real-world calibration typically achieve only 15–25% accuracy, which is insufficient for investment decisions. The 30-day validation period against actual production data is essential — it calibrates the model to your specific operating conditions, product mix, and staffing patterns.
What software tools are used for FMCG robotic simulation?
The tool selection depends on the simulation layer. For discrete event simulation: Siemens Plant Simulation, FlexSim, AnyLogic, and Simul8 are the most common in FMCG. For 3D kinematic and robot simulation: RoboDK, Siemens Process Simulate, Delmia, and ABB RobotStudio (for ABB robots). For virtual commissioning: Siemens SIMIT, Emulate3D (now Rockwell), and Visual Components with PLC connectivity. Some platforms combine multiple layers — Siemens Tecnomatix covers DES, 3D, and virtual commissioning in one environment. The right tool depends on your robot brands, PLC platform, and which simulation layers deliver the most value for your specific operations.
How does Oxmaint connect to digital twin models?
Oxmaint serves as the operational data backbone that feeds digital twin models and receives validated outputs. Real production data — OEE metrics, equipment stoppage logs, PM completion records, changeover durations, and failure histories — exports from Oxmaint via API to the simulation platform for model calibration and ongoing twin updates. In the reverse direction, simulation-validated parameters (target cycle times, optimized changeover sequences, new pallet patterns) are recorded in Oxmaint as asset configuration baselines. Every change between the simulated design and the physical deployment is logged as a tracked change request with justification, approval, and re-validation documentation.
What is the typical ROI timeline for FMCG digital twin investment?
ROI depends on the simulation scope and the problems it prevents. For project-based virtual commissioning of a single robotic cell ($30,000–$80,000 simulation investment), ROI is typically achieved on the first project through avoided commissioning overruns ($150,000–$400,000 in saved downtime and rework). For operational digital twins of existing lines, ROI comes from bottleneck identification (5–15% OEE improvement), optimized maintenance scheduling (reduced production-impacting PM), and faster new SKU introduction (days instead of weeks). Most FMCG plants see 3–8× return on simulation investment within the first year, with compounding returns as models are reused across multiple projects and the organization builds simulation capability.