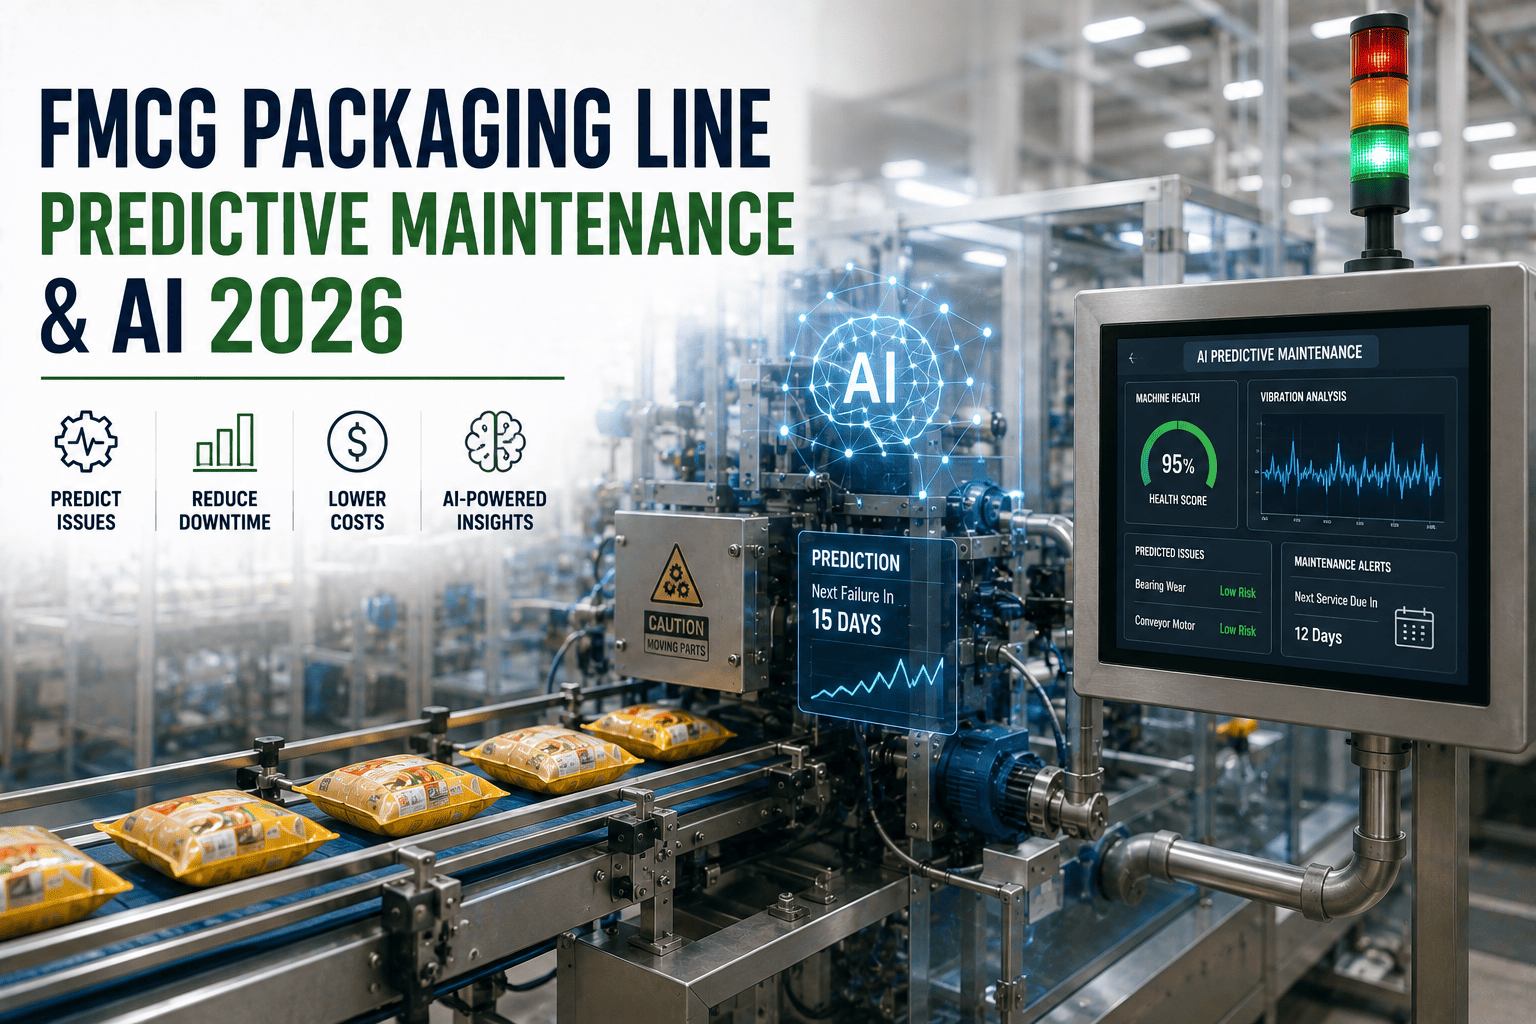
For high-speed FMCG packaging lines, an unplanned filler stop can scrap 8,000 units in a single shift and push OEE below the 65% floor that most CPG plants use as their break-even line. Predictive maintenance powered by AI shifts the conversation from "which bearing failed" to "which bearing will fail in the next 240 hours," giving maintenance teams a 5–14 day runway to act. Plants deploying condition-based CMMS workflows on filler drives, heat-seal stations and capping turrets are reporting 18–32% micro-stop reduction within the first quarter. To begin moving from calendar-based PMs to condition-based AI maintenance on your own line, you can Start Free Trial and connect your first asset in under an hour.
What if your next packaging line failure announced itself 240 hours in advance?
From bearing wear on filler cam drives to heat-seal degradation on sachet lines, AI-driven condition monitoring is converting 3 AM breakdowns into planned 20-minute interventions — at a fraction of the scrap, overtime and rebuild cost.
Why calendar-based PM is quietly draining FMCG margin
A typical mid-tier FMCG plant running three packaging lines on time-based PM loses $1.2M–$2.1M annually to preventable failures, premature parts swaps and unplanned micro-stops.
On a 180-asset packaging plant spending roughly $42K per year on bearings and seals alone, switching to condition-based replacement cut consumables spend by 27% in year one — not because we bought fewer parts, but because we stopped throwing away parts that still worked.
Matching failure modes to the right sensor signal
No single sensor covers every packaging failure. The table below maps the four dominant FMCG failure families to their highest-confidence detection technique and the lead time each delivers.
| Failure Mode | Dominant Signal | Sensor Class | Forecast Horizon | Confidence |
|---|---|---|---|---|
| Filler bearing wear | RMS velocity, envelope acceleration | Tri-axial vibration (10 Hz–10 kHz) | 120–280 hrs | High |
| Heat-seal degradation | Temperature drift, jaw pressure variance | Thermal imaging + load cell | 6–24 hrs | Medium |
| Capping spindle misalignment | Torque signature deviation | Smart torque transducer | 48–96 hrs | High |
| Conveyor motor thermal stress | Winding temperature rise, current harmonics | IR thermography + current clamp | 72–200 hrs | High |
| Lubricant breakdown | Oil debris particle count, viscosity delta | Inline oil condition sensor | 200–500 hrs | Medium |
From raw sensor stream to a work order the CMMS actually trusts
The model layer is where most PdM pilots stall. The path below is the integration sequence that moves a packaging line from disconnected dashboards to auto-generated, priority-ranked work orders inside the CMMS.
Edge gateway ingests vibration, thermal and torque signals at 1–10 kHz
Each packaging asset gets a 4–8 channel edge node. Sampling rate is set per failure mode — bearings need high-rate envelope data, seals need slower but thermally-stable readings. The gateway buffers 72 hours locally to survive network drops.
RMS, crest factor, FFT bands and thermal gradients extracted per asset class
Rather than feeding raw waveforms, the pipeline computes 14–22 physics-aligned features per asset. Filler cam bearings track FFT bands tied to inner-race and outer-race defect frequencies; heat-seal jaws track a 5-minute rolling thermal gradient.
Hybrid model fuses ISO 10816 thresholds with a gradient-boosted anomaly classifier
A rules layer catches gross threshold breaches instantly; the ML layer catches the slow drift that rules miss. The model outputs a remaining-useful-life estimate in hours plus a confidence band, retrained weekly on the plant's own failure history.
Auto-generated work order lands in the CMMS with priority, parts list and window
When forecast confidence exceeds 78%, the system opens a work order tagged with the predicted failure window, required parts from BOM, and a recommended intervention slot during the next planned changeover — turning PdM insight into a maintenance action, not just an alert.
The payback math for an AI-enabled packaging line
Use this formula structure to build the business case for a single high-speed line. Numbers below reflect a 300 bpm beverage filler running 16 hours per day, 5 days per week.
| ROI Component | Baseline (Calendar PM) | With AI PdM | Annual Delta |
|---|---|---|---|
| Unplanned downtime (hrs/yr) | 186 | 54 | −132 hrs |
| Scrap from restart & seal failures | $340K | $96K | +$244K |
| Premature bearing/seal replacement | $42K | $31K | +$11K |
| Overtime for emergency repairs | $58K | $19K | +$39K |
| Sensor + AI platform (amortized) | — | −$28K | −$28K |
| Net annual savings | — | — | +$266K |
At $266K net annual savings against a $48K–$62K first-year deployment cost, the typical single-line payback lands between 2.2 and 2.8 months — well inside a single fiscal quarter.
From calendar-based to condition-based in 90 days
This is the deployment path FMCG plants use to move from PM-by-calendar to condition-based maintenance without halting production or ripping out existing CMMS infrastructure.
Asset criticality ranking & sensor placement audit
Rank the 15–25% of assets driving 80% of downtime. Map existing CMMS assets to physical locations, confirm BOM completeness, and install vibration + thermal sensors on the top 8–12 critical machines.
Baseline learning & threshold tuning against live production
The model learns each asset's normal signature across all changeover states and product SKUs. Engineers validate that baseline drift reflects wear, not recipe changes. False-positive rate target: under 12% before enabling auto-work-orders.
Auto-work-order activation & KPI dashboard go-live
Forecast-to-work-order automation switches on for the highest-confidence assets. The maintenance team shifts from daily inspection rounds to exception-driven interventions. OEE, MTBF and micro-stop dashboards go live for plant leadership.
Reduction in sub-2-minute stoppages within first quarter of activation
Faster format changes via pre-flagged part conditions and predictive tooling swaps
Mean time between failures on monitored rotating assets by month six
Stop scheduling failures. Start forecasting them.
See how an AI-enabled CMMS turns your packaging line's vibration and thermal data into 240-hour failure forecasts and auto-generated work orders.
FMCG predictive maintenance, answered
How long does it take to deploy predictive maintenance on an existing FMCG packaging line?
A typical single-line deployment runs 60–90 days end to end. Month one covers asset criticality ranking and sensor installation on 8–12 machines; month two is baseline learning and threshold tuning against live production; month three activates auto-work-orders. Plants with an existing CMMS and clean asset hierarchy can compress this to 6 weeks. To map your own timeline, Book a Demo with our deployment team.
Which packaging assets deliver the fastest ROI from AI-based PdM?
Rotating assets with high scrap-on-failure cost deliver the quickest payback — filler cam bearings, capping spindles, and heat-seal drive motors top the list. A single avoided filler bearing seizure on a 300 bpm line saves $18K–$26K in scrap, overtime and rebuild labor, which is why these assets are typically sensorized first.
Do we need to replace our existing CMMS to use AI predictive maintenance?
No. The AI model layer sits between your sensors and your CMMS, pushing forecast-based work orders through a standard integration. Most modern CMMS platforms accept work orders via REST API or CSV import. If your CMMS lacks an open API, OxMaint includes a native CMMS module — you can Start Free Trial and evaluate both paths in parallel.
What sensor density is realistic for a mid-tier FMCG plant?
Plan for 4–8 sensing channels per critical asset: typically two tri-axial vibration sensors, one thermal camera or IR sensor per heat-seal station, and one torque or current transducer per drive. For a 3-line plant with 15 critical assets, that lands at roughly 90–120 channels — a $28K–$45K sensor investment amortized over 3–5 years.
How accurate are the failure forecasts, and what happens when the model is wrong?
On well-instrumented rotating assets, forecast horizons of 120–280 hours carry 78–88% confidence. When confidence drops below the activation threshold, the system downgrades to an advisory alert rather than auto-creating a work order, so false positives surface as review items — not unplanned interventions. Plants typically see false-positive rates fall below 8% by month four as the model retrains on site-specific failure history.
Move your packaging line from reactive to predictive in one quarter
Connect your first asset, see your first 240-hour forecast, and let auto-generated work orders replace your calendar-based PMs.
Free 14-day trial · No credit card