A VP of Operations at a mid-sized food plant in Wisconsin walked into a capex meeting to request $340,000 for predictive maintenance. The CFO asked one question — "what do we get back, and when?" — and the project was tabled for eight months. She returned with an $1.2M annual return, a 4.1-month payback and the project was approved in the same meeting. This is the financial model every food plant CFO will demand in 2026. You can book a demo to see an ROI dashboard modelled on your own line data, or start a free trial to build your 12-month baseline today.
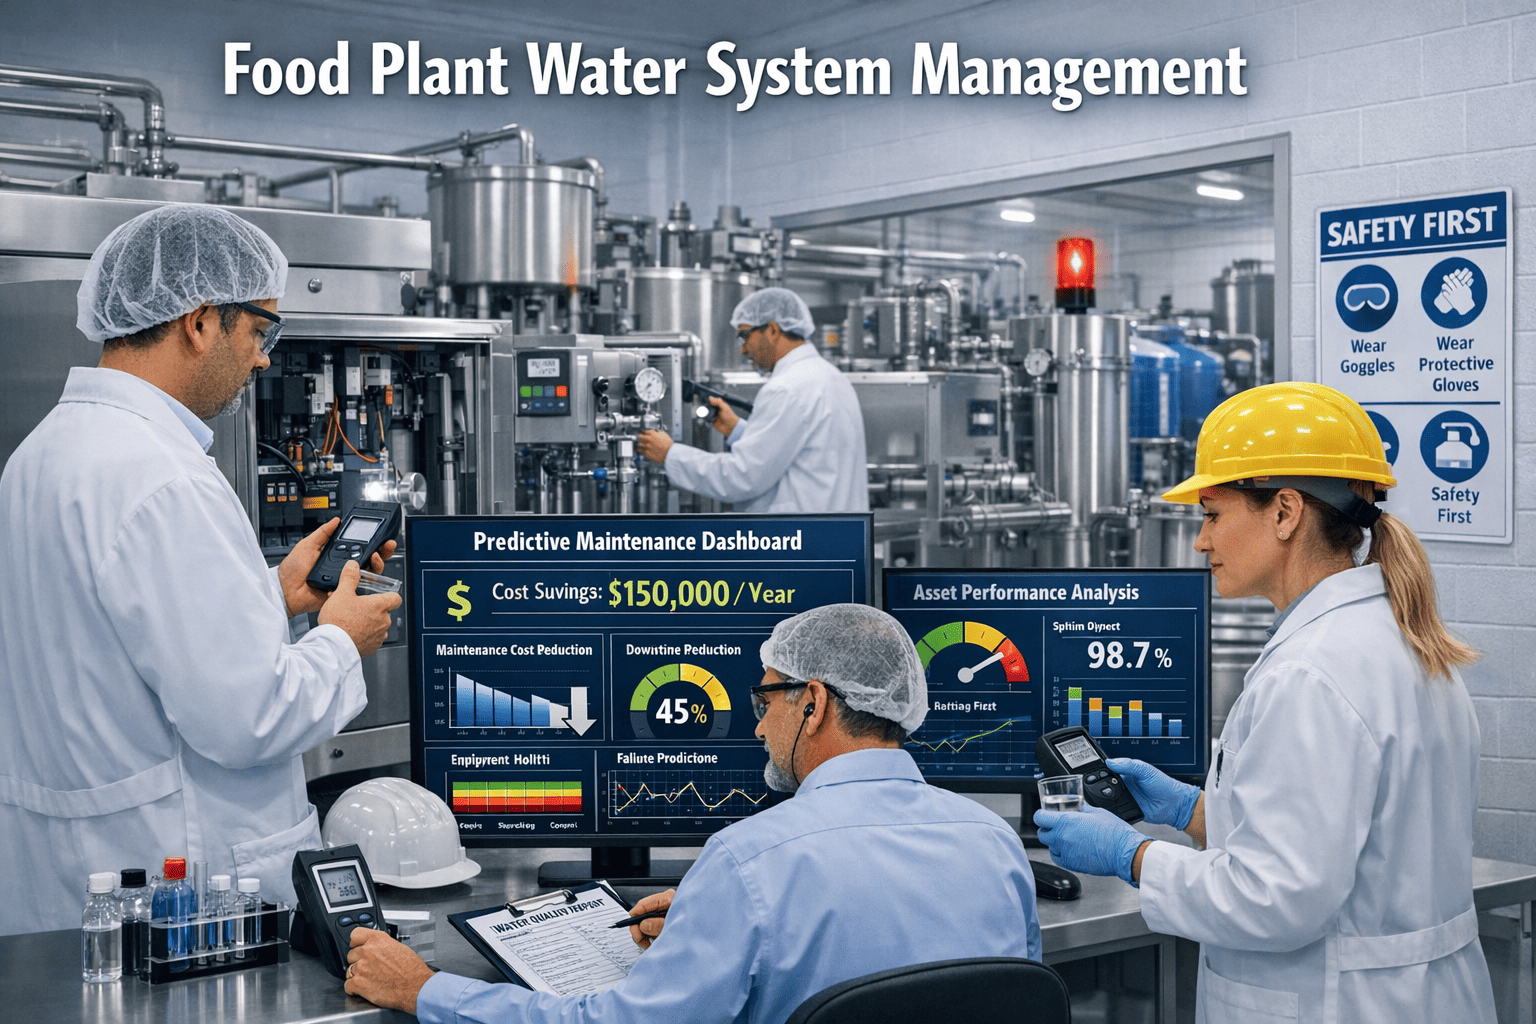
Predictive Maintenance ROI in Food Manufacturing: The CFO-Ready Business Case
Downtime reduction, labour optimisation, quality savings, inventory carry, asset life extension — the six financial layers that turn a $340K capex request into a 4-month payback conversation.
Example · Mid-Sized Food Plant
maintenance cost reduction after predictive deployment
downtime reduction documented by food & beverage manufacturers
OEE improvement reported on bottling lines with PdM
of adopters report positive ROI — 27% hit full payback in under 12 months
ROI isn't estimated in 2026 — it's calculated.
Most food plants underestimate their true downtime cost by 30–40% because they measure revenue lost, not margin lost. OxMaint captures the full six-layer ROI model automatically — downtime cost per hour, emergency premium, quality impact, labour hours, parts inventory, asset life extension.
What is Predictive Maintenance ROI in Food Manufacturing?
Predictive maintenance ROI is the quantifiable financial return generated by using real-time condition data — vibration, temperature, motor current, IoT telemetry — to intervene on food-plant assets before failure, rather than after. In food manufacturing, those failures do not just cost production — they trigger product holds, sanitation rebuilds, HACCP corrective actions and potential recall exposure. That is why the typical F&B ROI case clears 3x–10x within the first 12 months.
The Core Formula
The formula is trivial. The savings inputs are where most plants leave 30–40% on the table.
Where Food Plants Actually Capture PdM Value
Downtime Avoided · usually the largest layer
Hourly gross margin × avoided hours. A $12K/hr food line preventing 6 × 4-hour events = $288K. Use margin per hour, not revenue — most plants understate by 30–40%.
Emergency Repair Premium Eliminated
Planned interventions run 3x–5x cheaper than emergencies — no overtime, no expedited shipping, no secondary damage. An $4,200 average emergency shifted to $1,400 planned saves $50K+ per asset class annually.
Quality & Scrap Reduction
Degraded equipment produces out-of-spec product before total failure. 8 contamination events × 1,200 units × $2.40 = $23K/line/year — unique to food and beverage.
Labour Efficiency & Wrench Time
Planned 2-hr replacement beats a 6-hr emergency diagnosis at $85/hr burdened rate. 40 interventions × 4 hours = $13.6K savings independent of production impact.
Spare Parts & Inventory Carry
Predictive windows of 5–7 days for critical components and 2–4 weeks for degrading systems kill the need for deep safety stock — typical 15–25% reduction in MRO inventory carrying cost.
Asset Life Extension & CapEx Deferral
Predictive maintenance extends asset life 20–30%. On a $2.4M asset fleet, a 3-year life extension is $240K of deferred capex — the quietest layer and the one CFOs love most.
The Four Numbers You Need Before You Present
| Baseline Input | How to Capture | Common Understatement |
|---|---|---|
| Hourly downtime cost | Gross margin per production hour — not revenue. Include idle labour, missed shipments, restart scrap. | 30–40% understated when revenue is used |
| Monthly failure count | Pull 12 months of CMMS data. Multiply average repair time by 1.8x to account for restart and secondary effects. | Secondary damage routinely excluded |
| Emergency vs planned repair cost | Compare actual invoiced emergency jobs against equivalent planned work — same asset, same failure mode. | Overtime and expedited premium often buried |
| PM labour + parts spend | Annual maintenance labour + contractor spend + MRO parts + emergency procurement premium. | Contractor SLA credits rarely claimed |
Food & Beverage PdM Case Outcomes
40% reduction in equipment failures
$2.3M annual savings · 6-month payback
500K units/day frozen meals, packaged goods, dairy. AI-driven PdM deployed across CCP equipment. Contamination-linked quality losses cut by two-thirds.
$120K prevented failure cost
7x ROI overall
Aging machinery, overwhelmed maintenance team. Basic condition monitoring caught a major failure before production impact.
140+ downtime hours saved
Accurate failure prediction
Remote monitoring plus cloud analytics delivered predictive intervention windows on filling-line critical components.
10% OEE improvement
Within 3 months of go-live
Real-time displays, operator-visible metrics, focus on one KPI per month — OEE trending towards +10 points within quarter one.
Where The Money Actually Moves
| Cost Category | Reactive Plant | OxMaint PdM Plant |
|---|---|---|
| Repair cost per event | $4,200 (emergency, overtime, expedited parts) | $1,400 (planned, scheduled, standard freight) |
| Annual unplanned downtime | 323 hrs avg per plant | 160–195 hrs (50% reduction typical) |
| Quality loss from degraded equipment | 2–4% scrap rate during failure lead-up | < 0.5% — caught in quality-impact window |
| Maintenance labour mix | 70% reactive firefighting | 70–80% planned PM & PdM interventions |
| MRO inventory carry | Deep safety stock on critical items | 15–25% reduction via PdM lead time |
| Asset service life | Designed life or less | 20–30% extension with condition-based care |
| Typical ROI within 12 months | n/a | 3x–10x, with 4–6 month payback common |
How OxMaint Turns PdM Into Measured ROI
Baseline Capture
12 months of structured failure history per asset — downtime duration, parts cost, labour hours, production loss — so you have a baseline to measure against, not a guess.
IoT & Sensor Integration
Vibration, temperature, motor current, pressure — integrated into work order workflows so every alert triggers a prioritised action, not an inbox notification.
Prevented-Failure Logging
Every intervention that closes out a predictive alert is logged as a prevented event with estimated cost impact — so sensor spend is justified by documented avoidance.
Live ROI Dashboard
CFO-ready view: downtime cost avoided, emergency premium saved, quality losses prevented, labour efficiency, inventory carry, asset life extension — updated monthly.
3-Year Business Case
Cash-flow model, payback timeline, sensitivity analysis — built from your actual operational data, not industry averages.
Phased Pilot Approach
5–10 critical assets first. Generate real ROI data before full roll-out. Board approval by evidence, not expectation.
Get your CFO-ready model built on your real data — book a demo or start a free trial.
Documented PdM Outcomes Across Food & Beverage
typical ROI ratio within 12 months of food-plant PdM deployment
most common payback period for OxMaint customers
decrease in breakdowns reported by US Department of Energy
reduction in maintenance labour requirements
equipment lifespan extension via condition-based care
to first predicted failure avoidance event post go-live
Frequently Asked Questions
How do I build a predictive maintenance business case my CFO will approve?
Frame it around three numbers the CFO already cares about: current annual downtime cost (using margin, not revenue), current maintenance spend as a percentage of asset replacement value, and payback period of the pilot. Document your top 10 failures from the last 24 months and calculate avoided cost if each had been predicted 7 days in advance. You can book a demo and we'll build the model with your actual inputs in the session.
Is predictive maintenance worth it for low-failure-rate equipment?
Yes — low-frequency, high-consequence failures often deliver the strongest ROI case. A single compressor or pasteuriser failure costing $500K justifies years of sensor cost. The model shifts from frequency-based to consequence-based: if one prevented failure exceeds annual sensor spend, monitoring is justified. Start a free trial and OxMaint's asset criticality scoring will pinpoint these first.
When do predicted-failure savings actually start showing up?
Most OxMaint food customers see the first major predicted failure avoidance within 60 days of go-live — before baseline data is complete. ROI-positive status is typically reached at 4–6 months, and 12-month data shows the full six-layer savings stack.
What is the minimum asset count for PdM to deliver meaningful ROI in a food plant?
Predictive maintenance delivers positive ROI at roughly 20+ assets when downtime cost exceeds $4,000/hour, or at 50+ assets for lower-cost environments. Food manufacturing lines almost always hit the first threshold because product-hold consequences compound downtime cost.
Build a CFO-ready PdM business case — on your real food-plant data.
12-month baseline capture, IoT integration, prevented-failure logging, live ROI dashboard, 3-year cash-flow model — one CMMS trusted by food manufacturers across USA, UK, Canada, Germany, Australia and the UAE.