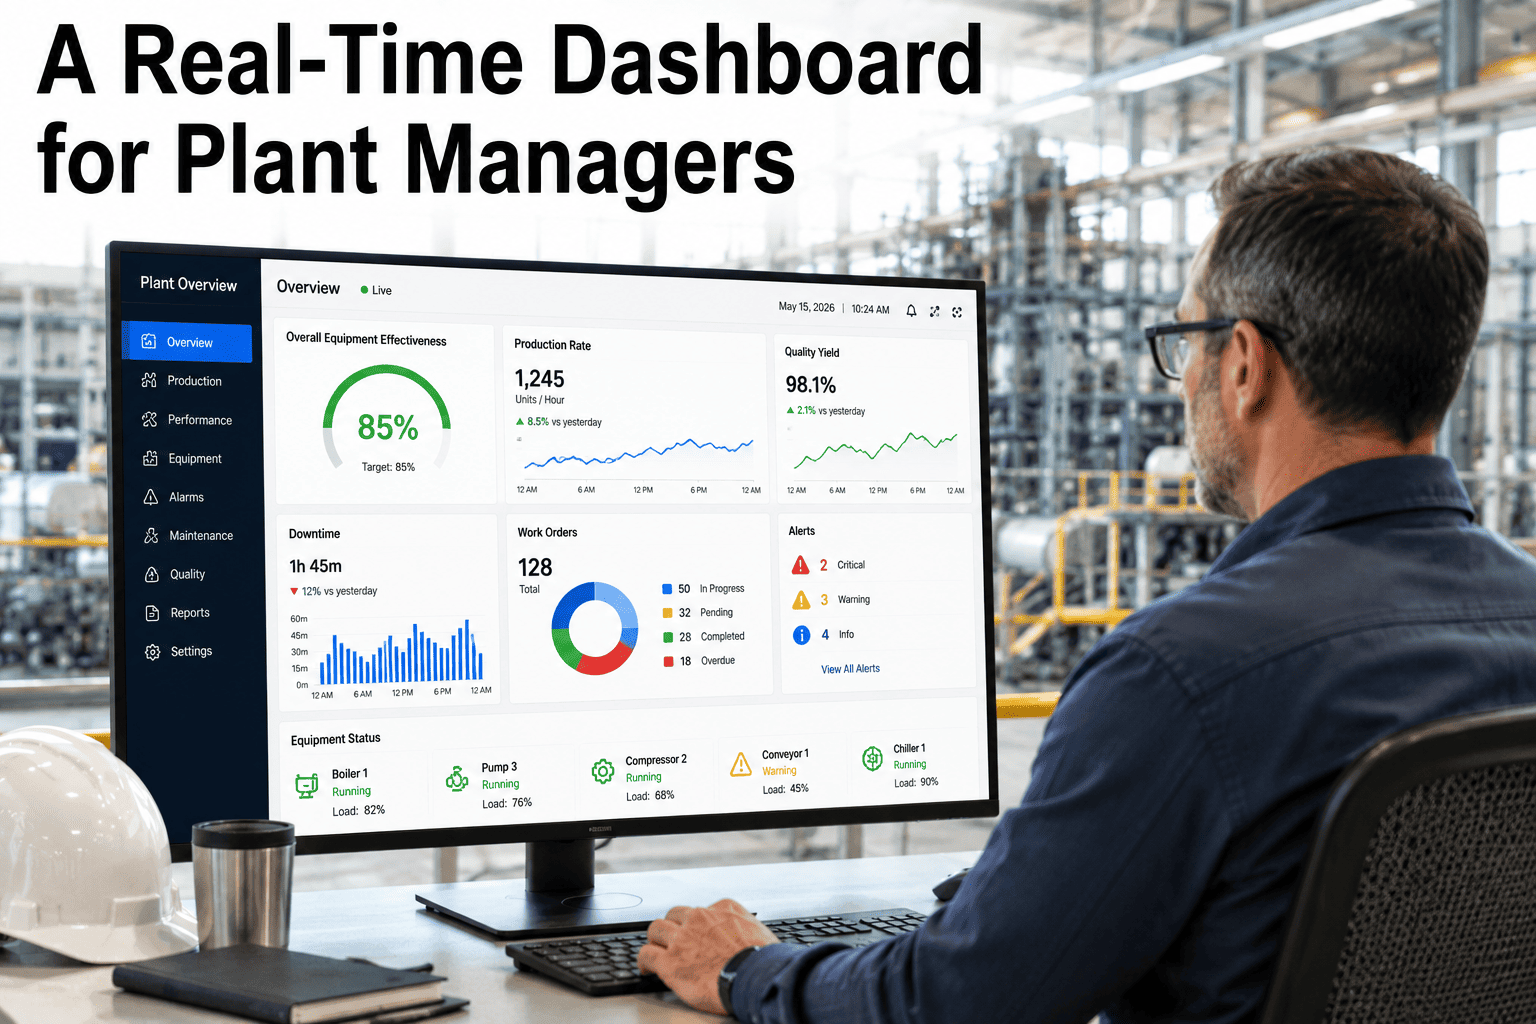
If your maintenance dashboard takes more than 3 seconds to load, it is not a UI problem. It is a data architecture problem — and in food manufacturing, slow data means decisions made on stale information, which means equipment failures that could have been prevented were not, because the signal arrived too late for anyone to act
In the fast-paced world of food manufacturing, real-time data is a vital asset that drives operational efficiency, ensures product quality, and minimizes downtime. However, many food manufacturing plants continue to struggle with slow maintenance dashboards, which can have a significant impact on decision-making and performance.
Data architecture plays a critical role in how information flows, is stored, and is accessed across various systems. See how Oxmaint delivers real-time maintenance data.
AI Infrastructure · Technical Insight · 2026
Slow Maintenance Dashboards in Food Manufacturing: The Hidden Data Architecture Problem
Most food plant maintenance managers assume a slow dashboard is a software vendor problem — a UI issue, a server issue, something to log a support ticket about. It is not. Dashboard lag is a symptom of a deeper data architecture failure: the way your maintenance data is collected, stored, processed, and surfaced is fundamentally incompatible with real-time operational decision-making. And in food manufacturing, the cost of that incompatibility is measured in unplanned downtime, missed failures, and compliance gaps.
68%
Of food manufacturers report their CMMS data is more than 15 minutes old when decisions are made
$30K
Average cost per hour of unplanned downtime in food plants
10.9%
CMMS market CAGR through 2030 — driven by real-time AI-connected platforms
70%
Downtime reduction achievable with IoT-integrated real-time CMMS
The Real Diagnosis
Why Your Dashboard Is Slow — and Why That Matters More Than You Think
A maintenance dashboard that loads in 8 seconds instead of 1 second is not an inconvenience. It is evidence that your entire data pipeline — from sensor or technician input to dashboard display — is built on architecture that was designed for batch reporting, not real-time operational intelligence. The distinction matters because the decisions food plant maintenance managers make are time-sensitive in ways that most software was not built to serve.
What You See
Dashboard loads in 6–12 seconds
↓
What It Actually Means
Queries running against a non-indexed relational database across 3+ years of work order history with no pre-aggregation layer
What You See
Asset status shown as "last updated 47 minutes ago"
↓
What It Actually Means
IoT sensor data is batch-synced on a polling interval, not streamed — so the dashboard reflects the state of your equipment from nearly an hour ago
What You See
PM completion % doesn't update until the next morning
↓
What It Actually Means
Work order records are written to a staging table and rolled into reporting tables overnight — your shift supervisor is managing to yesterday's numbers
What You See
Alerts arrive 20–40 minutes after the threshold was crossed
↓
What It Actually Means
Alert logic runs as a scheduled job, not an event-driven trigger — by the time the alert fires, the equipment has been running out of spec for half a shift
Architecture Deep Dive
The Three Data Architecture Patterns — and Why Two of Them Fail Food Manufacturing
Every maintenance data system uses one of three fundamental architecture patterns. Understanding which one your CMMS is built on explains every performance symptom your maintenance team experiences — and predicts whether it can ever deliver real-time operational intelligence.
Pattern 01 — Legacy
Batch-Processed Relational
Work orders, sensor readings, and inspection records are written to normalized relational tables. Dashboard queries join multiple tables across the full historical dataset at query time — meaning every dashboard load triggers a heavy SQL operation against millions of rows. Sensor data arrives via scheduled polling every 15–60 minutes. Reports are pre-built nightly. This is how most legacy CMMS systems work — including many still sold and deployed in food plants today.
Dashboard speed: 5–15 seconds. Data age: 15 min – 24 hrs. Alert latency: 15–60 min.
Verdict: Adequate for records management. Structurally incapable of real-time operational decisions.
Pattern 02 — Hybrid
Cloud Relational with Caching
A cloud database improves query performance and enables mobile access. Read replicas serve dashboard queries separately from write operations. Some sensor data streamed via cloud IoT hub but still batch-loaded into the reporting layer every 5–15 minutes. Alerts run on shorter polling intervals — typically every 1–5 minutes. This is where most modern SaaS CMMS platforms operate today — meaningfully better than legacy systems but still fundamentally polling-based, not event-driven.
Dashboard speed: 1–4 seconds. Data age: 5–15 min. Alert latency: 1–5 min.
Verdict: Good for operational oversight. Catches most failures but misses time-critical events that develop in minutes.
Pattern 03 — Modern
Event-Driven Streaming + AI Layer
Every work order completion, sensor reading, and inspection result fires an event that updates the data store in real time. Dashboard state is maintained as a pre-computed materialized view that updates on each event — not recomputed at query time. IoT sensor data is streamed continuously via MQTT or WebSocket protocols with sub-second latency. AI anomaly detection runs as an event-driven stream processor — alerts fire within seconds of threshold deviation, not minutes. This is the architecture Oxmaint is built on.
Dashboard speed: <1 second. Data age: <5 seconds. Alert latency: <30 seconds.
Verdict: Enables real-time operational decisions. The only architecture capable of true predictive maintenance in food manufacturing.
The Real Cost
What Slow Dashboard Data Costs Food Plants Per Year
Slow dashboard data is not just an inconvenience that slows down your morning review meeting. In food manufacturing, data latency directly creates measurable operational losses across four cost categories — each of which compounds on the others.
$240K–$960K
Missed failure prevention
A maintenance manager whose dashboard shows a 45-minute-old equipment reading cannot act on a developing anomaly that started 20 minutes ago. At 2–4 avoided failures per year, each costing $120K–$240K, data latency carries a direct downtime cost in the $240K–$960K range for a typical mid-size food plant.
$35K–$180K
Reactive labor premium
When failures aren't caught early, they become emergency repairs — at 1.5–2× standard labor rates, plus premium parts pricing and expedited shipping. Plants with real-time dashboards convert reactive emergency work to planned maintenance, eliminating the labor premium on their highest-cost events.
$60K–$300K
Compliance exposure
FDA inspectors reviewing HACCP records increasingly look for continuous monitoring documentation — not shift-end log entries. Batch-updated compliance records have timestamps that do not reflect actual monitoring intervals, creating documentation gaps that regulators treat as evidence of inadequate preventive controls. Corrective action programs range from $60K to $300K per finding.
12–18 hrs/wk
Management overhead
Maintenance managers in plants with slow dashboards spend 12–18 hours per week manually pulling data, building reports, and chasing status updates that a real-time dashboard would surface automatically. At a maintenance manager total compensation of $95K–$130K annually, that overhead represents $25K–$48K in misdirected management time per year.
Total Annual Data Latency Cost — Mid-Size Food Plant
$335K – $1.49M
Before accounting for brand damage, retailer scorecard impact, or the compounding effect of making multiple operational decisions per day on stale data.
Oxmaint is built on event-driven streaming architecture — data age under 5 seconds
Replace your slow, stale dashboard with real-time operational intelligence. Live in 48 hours — no IT project.
Side-by-Side Scenario
The Same Equipment Anomaly — Two Data Architectures, Two Completely Different Outcomes
This scenario walks through a real failure mode — refrigeration compressor current draw increasing as a bearing degrades — and shows exactly what each data architecture allows the maintenance team to see, and when. The failure is identical in both plants. The outcome is determined entirely by how quickly the data reaches the decision-maker.
T+0 min
Compressor current begins rising — 4% above normal. Sensor reads the anomaly.
Sensor reads anomaly. Event fires instantly to Oxmaint stream processor.
T+30 sec
Data sitting in staging table waiting for next polling cycle.
AI baseline comparison runs. Contextual anomaly confirmed. Alert generated.
T+5 min
Still in staging. Dashboard unchanged. No one aware.
Technician mobile phone receives alert: Compressor 2 — current 4% above load-adjusted baseline. Work order created and assigned.
T+18 min
Next polling cycle runs. Data loaded into reporting layer. Dashboard now shows updated current reading — flagged as slightly elevated but not yet at alert threshold.
Technician inspects compressor. Bearing pre-lubricated. Monitoring interval increased. FSMA-ready maintenance record auto-generated and stored.
T+45 min
Alert threshold finally crossed as current rises further. Scheduled alert job fires. Maintenance manager receives notification.
Compressor returning to normal parameters. Anomaly resolved. Dashboard shows current within normal range.
T+4 hrs
Technician inspects compressor. Bearing now significantly degraded. Emergency repair required during production hours. Line down.
Full production running. No downtime. No emergency repair. Bearing failure prevented 3 weeks before it would have occurred.
Legacy outcome: $18K–$85K emergency repair cost. Production stoppage. Potential product hold.
Oxmaint outcome: $0 emergency cost. Failure prevented. Full compliance record generated automatically.
What Real-Time Actually Means
Six Things a Real-Time Maintenance Dashboard Shows That a Slow One Cannot
Real-time is not just a speed improvement. It is a qualitative shift in what operational decisions become possible. These are the six capabilities that only event-driven streaming architecture makes available in a food plant maintenance context.
01
Live Equipment Health Score
Every asset displays its current health score — a composite of vibration, temperature, current draw, and cycle time data — updated within seconds of each sensor reading. Not the health score from 47 minutes ago. The one right now. Maintenance managers can see at a glance which assets are trending toward degradation before any technician needs to walk the floor.
02
Shift PM Completion in Real Time
A shift supervisor overseeing a 10-person maintenance team across 3 production lines needs to know — right now — which PMs are complete, which are overdue, and which technician is currently where. Batch-updated dashboards show yesterday's completion rates. Real-time shows the current shift, live, with 30-second refresh latency. That is an operationally meaningful difference when shift end is in 90 minutes.
03
Work Order Queue by Current Priority
Equipment priority changes continuously — a pasteurizer running at capacity during peak production is higher priority than the same pasteurizer during a planned product changeover. Real-time architecture dynamically re-ranks the work order queue based on current production context. Technicians are always working the most operationally critical task, not the highest-priority task from this morning's batch update.
04
CCP Monitoring Status — Continuous
HACCP critical control points require continuous monitoring — not interval-based checks. A pasteurization temperature dashboard that updates every 15 minutes is not continuous monitoring by any regulatory definition. Real-time architecture streams CCP readings continuously, with any deviation from validated parameters generating an immediate alert and a timestamped compliance record — satisfying FDA's contemporaneous documentation requirement in a way that batch polling never can.
05
Multi-Site Synchronized View
For food manufacturers operating 3–15 facilities, real-time cross-site visibility means a corporate maintenance director can see the current equipment health status across every plant simultaneously — and immediately identify which facility is carrying elevated failure risk. Batch-architecture multi-site dashboards aggregate data at different latencies per site, creating a composite picture that is misleading because different sites are showing data from different time windows.
06
Instant Audit Report Generation
Because every event is written to the data store in real time with a precise timestamp and technician attribution, audit reports covering any asset, any date range, any compliance category can be generated in under 60 seconds — at any time, not just after the nightly batch runs. When an FDA inspector arrives unannounced at 2 PM, real-time architecture means your compliance records are current to the minute, not to last night's midnight batch job.
How Oxmaint Is Built
The Technical Architecture Behind Oxmaint's Real-Time Performance
Oxmaint is built on an event-driven streaming architecture — not a batch-processing relational database with a dashboard UI bolted on top. Every component of the platform is designed to minimize the time between a data-generating event and that data becoming visible and actionable. Here is how each layer works in a food plant context.
Data Ingestion Layer
IoT Sensor Streaming via MQTT
IoT sensor data from temperature probes, vibration sensors, pressure gauges, and motor current monitors is ingested via MQTT — an event-driven lightweight messaging protocol designed for low-latency, high-frequency sensor data transmission. Every sensor reading generates an event that enters the processing pipeline immediately — not on a polling interval. Sensor data age on Oxmaint dashboards: typically 2–5 seconds from reading to display.
Processing Layer
Event-Driven Stream Processing with AI
Each sensor event passes through Oxmaint's AI stream processor, which compares the reading against the asset's dynamic contextual baseline in real time. Collective anomaly detection — the comparison of multiple simultaneous signals against expected multi-dimensional behavior — runs on every event, not on a scheduled job. This means AI-generated anomaly alerts fire within 30 seconds of the underlying reading, not 15–60 minutes later via polling-based alert logic.
Storage Layer
Materialized Views + Time-Series Optimized Storage
Maintenance data is stored in a hybrid architecture: a time-series optimized database for sensor readings (enabling fast range queries across sensor history without full-table scans), and materialized views for dashboard metrics that are pre-computed and incrementally updated on each event — eliminating the heavy query-time joins that make legacy CMMS dashboards slow. Dashboard load time is the time to fetch a pre-computed result, not the time to run a complex query.
Delivery Layer
WebSocket Dashboard Updates + Mobile Push
Oxmaint dashboards receive live updates via WebSocket connections — meaning the dashboard state updates automatically when new data arrives, without any page refresh or polling from the browser. Work order status changes, anomaly alerts, and CCP readings push to the dashboard and to technician mobile devices simultaneously and instantaneously. Food plant maintenance managers see the same real-time data on their desktop dashboard and on their phone, everywhere on the plant floor.
Real-time architecture. 48-hour implementation. Zero IT project required.
Stop making decisions on data from an hour ago. Oxmaint gives food plant maintenance teams live operational intelligence from day one.
Detailed FAQ
Slow CMMS Dashboards in Food Manufacturing — Questions Answered
How do I know if my current CMMS has a data architecture problem rather than just a performance issue?
There are four diagnostic signs that indicate an architectural problem rather than a performance issue that a server upgrade would solve. First: dashboard load time does not improve meaningfully after you upgrade your hardware or move to a higher-tier cloud instance — because the bottleneck is query structure, not compute. Second: asset status timestamps show data that is 15+ minutes old, which indicates polling-based sensor ingestion rather than event streaming. Third: alerts arrive after you already know about the problem from a technician call — indicating alert logic running on a scheduled job rather than event-driven triggers. Fourth: compliance reports covering a specific time range take more than a few minutes to generate — indicating a non-indexed historical data store rather than a time-series optimized architecture. If you see two or more of these, you have an architecture problem. Contact your vendor and ask specifically whether their platform uses event-driven streaming or polling-based data ingestion. If they cannot answer clearly, that is also diagnostic information.
Sign up for Oxmaint to see what real-time data architecture looks like in practice.
Can our existing CMMS be upgraded to real-time performance, or do we need to replace it?
In most cases, legacy CMMS platforms cannot be meaningfully upgraded to real-time event-driven performance. The limitation is not the UI layer or the server infrastructure — it is the fundamental data model. A platform built on normalized relational tables with polling-based data ingestion cannot be retrofitted with streaming architecture without rebuilding the core data pipeline from scratch, which is effectively a platform replacement. Some vendors offer "real-time" add-ons that reduce polling intervals from 15 minutes to 1–2 minutes — this improves latency but does not deliver true event-driven streaming. True real-time performance requires: MQTT or WebSocket sensor ingestion, event-driven alert processing, time-series optimized storage, and materialized view dashboards that update on each event rather than at query time. If your vendor cannot confirm all four elements, you are looking at a hybrid-architecture platform that will have structural latency limits regardless of configuration. Most food plants find that the operational ROI of switching to a real-time platform — measured in avoided failures and recovered management time — delivers positive return within 60–90 days of transition.
Does a slow maintenance dashboard actually affect our FDA compliance posture?
Yes — in several specific and increasingly significant ways. First, FDA's 21 CFR Part 117 FSMA Preventive Controls regulations require that CCP monitoring records be created "contemporaneously" — at the time the monitoring is performed. A dashboard that shows a 45-minute-old CCP reading is not contemporaneous monitoring; it is retrospective observation. If your HACCP record shows a temperature reading logged at 14:47 but your dashboard only reflects that reading at 15:32 due to batch latency, you have created a documentation timing inconsistency that regulators treat as a documentation integrity failure. Second, FDA's expanded use of import alerts and consent decrees in 2024 and 2025 has focused specifically on facilities that cannot demonstrate continuous monitoring — not interval monitoring. A batch-updated dashboard is, by definition, interval-based monitoring. Third, when a recall investigation occurs, FDA requests all monitoring records for the implicated time period. If your records were batch-generated and show hourly or shift-based timestamps rather than continuous sensor readings, the absence of continuous data expands the scope of the recall investigation. Real-time architecture creates the continuous monitoring record that satisfies all three of these regulatory requirements simultaneously.
Book a demo to see Oxmaint's FSMA-compliant continuous monitoring documentation.
How long does it take to migrate from a legacy CMMS to Oxmaint's real-time platform?
Most food manufacturing operations are fully operational on Oxmaint within 24 to 48 hours of beginning setup — meaning your maintenance team is logging work orders, receiving mobile alerts, and seeing live dashboard data within two days of starting the onboarding process. The migration specifically involves: importing your existing asset register (accepted from any spreadsheet or CSV format), recreating your PM schedules in Oxmaint (the onboarding team handles this configuration), inviting your technician team, and connecting any existing sensor data streams. Historical data from your prior CMMS can be imported during onboarding to preserve asset maintenance history for baseline establishment and compliance continuity — most common CMMS export formats are accepted. For operations where sensor infrastructure needs to be connected, the typical integration timeline adds 3–7 business days depending on the control system type and the number of data streams. The transition is designed to be parallel, not cutover — Oxmaint supplements your existing program from day one, so nothing is disrupted during the migration period. Most plants receive their first real-time AI anomaly alert within the first week of operation.
Our food plant operates in areas with limited WiFi coverage. Can Oxmaint still deliver real-time data in those conditions?
Yes. Oxmaint's mobile application is designed for the specific connectivity challenges of food manufacturing environments — including refrigerated areas, metal-shielded production zones, and outdoor loading areas where cellular and WiFi coverage is intermittent. Technicians can receive and complete work orders in offline mode, with all completed data queued locally and automatically synced when connectivity is restored. For sensor data streams, Oxmaint supports edge processing configurations where a local gateway device handles data collection and processing within the plant network, batching outbound data synchronization when internet connectivity is available and handling sensor ingestion and local alerting continuously regardless of cloud connectivity. The dashboard and alert functionality adapts based on connectivity — when connected to the Oxmaint cloud, full real-time streaming is active; in constrained environments, local caching ensures data is not lost and is synchronized when connectivity is restored. The compliance record integrity is maintained regardless of connectivity conditions, ensuring that all timestamps reflect the actual time of technician action, not the time of cloud synchronization.
What specific dashboard metrics does Oxmaint show in real time that legacy CMMS platforms cannot?
The six metrics that real-time architecture makes available — and that batch-architecture platforms cannot deliver with meaningful currency — are: live asset health scores (composite multi-sensor health index updated within 5 seconds), current-shift PM completion rate with per-technician breakdown (updated within 30 seconds of each work order status change), dynamic work order priority queue (re-ranked in real time based on current production context), CCP monitoring status with continuous sensor readings and no polling gaps, cross-site equipment health comparison for multi-facility operators (all sites showing data from the same timestamp, not different batch cycles), and audit report generation covering any date range in under 60 seconds at any time of day. Legacy CMMS platforms can display all of these metrics on a dashboard — the critical difference is data currency. A legacy dashboard showing "PM completion: 67%" means 67% as of the last batch update, which may be from 15 minutes to 8 hours ago depending on the platform and configuration. Oxmaint showing "PM completion: 67%" means 67% as of 30 seconds ago — which is the difference between a number you can manage to and a number you can only report on after the fact.
Your Dashboard Is Showing You the Past
In Food Manufacturing, Past Data Costs Real Money. Real-Time Data Prevents Failures Before They Happen.
Oxmaint's event-driven streaming architecture delivers dashboard data in under 5 seconds, AI anomaly alerts within 30 seconds, and compliance records that are contemporaneous by design — not batch-generated after the fact. Go live in 48 hours without an IT project.
<5 sec
Dashboard data age
60 sec
Audit report generation