A snack food plant running at 68% OEE looks productive on the surface — until you do the math. Every 10-point OEE gap is equivalent to a full production line sitting idle. At an average unplanned downtime cost of $30,000 per hour, a 68% OEE in a mid-size snack facility translates to $2.1M–$4.8M in recoverable losses every year. The root causes are almost always the same: reactive maintenance, no real-time visibility, and changeovers that run 20–35 minutes longer than they should. This case study shows exactly how one snack food manufacturer climbed from 68% to 91% OEE — a 23-point gain — using automated preventive maintenance, real-time production tracking, and CMMS-driven changeover optimization. If your snack or food production line is stuck below 80%, start a free trial with Oxmaint or book a 30-min production audit to see exactly where your OEE points are hiding.
Food Manufacturing Case Study
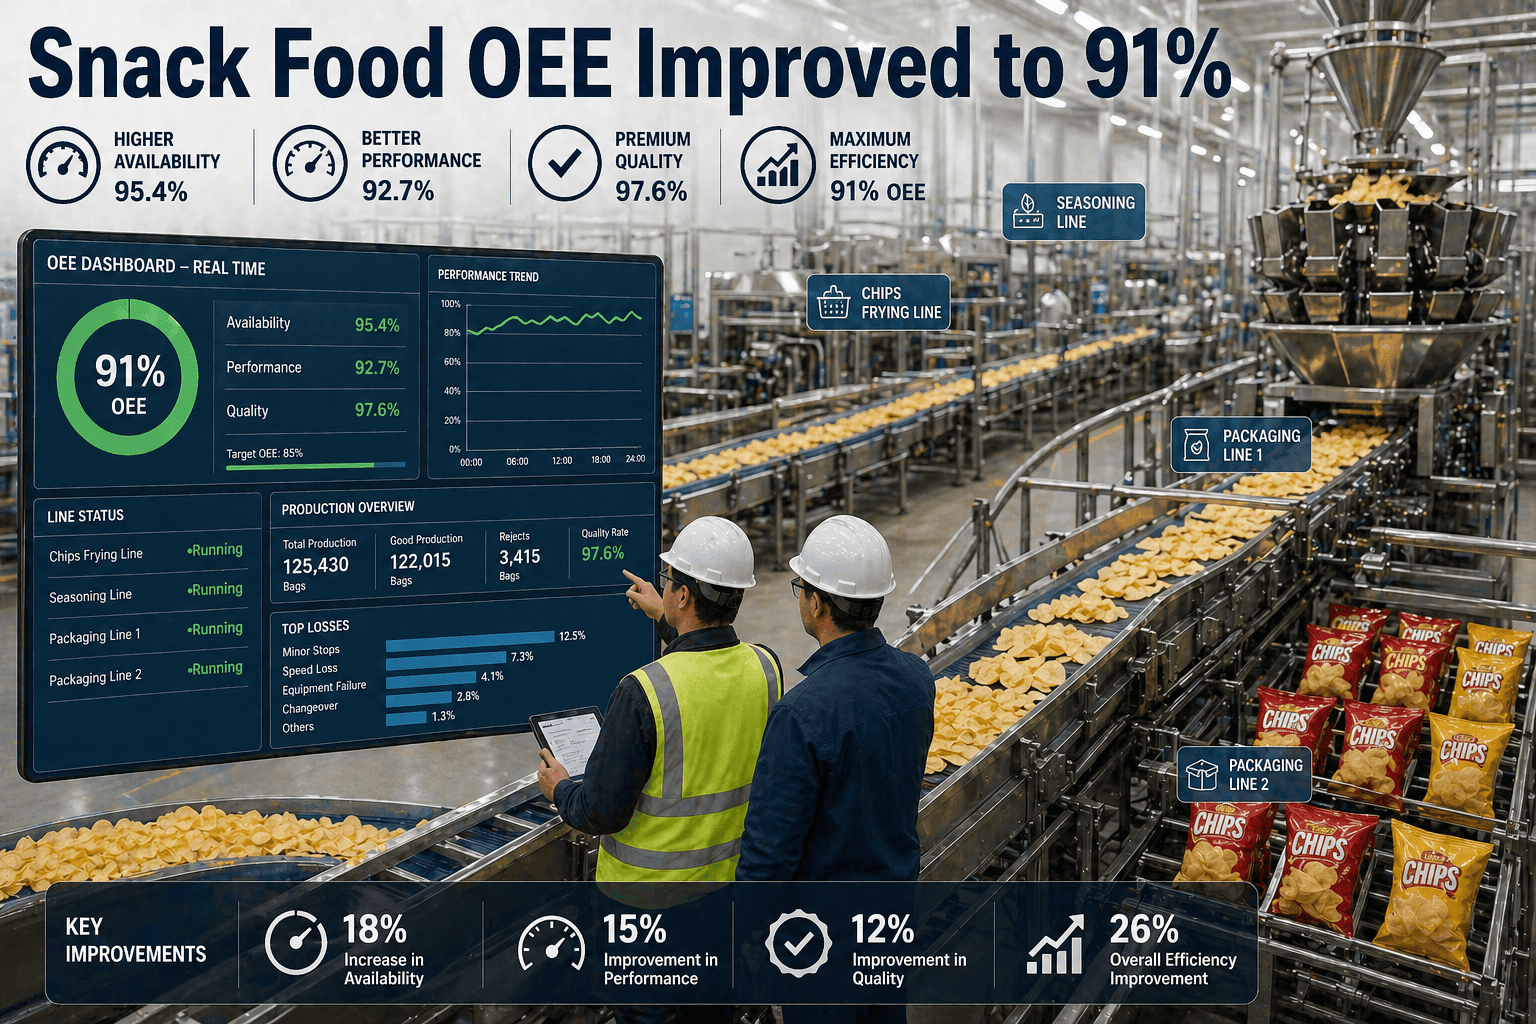
How a Snack Food Plant Raised OEE from 68% to 91% with CMMS
Automated PM scheduling, real-time loss tracking, and structured changeover management turned a chronically underperforming snack line into a top-quartile operation — without a single capital investment.
+23pts
OEE improvement (68% to 91%)
$3.4M
Annual recovered throughput value
42%
Reduction in unplanned downtime
94%
PM compliance achieved within 90 days
Is your snack line stuck below 80% OEE? Oxmaint surfaces the exact loss categories — availability, performance, quality — per line, per SKU, per shift.
What OEE Actually Measures in Snack Food Production
OEE (Overall Equipment Effectiveness) is the product of three components. In snack manufacturing, each one hides a specific and quantifiable loss category that reactive maintenance almost never catches in time.
Availability
Industry avg: 74%
Lost to unplanned breakdowns, changeover overrun, and waiting for maintenance. Every minute offline costs production output directly.
Performance
Industry avg: 80%
Speed losses from micro-stops under 5 minutes, aging equipment running below rated speed, and worn tooling on seasoning/packaging lines.
Quality
Industry avg: 91%
Scrap and rework from startup waste after changeovers, seasoning calibration drift, and temperature excursions in frying or baking.
At 68% OEE, this plant had a combined loss of 32 percentage points — with availability running at 71%, performance at 83%, and quality at 91%. The availability gap was the largest single lever, and it was almost entirely driven by unplanned downtime.
The 5 Root Causes Behind 68% OEE
Before deploying Oxmaint, a structured loss analysis revealed five failure modes that collectively accounted for 78% of all downtime events on the main production line.
01
No automated PM scheduling
Calendar-based maintenance was done manually, resulting in 38% of PMs missed or delayed each month. Fryers, conveyors, and packaging machines ran past service intervals regularly.
02
Micro-stops invisible to supervisors
Stops under 5 minutes were never logged. Over a shift, these accumulated to 45–70 minutes of invisible performance loss per line per day.
03
Changeover overrun on high-mix lines
SKU changeovers averaged 38 minutes against a 22-minute target. No standardized procedure, no CMMS-linked checklist, and no real-time compliance tracking contributed to the gap.
04
Reactive repair cycle with no parts visibility
When equipment failed, technicians spent 25–40 minutes locating the correct spare part. No live inventory linked to work orders meant every breakdown compounded with parts search time.
05
No shift-level OEE data for supervisors
OEE was calculated weekly from spreadsheet exports. Supervisors had no visibility into live performance gaps, so losses went uncorrected for days before anyone acted.
What Each OEE Point Was Worth
Before committing to any solution, the plant's operations director quantified the financial cost of each gap. This is the analysis that made the CMMS investment decision straightforward.
Lost capacity per OEE point
$180K–$380K
On a high-speed snack line, each 1% OEE improvement recovers between $180,000 and $380,000 in annual capacity value — depending on SKU margin and shift count.
Average unplanned downtime cost
$30K/hr
Industry benchmark for mid-size food processing facilities. At 3–4 incidents per week averaging 90 minutes each, this plant was losing $500K+ monthly in visible downtime costs alone.
Changeover overrun annual cost
$640K
16 extra minutes per changeover x 4 changeovers/day x 250 days = 2,667 hours of lost production time. At line output value, that equates to $640K in unrecovered capacity annually.
Reactive vs. planned premium
+35–55%
Every emergency repair costs 35–55% more than the same job done on a planned schedule. Overtime, expedited parts, and production delays amplify the true repair cost dramatically.
How Oxmaint Solved Each Root Cause
The implementation focused on four targeted capabilities, each mapped directly to a confirmed loss category. No generic software rollout — every feature activated was tied to a specific OEE recovery lever.
Automated PM Scheduling
Oxmaint replaced manual PM calendars with condition-triggered work orders for fryers, conveyors, and packaging machines. PMs were automatically assigned to technicians with parts pre-staged. PM compliance rose from 61% to 94% within 90 days.
Real-Time OEE Dashboard
Live OEE data pulled from line PLCs via OPC-UA gave supervisors, the maintenance manager, and the plant director the same number simultaneously — updated every 60 seconds. Micro-stops under 5 minutes were captured automatically, eliminating the 45–70 minutes of invisible daily loss.
CMMS-Linked Changeover Checklists
Digital changeover procedures were built into Oxmaint work orders with step-level time tracking. Supervisors saw live changeover duration vs. target on mobile. Average changeover time dropped from 38 to 21 minutes within 8 weeks — recovering 1,800+ annual production hours.
Integrated Spare Parts Inventory
Work orders were linked to live inventory, so the correct spare part was surfaced automatically when a breakdown occurred. Parts search time dropped from 35 minutes to under 4 minutes. Emergency parts expediting costs fell by 62%.
Loss Attribution per SKU
Oxmaint's production analytics attributed every downtime event, speed loss, and quality rejection to the specific SKU running at the time. This revealed that 3 of 18 SKUs caused 61% of total losses — enabling targeted line settings and maintenance protocols for high-impact products.
Mobile Work Orders for Technicians
Maintenance technicians received, updated, and closed work orders on mobile — eliminating clipboard-to-system lag time. Mean time to repair (MTTR) on critical fryer and conveyor assets dropped from 94 minutes to 41 minutes.
Before vs. After: The 12-Month OEE Transformation
Scroll right to view full table
| Metric |
Before Oxmaint |
After 12 Months |
Improvement |
| Overall OEE |
68% |
91% |
+23 points |
| Availability |
71% |
93% |
+22 points |
| Performance |
83% |
96% |
+13 points |
| PM Compliance |
61% |
94% |
+33 points |
| Avg. Changeover Time |
38 min |
21 min |
-45% |
| Unplanned Downtime Incidents/Month |
21 |
12 |
-43% |
| Mean Time to Repair (MTTR) |
94 min |
41 min |
-56% |
| Emergency Parts Expediting Cost |
$148K/yr |
$56K/yr |
-62% |
ROI Summary: 12-Month Financial Impact
The operations director ran a full ROI calculation at the 12-month mark. Results significantly exceeded initial projections and justified a multi-facility rollout.
$3.4M
Recovered throughput value from 23-point OEE gain
$920K
Saved in unplanned downtime costs (21 to 12 incidents/mo)
$640K
Recovered from changeover time reduction
8.5x
ROI on Oxmaint investment within first year
Every hour of downtime your snack line loses today is recoverable capacity. Start a free trial and plot your first OEE waterfall within a week — no PLC integration required to get started.
Frequently Asked Questions
What is a realistic OEE target for a snack food production line?
The food and beverage industry average OEE sits between 55% and 65%. World-class is 85% or above. A well-run snack plant with automated PM and structured changeover management can realistically target 85–92% OEE within 12 months of CMMS deployment, depending on equipment age and product mix complexity.
Oxmaint's OEE dashboard shows your baseline within the first week.
How much does each OEE percentage point improvement actually recover?
On a typical high-speed snack production line, each 1% OEE improvement recovers $180,000 to $380,000 in annual production capacity value. The exact figure depends on line speed, SKU margin, and number of shifts. The 23-point gain in this case study recovered $3.4M in annual throughput value.
How quickly can a CMMS improve OEE in a food manufacturing plant?
Most plants see measurable OEE improvement within 60–90 days of go-live, primarily driven by PM compliance gains and micro-stop visibility. Significant structural improvement — 15+ points — typically takes 6–12 months as condition-based maintenance matures and changeover standardization takes hold.
Book a demo to see a realistic timeline for your facility.
Does Oxmaint require PLC integration to track OEE in food plants?
No. Oxmaint supports manual downtime logging, barcode-triggered work orders, and tablet-based operator entry alongside full PLC/OPC-UA integration. Plants can start with manual entry and migrate to automated data capture as readiness grows — without losing any historical data or reconfiguring the system.
Stop Leaving OEE Points on the Table
The average snack food plant runs at 55–65% OEE. Every point below 85% is recoverable capacity worth $180K–$380K per year. Oxmaint gives your maintenance and operations teams real-time visibility into exactly where those points are going — and what to do about it.