Municipal infrastructure faces a compounding problem: aging assets built to mid-20th century standards are now operating in climate conditions those standards never anticipated, while public works budgets remain flat or shrinking. The result is a growing gap between what infrastructure needs to stay resilient and what maintenance departments can fund and staff. A climate risk asset scoring dashboard closes the information gap — giving public works directors and city engineers a ranked, evidence-based view of which infrastructure assets carry the highest failure probability under climate stress, so limited maintenance budgets can be directed where the consequence of inaction is greatest. OxMaint brings that scoring capability to municipal maintenance operations in a platform your field teams can actually use.
Government · Climate Resilience · Analytics and Reporting
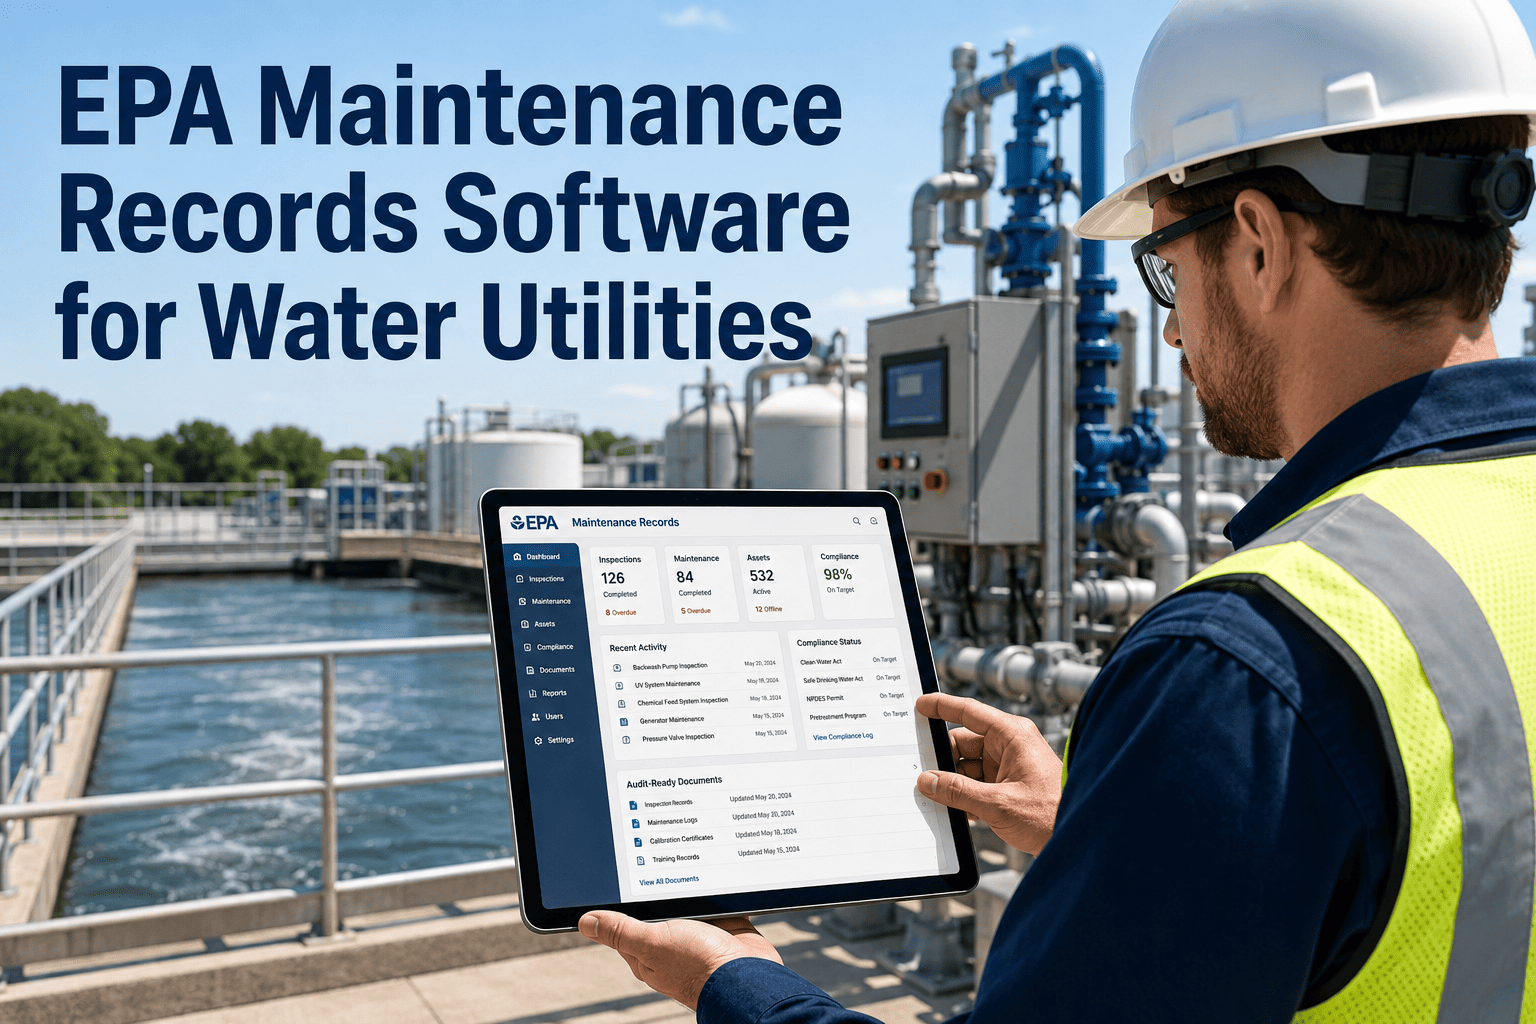
Climate Risk Asset Scoring Dashboard for Municipal Infrastructure
Public works teams cannot maintain everything equally — and in a changing climate, equal maintenance is not the same as resilient maintenance. OxMaint's analytics dashboard scores every infrastructure asset by climate risk, maintenance history, and failure consequence so your team works the right assets first.
Stormwater Pump Station 4
92 — Critical
Bridge Deck — Route 7 Overpass
78 — High
HVAC — City Hall Annex
64 — Moderate
Electrical Panel — Public Works Yard
51 — Moderate
Fleet Fueling Station
29 — Low
Critical
High
Moderate
Low
The Municipal Maintenance Gap
Why Equal Maintenance Is No Longer Enough
ASCE's 2025 Infrastructure Report Card gives US municipal infrastructure a D+ overall, with drinking water systems, stormwater infrastructure, and bridges among the most at-risk categories. Climate change is accelerating the deterioration of assets already past their design life — heat cycling shortens pavement lifespan, intensified storm events overwhelm undersized stormwater systems, and drought-expansion cycles compromise water main integrity. Without a systematic way to rank which assets need attention most urgently, public works teams distribute maintenance effort by proximity, complaint volume, or institutional habit rather than actual risk.
Stormwater Systems
ASCE Grade: D
Flooding frequency rising 34% per decade in US urban areas
Bridges and Culverts
ASCE Grade: C
42% of US bridges past design life; scour failure increasing with storm intensity
Water Distribution
ASCE Grade: C–
6 billion gallons lost daily to aging mains; drought stress accelerating failures
Public Buildings
Avg. age: 47 years
HVAC, roofing, and electrical systems operating beyond rated service life in most municipalities
Source: ASCE 2025 Report Card for America's Infrastructure · EPA Stormwater Infrastructure Analysis 2024 · FHWA Bridge Condition Report 2024
How the Scoring Works
What Goes Into OxMaint's Climate Risk Asset Score
Each asset in the OxMaint platform receives a composite risk score updated as maintenance data, inspection findings, and climate event records are logged. The score combines four weighted dimensions that reflect both physical condition and consequence of failure — giving public works directors a defensible, data-driven basis for maintenance prioritization and capital planning requests.
25%
Asset Condition
Physical age, inspection findings, PM compliance rate, and time since last verified service relative to manufacturer interval
30%
Climate Exposure
FEMA flood zone designation, heat island index, historical storm damage proximity, and asset type vulnerability profile
30%
Failure Consequence
Population served, criticality to emergency operations, estimated repair cost, and downstream service dependency
15%
Maintenance History
Frequency of reactive work orders, recurring failure patterns, and PM skip history indicating deferred maintenance accumulation
Dashboard Capabilities
What Your Public Works Team Sees in OxMaint
| Dashboard View |
What It Shows |
Who Uses It |
Decision Enabled |
| Risk Score Rankings |
All assets sorted by composite climate risk score with filter by category, district, or facility |
Public works director, city engineer |
Maintenance budget prioritization, capital plan input |
| PM Compliance Report |
Scheduled vs. completed PM rate by asset, department, and month with overdue alerts |
Maintenance supervisor, city council reporting |
Staff allocation, contractor performance review |
| MTTR Tracking |
Mean time to repair by asset category, crew, and priority level with trend over 12 months |
Operations manager, department head |
Crew efficiency, response time improvement |
| Repair Cost Analysis |
Planned vs. emergency repair cost per asset with cumulative cost-to-replace comparison |
Finance director, city manager |
Capital replacement timing, budget request justification |
| Climate Event Log |
Storm, flood, and heat event records linked to post-event inspection findings per asset |
Emergency management, FEMA reporting |
FEMA grant documentation, insurance claims support |
See It Live
Book a Demo Tailored to Your Municipality's Asset Categories
We'll walk through your specific infrastructure types — stormwater, bridges, public buildings, or fleet — and show how OxMaint builds and ranks the climate risk score for each asset in your inventory.
Measured Results
What Municipalities Gain with Risk-Scored Maintenance Planning
Emergency Repair Spend
60% reduction
Municipalities shifting to risk-prioritized PM report dramatic reductions in reactive emergency spend within 18 months
FEMA Grant Documentation Speed
3x faster
Pre-event condition records and post-event inspection logs in OxMaint accelerate FEMA Public Assistance grant applications
Capital Planning Accuracy
+40% better
Risk score data gives finance teams asset-specific replacement cost and timing projections replacing guesswork in capital budgeting
Sources: APWA Public Works Operations Benchmarking 2024 · FEMA Hazard Mitigation Grant Efficiency Study 2024 · ICMA Local Government Infrastructure Survey 2024
Expert Perspective
What Public Works and Emergency Management Leaders Say
Every public works director I have spoken with is managing the same equation: more assets past their design life, more extreme weather events stressing those assets, and a maintenance budget that has not kept pace with either trend. The only rational response to that situation is prioritization — not equal distribution of effort, but evidence-based decisions about which failures you can afford to let happen and which you cannot. A climate risk scoring system is what makes that prioritization defensible to elected officials, auditors, and the public rather than appearing arbitrary.
Marcus Adekunle
Director of Public Works · Mid-size US Municipality · 23 years municipal infrastructure management
★★★★★
When a major storm event hits, FEMA's Public Assistance program requires municipalities to demonstrate that damaged assets were maintained according to recognized standards before the event. Without documented PM records linked to specific assets, that demonstration becomes very difficult — and claims are delayed or reduced accordingly. The municipalities we see receiving full and fast FEMA reimbursements consistently have one thing in common: a CMMS that produces pre-event maintenance records automatically. That documentation is not just good operations practice, it is a direct financial return on the technology investment when disaster strikes.
Book a demo to see how OxMaint generates that documentation for your jurisdiction.
Dr. Yewande Ojo
Emergency Management Coordinator · County Government · 18 years disaster recovery and infrastructure resilience
★★★★★
Common Questions
What Municipal Teams Ask About OxMaint
How does OxMaint calculate climate risk scores for assets without existing sensor infrastructure?
OxMaint does not require IoT sensors to generate climate risk scores. The scoring model draws on inputs your team already has or can collect: asset age and type, inspection findings logged during routine rounds, FEMA flood zone designation for the asset location, PM completion history, and repair frequency from work order records. Field technicians log condition observations during inspections using mobile work orders, and those findings update the asset score automatically. For municipalities starting with no digital maintenance history, OxMaint's onboarding process includes an initial asset condition survey workflow that populates the baseline data needed to generate first-run risk scores across your asset inventory within the first 30 days.
Sign up free to begin your asset registry setup.
Can OxMaint produce the maintenance documentation required for FEMA Hazard Mitigation and Public Assistance grant applications?
Yes. OxMaint generates pre-event maintenance records, post-event inspection findings, repair cost documentation, and asset condition histories in exportable formats directly aligned with FEMA Public Assistance documentation requirements. For Hazard Mitigation grant applications, the platform produces asset-level risk justification reports showing condition scores, climate exposure data, and projected failure costs — the evidence base FEMA reviewers look for when evaluating mitigation project necessity. Municipalities using OxMaint have consistently reduced the time required to compile FEMA documentation from weeks to days, and in some cases received higher reimbursement rates by providing more comprehensive asset condition evidence than FEMA typically receives from manual record systems.
How does OxMaint help public works directors present maintenance needs to city council and elected officials?
OxMaint's analytics dashboard generates clear, non-technical reports that translate maintenance data into financial and public safety terms elected officials can evaluate: deferred maintenance backlog value, projected failure costs for top-rated risk assets, emergency versus planned repair cost comparison, and projected capital replacement needs by fiscal year. These reports replace spreadsheet summaries and verbal estimates with data-backed presentations showing specifically which assets are at risk, what failure would cost, and what proactive maintenance investment is required to avoid that cost. Several municipalities have used OxMaint analytics reports directly in budget presentations to secure maintenance funding approvals that had previously been denied.
Book a demo to see the council reporting templates in action.
Does OxMaint support multi-department use across public works, parks, facilities, and emergency management in the same city?
Yes. OxMaint supports multi-department deployment within a single municipal government, with separate asset registries, work order queues, and PM schedules for each department while sharing a unified analytics layer that gives city leadership a cross-department view of infrastructure condition and maintenance compliance. Public works, parks and recreation, facilities management, and utilities can each maintain their own operational workflows while the city manager or finance director accesses portfolio-level reporting across all departments. Role-based access controls ensure that technicians see only the assets and work orders relevant to their department, while supervisors and directors access their department or the full portfolio depending on their access level.
Get Started
Give Your Infrastructure the Risk Score It Needs
OxMaint gives municipal public works teams climate risk asset scoring, FEMA-ready documentation, PM compliance tracking, and council-ready analytics in one platform. Book a 30-minute demo with your asset category list and we'll map the risk picture for your jurisdiction.