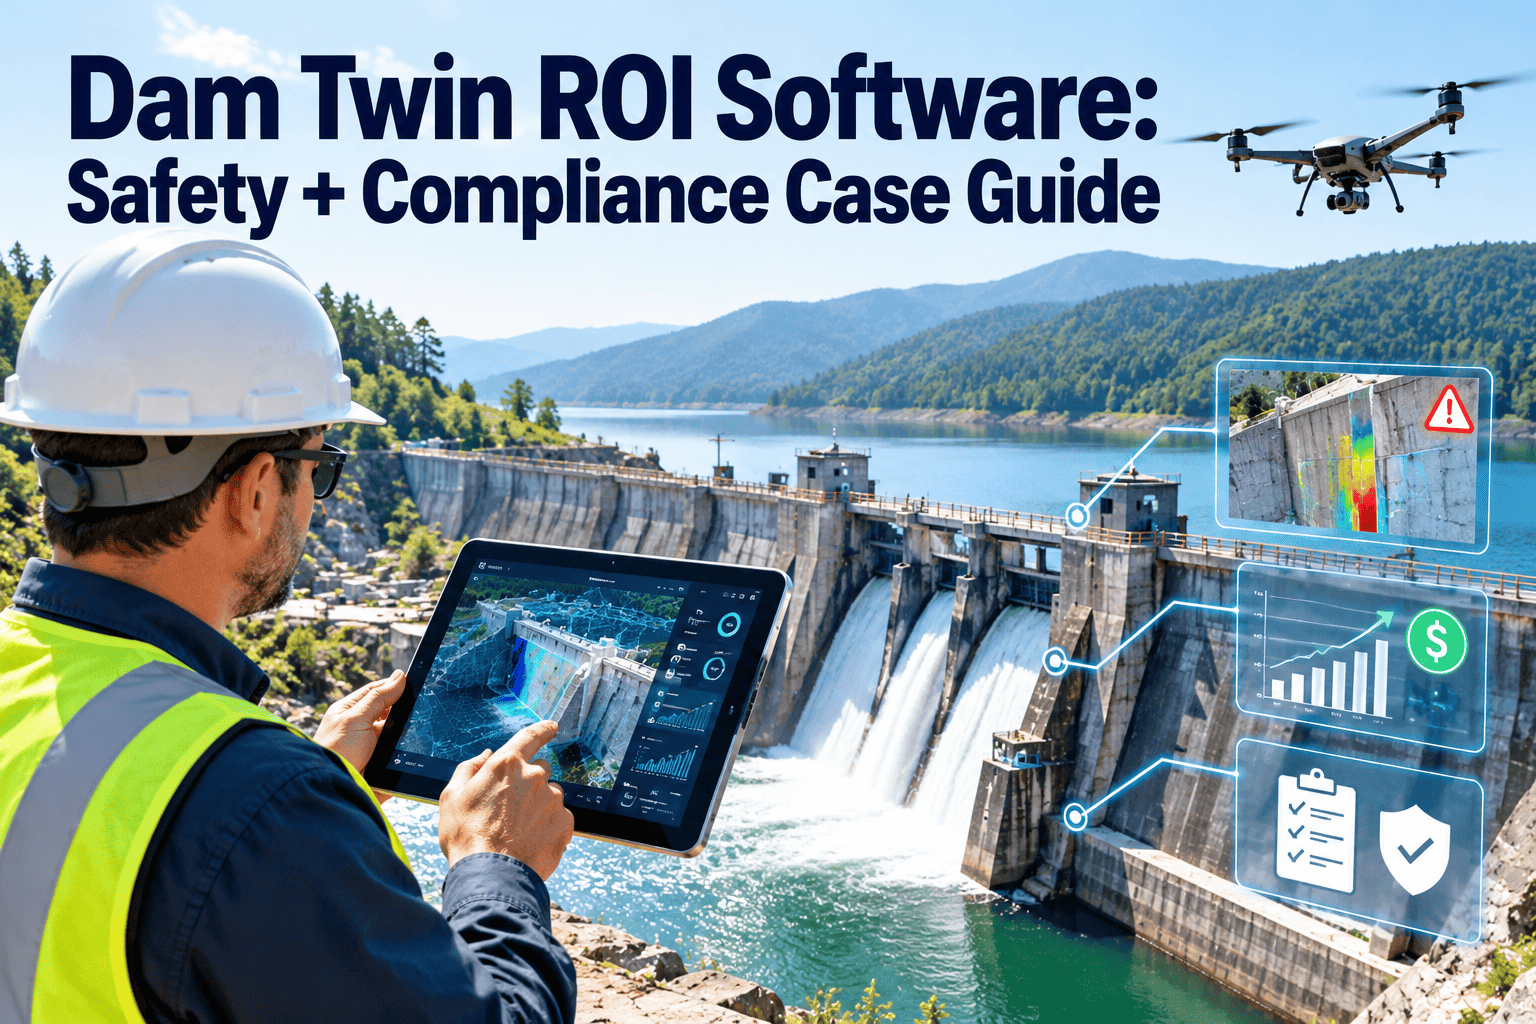
Dam owners are asked a simple question every budget cycle: is the portfolio getting safer or just older? Answering it takes more than a list of open repairs. It takes asset management KPIs that move in a visible direction, such as facility condition index, risk score change and rehabilitation completion. Federal programs, state dam safety offices and utilities all depend on this trend evidence to justify funding. This guide shows how maintenance and dam safety teams can build those KPIs from everyday inspection and work order data, and how a CMMS with asset and inspection records keeps the numbers current.
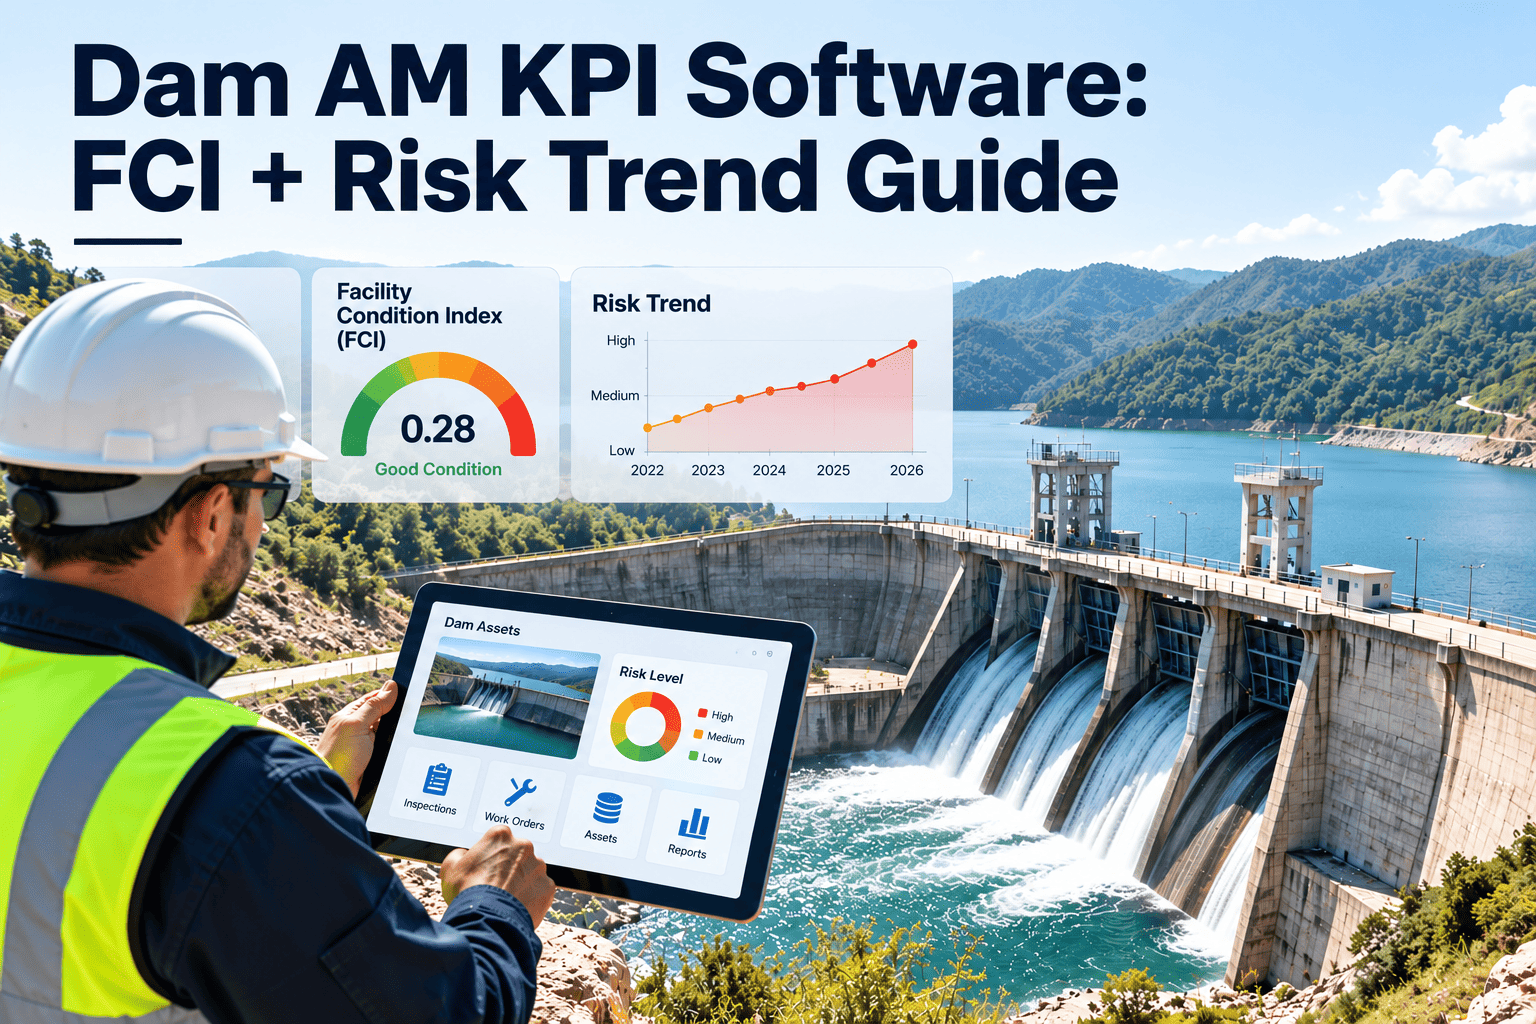
Dam AM KPI Software: Track FCI Trend, Risk Score Change and Rehab Completion
Turn inspections, deficiencies and repairs into trend lines that Dam Safety Officers and funding bodies can read at a glance.
Why Dam Programs Need Trend KPIs, Not Snapshots
A single inspection report describes one moment. Dam safety decisions depend on direction: whether a seepage area is stable, whether a spillway gate backlog is shrinking, whether the risk picture is improving after investment.
The Three Core Dam Asset Management KPIs
Keep the set small. Three measures, reviewed consistently, say more than twenty that nobody trusts.
FCI trend
Facility condition index is deferred maintenance cost divided by current replacement value. Plot it per dam, per structure type and for the portfolio, and review direction each quarter.
Risk score change
Record the risk classification or score assigned under your program's method, then track change after each assessment, repair or operational change.
Rehab completion
Measure completed rehabilitation actions against those planned, weighted by the risk each action addresses, not just by count.
Building a Defensible FCI for Dams
FCI works well for buildings, and dams need careful adaptation. The inputs must be consistent or the trend will mislead.
Decisions to make before you start
- Define which components count: embankment, spillway, outlet works, gates, instrumentation, access roads
- Choose one replacement value method and document it
- Decide when a monitored condition becomes a costed deficiency
- Separate operational maintenance from capital rehabilitation so neither hides the other
Common FCI distortions
- Replacement values updated unevenly, which moves FCI without any change in condition
- Deficiencies closed on paper without verified completion
- Large one-time repairs that mask a growing small-item backlog
Risk Score Change: Reading Movement, Not Just Level
Programs such as USACE and Reclamation use risk-informed approaches, and state programs often use hazard and condition classifications. Whatever method you follow, the useful KPI is how the result moves after action.
| Movement | Typical cause | Maintenance response |
|---|---|---|
| Risk down | Repair verified, monitoring confirms stable behavior | Record evidence, return to routine schedule |
| Risk flat | Condition unchanged, or repair pending funding | Confirm monitoring frequency, document the funding status |
| Risk up | New seepage, settlement, gate failure, or deferred repair | Escalate to the Dam Safety Officer, open a priority work order |
| Risk unknown | Missed inspection or instrument gap | Schedule the inspection, treat the gap as a finding |
From Inspection Finding to Closed Rehab: The Evidence Chain
Finding recorded
Inspector logs the deficiency with photos, location and component.
Risk and cost assigned
Engineer sets severity, estimated cost and target date.
Work order issued
Crew or contractor receives scope, drawings and permits.
Completion verified
Closeout photos and sign-off are attached to the asset.
KPI recalculated
FCI, risk status and completion rate update from the closed record.
Show Whether Your Dam Portfolio Is Improving
See how inspection findings, work orders and asset records can feed one set of KPIs for reviews and funding discussions.
Rehabilitation Completion KPIs That Hold Up in Review
Percent complete is easy to report and easy to misread. Pair it with measures that show whether the right work finished first.
- Risk-weighted completion: share of planned risk reduction actually delivered
- Aging of open items: days since identification, grouped by severity
- Funded versus unfunded: how much of the backlog has an approved source
- Rework: repairs reopened after inspection or monitoring shows a return
Data Sources Behind the KPIs
How a CMMS Supports Dam AM KPIs
Asset register for every dam component
Structure the register by dam, then by component, so each deficiency and cost rolls up cleanly. A consistent hierarchy keeps FCI comparable across sites.
Scheduled inspections and preventive maintenance
- Recurring tasks for gate exercising, drain cleaning, vegetation control and instrument checks
- Mobile checklists with required photos and reading entry
- Automatic follow-up work orders when a reading exceeds a set limit
Reporting and dashboards
Dashboards can show open deficiencies by severity, overdue inspections, backlog value and completion by dam. Exported reports support Dam Safety Officer reviews and budget submissions.
Trends Shaping Dam Asset Management
Risk-informed prioritization
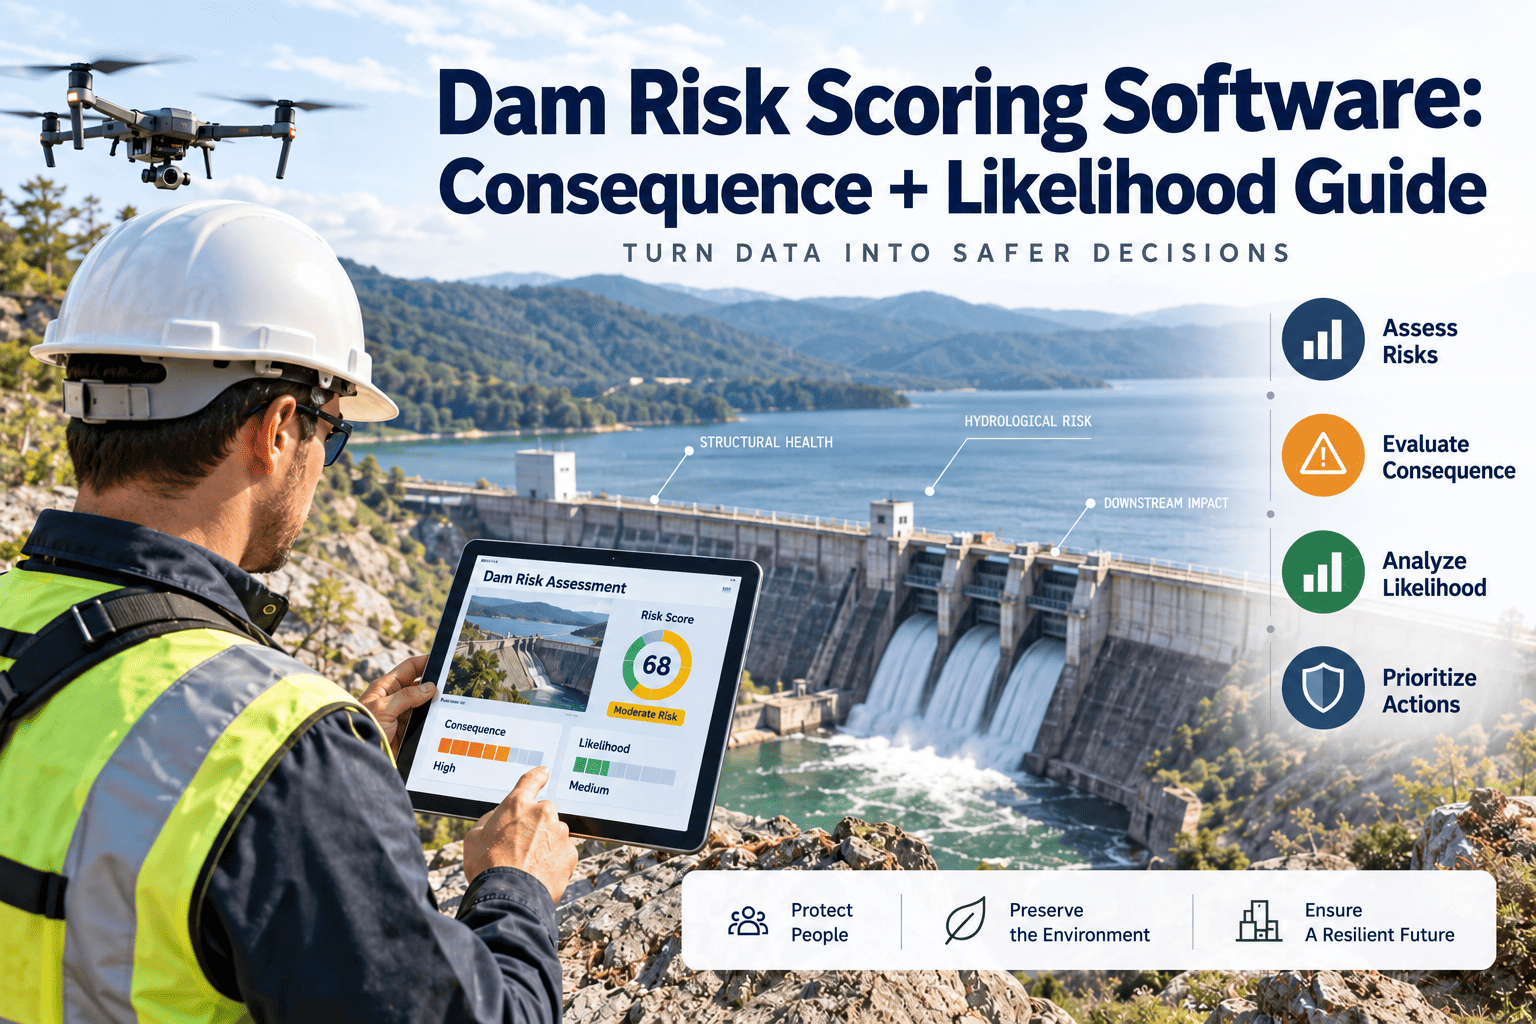
Programs increasingly rank work by consequence and likelihood, so KPIs must connect repair cost to risk reduction.
Aging infrastructure and climate loading
Many dams are decades old and face changing flood and drought patterns, which raises the value of consistent trend data.
Condition monitoring
Sensor and remote readings can inform inspection timing, provided the readings are recorded against assets.
Frequently Asked Questions
Give Every Dam a Trend Line You Can Defend
Bring condition, risk and rehabilitation data into one maintenance system and report progress with evidence.