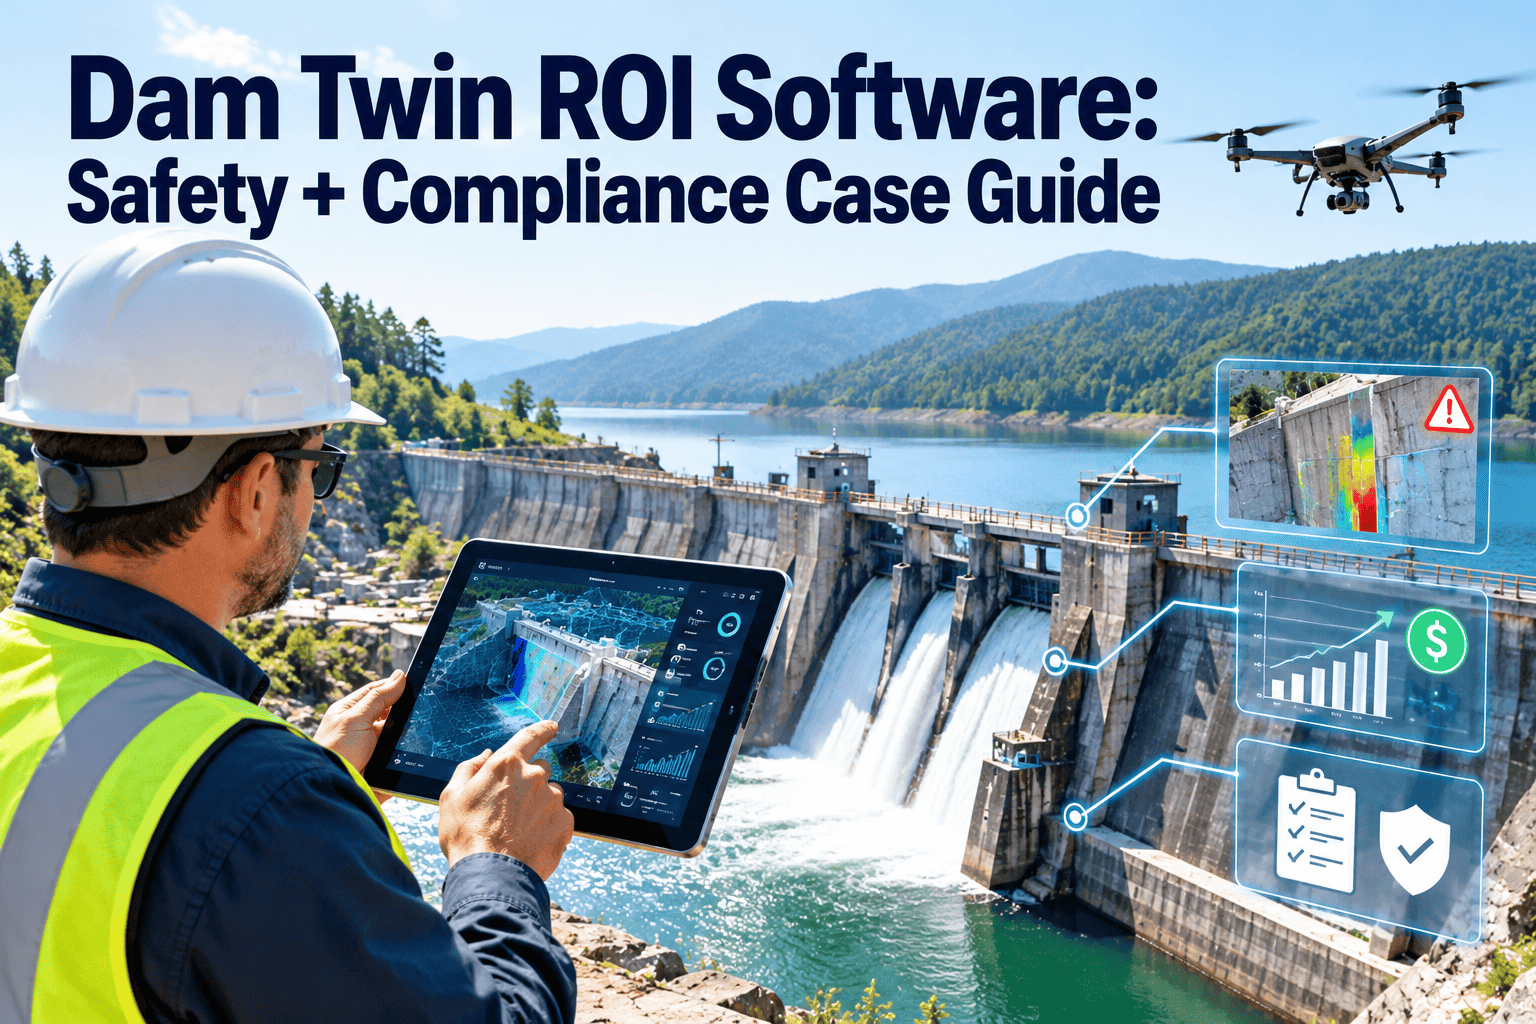
Dam owners are being asked to justify digital twin investments the same way they justify spillway gates or instrumentation upgrades: with a clear safety, compliance and cost case. A twin that looks impressive in a demo can still fail a capital review if nobody can show what risk it reduces or what work it removes. This guide lays out a practical ROI framework for dam owners, and you can see how Oxmaint connects inspections, deficiencies and work orders to that case.
Dam Safety · Digital Twin · Capital Review
Dam Twin ROI Software: A Safety and Compliance Case Guide
Build a defensible business case from three measurable levers: lower safety risk, faster review cycles and a smaller deferred maintenance backlog, all backed by maintenance records.
Risk reduced
Safety lever
+
Time saved
Review lever
+
Backlog cut
Capital lever
=
Case for approval
Net of cost
What a Capital Review Committee Actually Asks
A digital twin is a live digital model of a dam that combines geometry, instrument readings, inspection findings and analysis. Committees rarely object to the idea. They object to unclear outcomes.
1
Which specific failure modes or deficiencies does this help us detect earlier or manage better?
2
Which regulatory or owner requirements does it make easier to meet and document?
3
What staff time, consultant time or repair cost does it reduce, in numbers we can check?
4
What does it cost to buy, integrate, maintain and keep current over the life of the dam?
5
What happens if we do nothing for another budget cycle?
The sections below answer each question using your own data. No published average can replace a dam-specific baseline, so treat every figure as an input to measure, not a number to borrow.
Lever One: The Safety Risk Case
Most owners already think about dam risk as a combination of how likely an adverse event is and how severe the consequences would be. A twin does not change the consequence downstream. It can improve how early and how clearly you see developing problems.
Detection
Slow trend
Sudden change
Instrument data only
Trends reviewed periodically; drift may be missed between reports
Alerts depend on manual checks and who is watching
Twin with maintenance records
Trends compared with past inspections and repairs automatically
Thresholds trigger a work order and a documented response
Safety evidence to collect before you ask for funding
- Potential failure modes identified in your most recent risk analysis or periodic inspection.
- Instrument readings that were late, missing or hard to interpret in recent years.
- Deficiencies noted in inspection reports and how long each stayed open.
- Emergency action plan updates that depended on slow data gathering.
Present safety benefits as risk-informed reasoning, not as a promise. A twin supports better decisions; it does not replace engineering judgment or inspections.
Connect the Twin to the Work That Fixes Findings
A model that shows a problem is only half the answer. Oxmaint turns inspection findings and instrument alerts into assigned, tracked and closed work orders.
Lever Two: The Compliance and Review Cycle Case
Dam safety is regulated mainly at the state level, with federal oversight for dams owned or licensed by agencies such as FERC-regulated hydropower projects. Requirements for inspections, documentation and emergency planning differ, so confirm your own regulator's expectations.
Gather
Find past reports, drawings, readings and repair history across folders and consultants.
Reconcile
Check that deficiency lists and completed repairs agree between reports.
Analyze
Engineers review trends and decide on findings and recommendations.
Report
Documents are drafted, reviewed and submitted to the regulator or board.
Most review effort sits in the first two steps, where staff collect and reconcile information. That is where a twin and a clean maintenance record save time, because the data is already organized by asset and date.
How to measure review cycle time
- Record staff hours spent assembling information for the last two periodic reviews.
- Record consultant hours billed for data gathering, as separate from engineering analysis.
- Count questions from regulators or reviewers that required follow-up documents.
- Track the days between inspection and a closed, documented response to each finding.
Time saved becomes a dollar figure through loaded labor rates and avoided consultant hours. Keep the calculation visible so committee members can test it.
Lever Three: The Deferred Maintenance Backlog Case
Deferred maintenance on dams grows quietly. Small seepage, concrete deterioration, vegetation, gate wear and instrument faults wait until they become capital projects.
All known deficiencies on the dam
Deficiencies with an asset, cost and priority
Items with a scheduled work order
Items closed with evidence
A common weakness is that the backlog figure is built from reports, not from live work. A CMMS gives each deficiency an owner, a due date and a status, so the backlog number can be defended.
- Convert each inspection finding into a work order or a planned project with a cost estimate.
- Rank items by consequence, condition and how fast the problem is likely to progress.
- Separate routine maintenance from capital items so crews know what they can fix now.
- Report backlog trend each quarter, not just at the annual budget meeting.
Data Quality Comes Before Modeling
The value of a twin depends on trustworthy inputs. Before funding visualization, check that the basic records behind it are complete and current.
Drawings and as-builts
Are they current, searchable and linked to the right structure and component?
Instrument history
Are readings continuous, with calibration dates and notes on faulty devices?
Inspection findings
Are deficiencies uniquely numbered and traced from discovery to closure?
Repair records
Is it clear what was repaired, by whom, when and with what material?
Operating records
Are gate tests, exercise logs and release events captured consistently?
If several of these answers are no, a first investment in structured records may produce more value than a complex model. That is a legitimate and honest conclusion for a capital review.
Maintenance Tasks the Twin Should Trigger
The strongest business cases show a clear chain from observation to action. These examples are typical of what owners track, though each dam has its own program.
Seepage reading moves outside expected range
Work order for inspection of drains, weirs and downstream area, with engineer notification
Instrument fails calibration check
Repair or replacement order, spare part check and a record of data gaps
Gate exercise test shows slow response
Corrective order for the hoist, seals or controls, followed by a retest
Inspection notes vegetation or erosion
Scheduled maintenance task with before and after photos
Concrete cracking is measured over time
Recurring monitoring task and an escalation rule for engineering review
Each link in the chain produces a timestamped record. Over time those records show how quickly the organization identifies, assigns and resolves problems, which is a measurable improvement in itself.
Preparing the Committee Package
- One-page summary stating the problem, the three levers and the requested amount.
- Baseline measurements for review hours, open deficiencies and instrument data gaps.
- A pilot plan with a start date, a single dam and clear success measures.
- A lifetime cost view covering licenses, sensors, calibration and training.
- A risk register listing data quality, adoption and integration concerns.
- A statement of what the investment will not do, including replacing inspections.
Language that builds credibility
Use phrases such as improves visibility, shortens evidence gathering and supports prioritization. Avoid claims that a twin prevents failures or eliminates risk. Reviewers, regulators and engineers will trust a modest, documented claim far more than a broad one.
Attach two or three example records from your current system, such as an inspection finding and its closed work order. Real examples show reviewers what the improved workflow will look like and how much of it already exists.
Include a plan for owner staff. A twin and a maintenance system only create value when inspectors, operators and managers use them every week, so training time and clear roles belong in the budget.
A Business Case Worksheet You Can Complete
| Line item | How to calculate it | Evidence source |
|---|---|---|
| Review labor saved | Hours saved per cycle times loaded hourly rate | Timesheets from recent inspections |
| Consultant time avoided | Data-gathering hours removed times billing rate | Past consultant invoices |
| Earlier repair savings | Cost difference between early repair and later repair for comparable defects | Your own repair history and engineer estimates |
| Backlog reduction | Value of deficiencies closed or re-prioritized | Work order and project records |
| Risk reduction | Change in assessed risk from engineer review | Risk analysis and inspection reports |
| Total cost | Licenses, sensors, integration, training and upkeep | Vendor quotes and internal estimates |
Show conservative, expected and optimistic cases. Committees trust ranges more than a single large number.
Where the Maintenance System Fits in the Twin
Model and visualization
Geometry, imagery and analysis outputs that make the structure easy to understand.
Monitoring data
Piezometers, seepage measurements, deformation and reservoir level readings.
Inspection and maintenance records
Findings, work orders, calibrations, repairs and sign-offs. This is where Oxmaint operates.
The bottom layer is what turns a model into action. Without it, a twin can show a problem but not prove who responded, when and with what result.
Oxmaint capabilities that support the case
- Asset registers for gates, valves, drains, instruments, pumps and access structures.
- Recurring inspection schedules and mobile checklists with photos.
- Work orders for repairs, calibration and vegetation or erosion control.
- Inventory for critical spares such as gate parts and instrument components.
- Reports on open deficiencies, completion rates and maintenance history for audits and reviews.
Measures to Track After Approval
Funding is easier to renew when the first year shows progress against the original case. Choose a small set of measures and report them on a fixed schedule.
| Measure | Why it matters | Where the data comes from |
|---|---|---|
| Open deficiencies by age | Shows whether findings are being resolved or accumulating | Work order and inspection records |
| Days from finding to assigned work | Measures how quickly the organization responds | Work order timestamps |
| Inspection completion on schedule | Shows discipline in recurring checks | Scheduled inspection reports |
| Instrument uptime | Shows the reliability of monitoring data | Calibration and repair orders |
| Hours to assemble review data | Measures the efficiency gain claimed in the case | Staff and consultant time records |
| Preventive-to-corrective ratio | Shows whether maintenance is shifting from reactive to planned | Work order type reports |
Report the same measures every quarter. A consistent series, even with modest early gains, is more convincing than a one-time improvement story.
Prioritizing Dams in a Portfolio
Owners with many dams rarely start everywhere at once. A simple ranking helps decide where a twin and structured maintenance records deliver the most value first.
- Start with dams where downstream consequences are greatest, using your regulator's hazard classification.
- Include dams with long open deficiency lists or repeated instrument problems.
- Consider structures with upcoming periodic inspections or regulatory deadlines.
- Favor sites where staff can capture data on a regular basis.
- Pair larger projects with a neighboring small dam to compare results.
The ranking should be written down and reviewed each year. It gives the committee a clear reason for sequencing and helps avoid the impression that spending is spread evenly without a risk basis.
Risks to the Business Case and How to Address Them
Poor source data
A twin built on outdated drawings or unreliable readings produces confident but wrong views. Budget for data cleanup and instrument checks.
Tool without process
Alerts that nobody owns create noise. Define who responds, how fast and how the response is recorded.
Ongoing cost
Sensors need calibration and models need updates. Include these in the lifetime cost, not only the purchase.
Overstated benefits
Claims that a twin prevents failure will not survive a review. Focus on better information and documented action.
A Phased Path That Keeps Risk Low
Phase 1
Baseline
Build the asset register, load the inspection history and measure current review hours and backlog.
Phase 2
Pilot
Apply the workflow to one dam, converting findings to work orders and tracking closure.
Phase 3
Prove
Compare pilot numbers with the baseline and present the result to the committee.
Phase 4
Scale
Extend to the rest of the portfolio and connect additional monitoring data.
A pilot gives the committee evidence from your own dam, which is usually more persuasive than vendor claims. It also limits spending until the value is shown.
Dam Twin ROI FAQs
Does a digital twin replace dam inspections?
No. It supports inspections and engineering judgment by organizing data. Regulatory inspection requirements still apply.
What is the first number to measure?
Start with staff and consultant hours spent assembling data for your last review, then create a free account to organize records.
Can a CMMS show deferred maintenance reduction?
Yes, by tracking each deficiency as a work order or project with status, cost and closure evidence.
How do we handle several dams?
Use one asset register with dam-level reporting. You can book a demo to see portfolio views.
Which regulator rules apply to us?
That depends on ownership and location, so confirm with your state dam safety program or federal regulator.
Bring Evidence, Not Promises, to Your Next Capital Review
Start building the inspection, deficiency and work order record that makes every dam investment easier to justify and easier to audit.