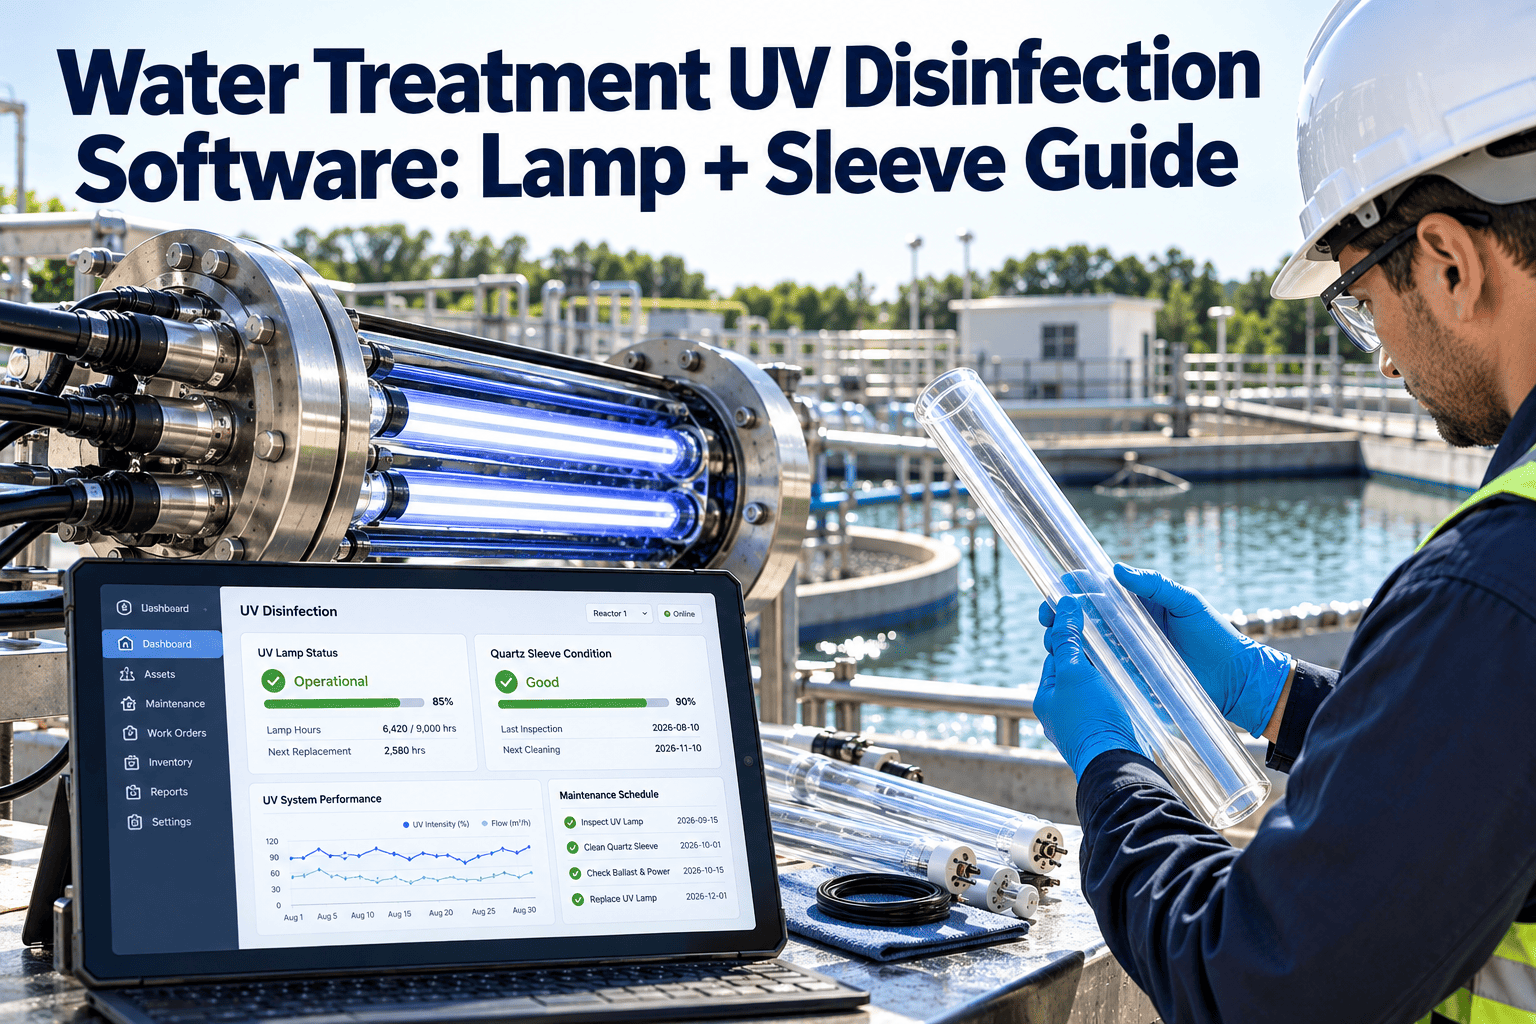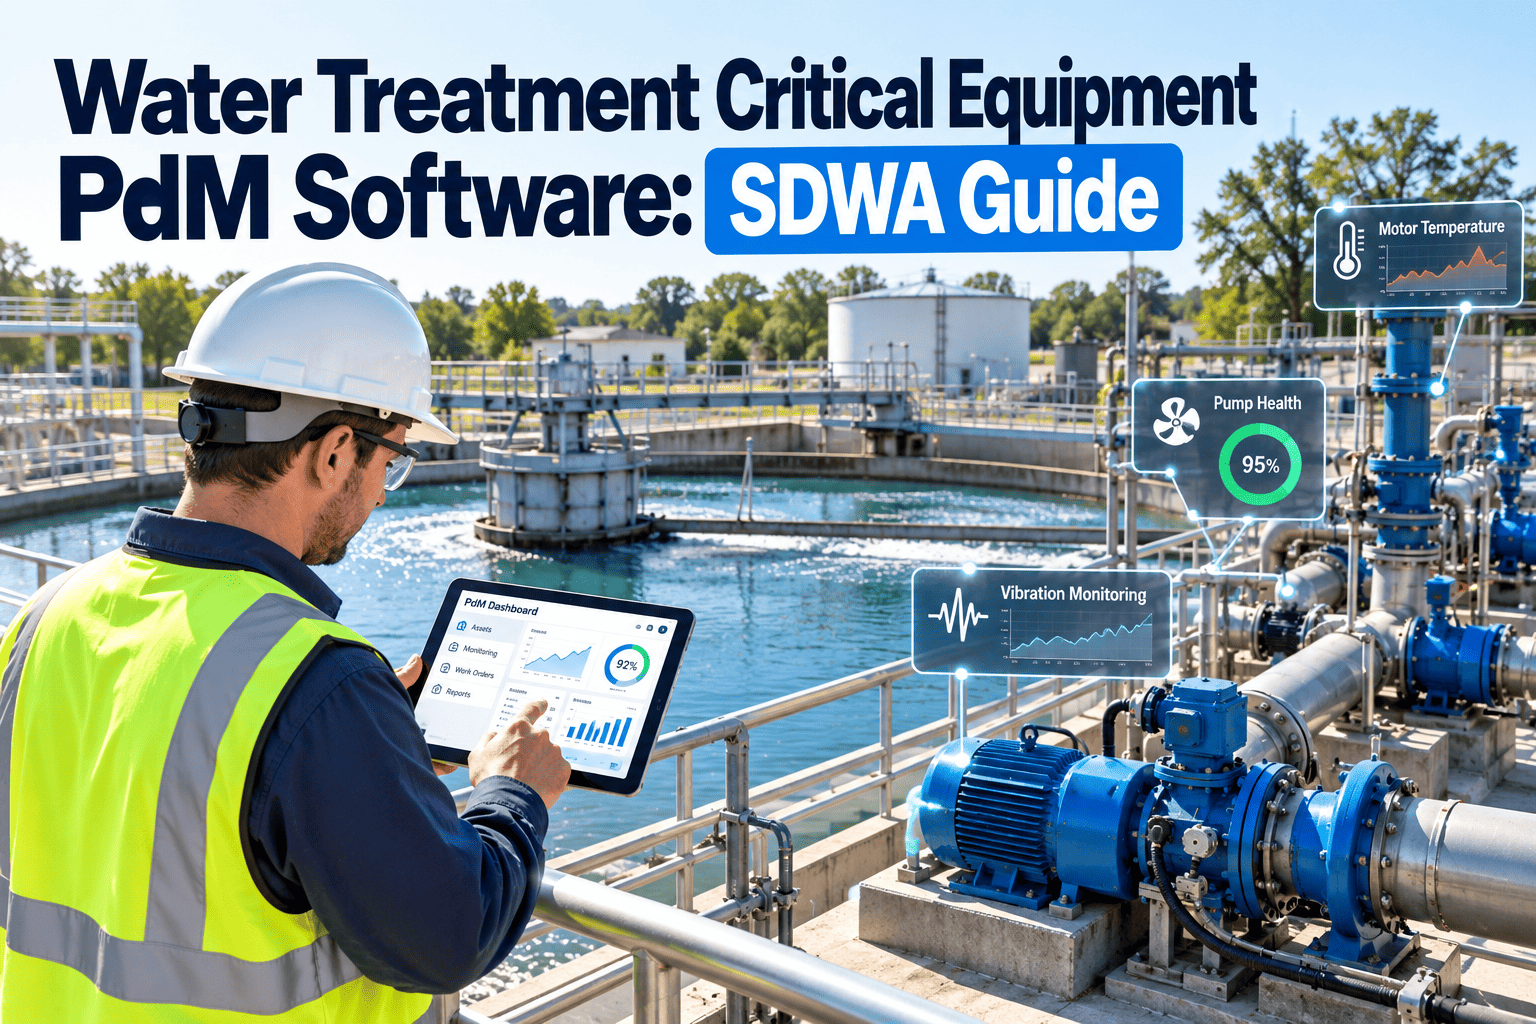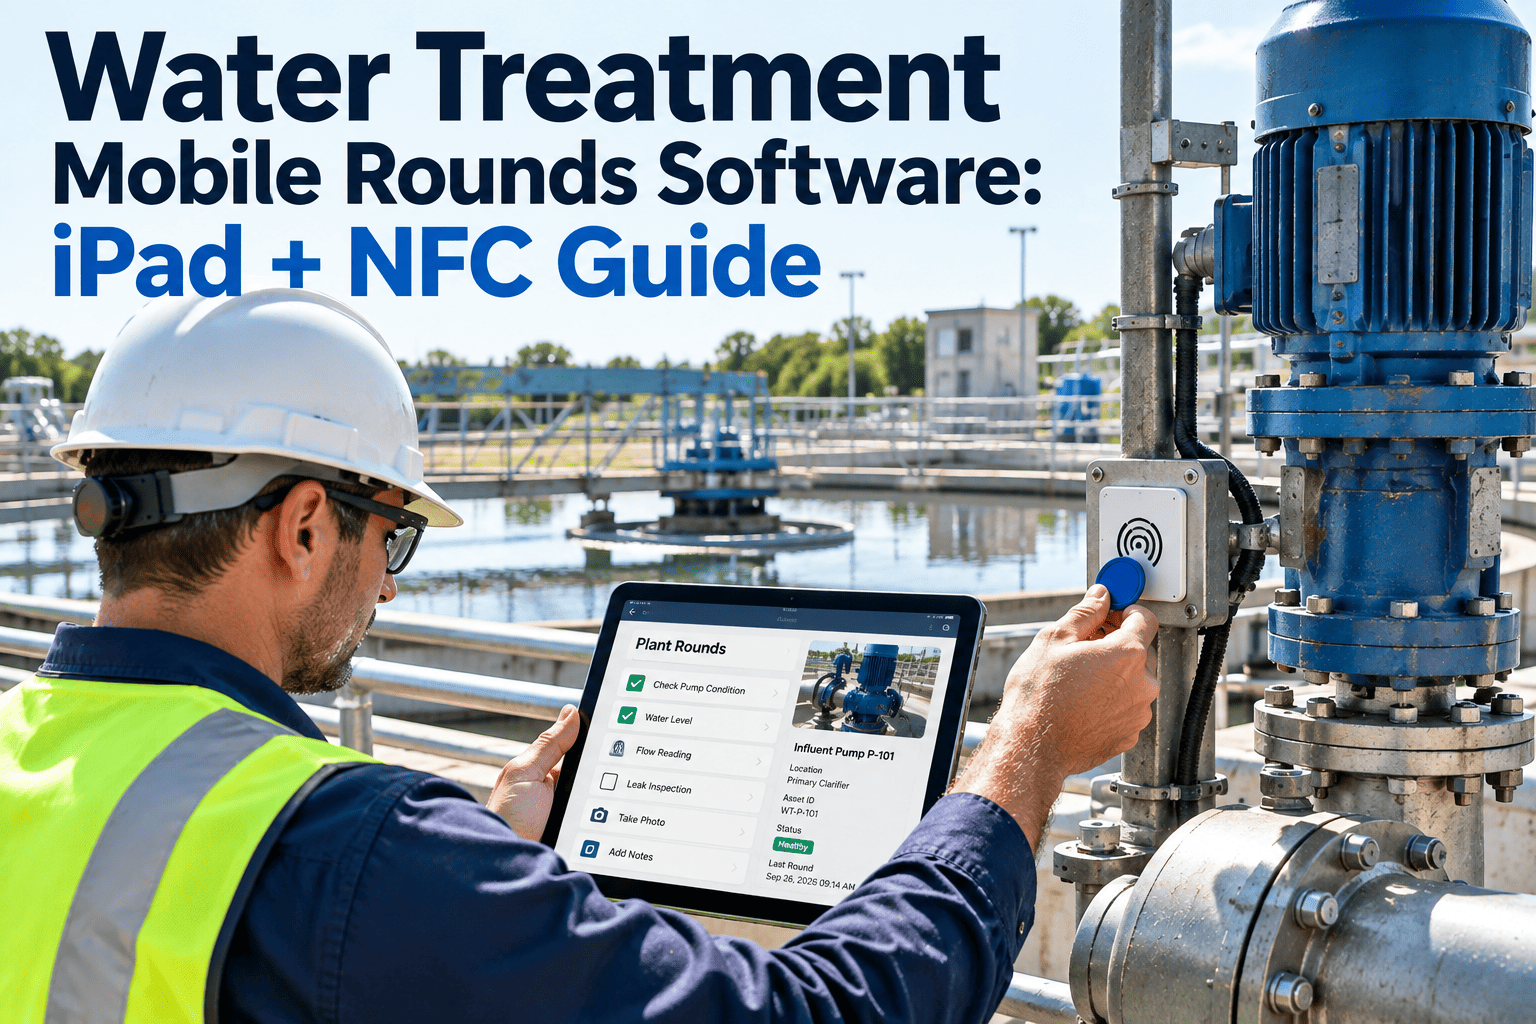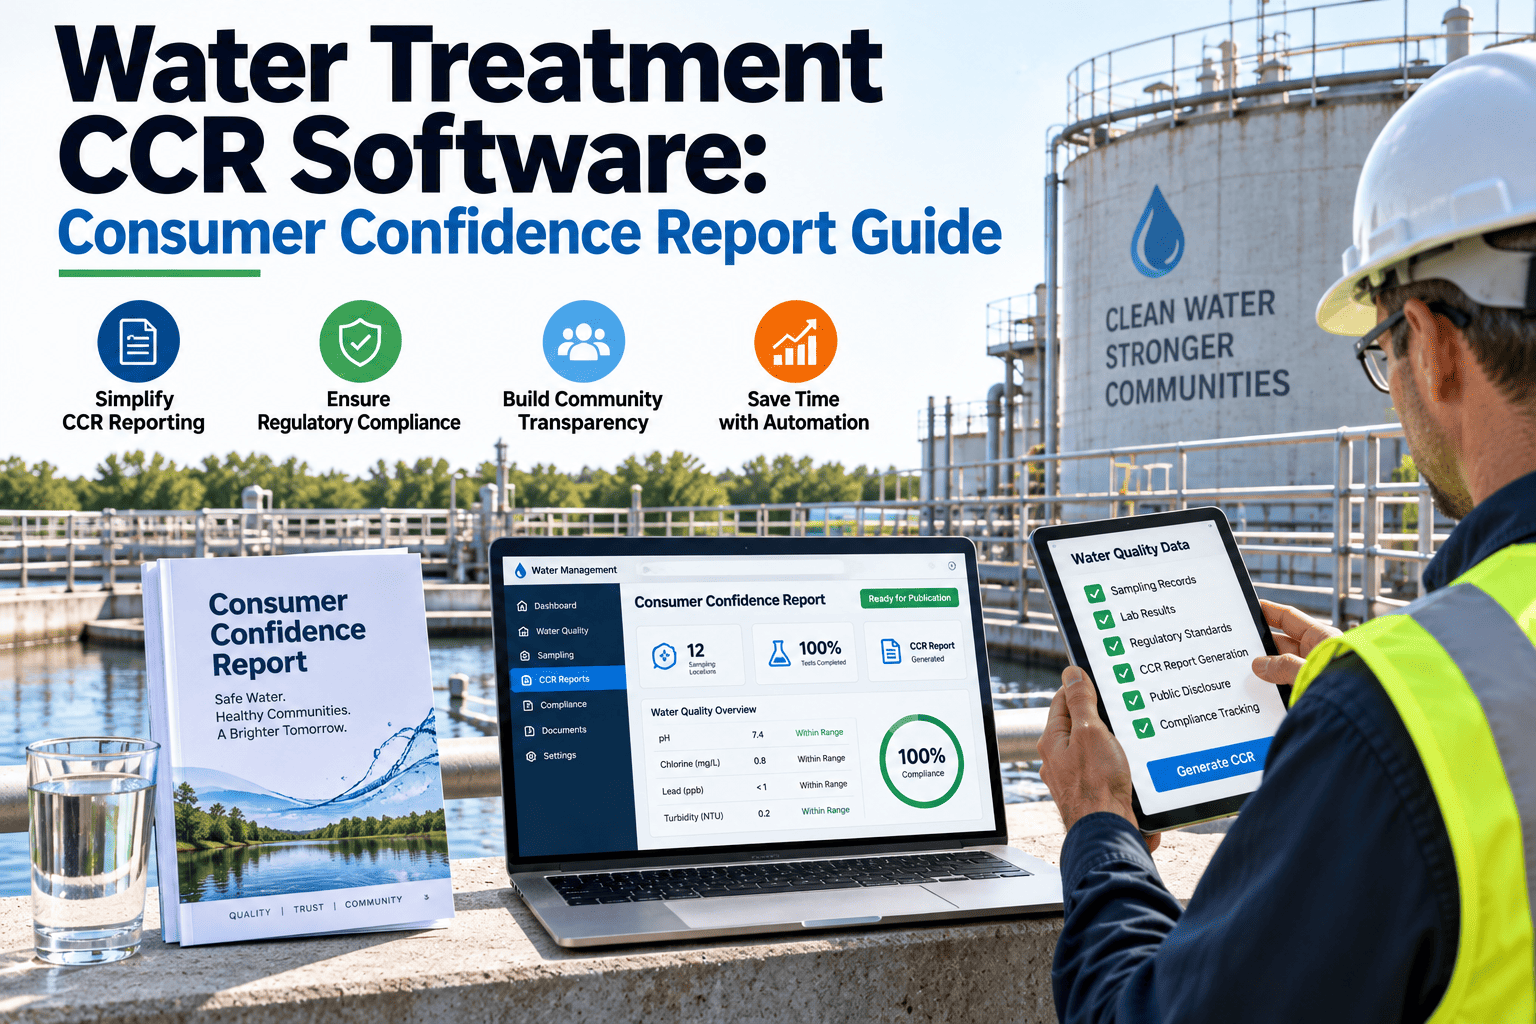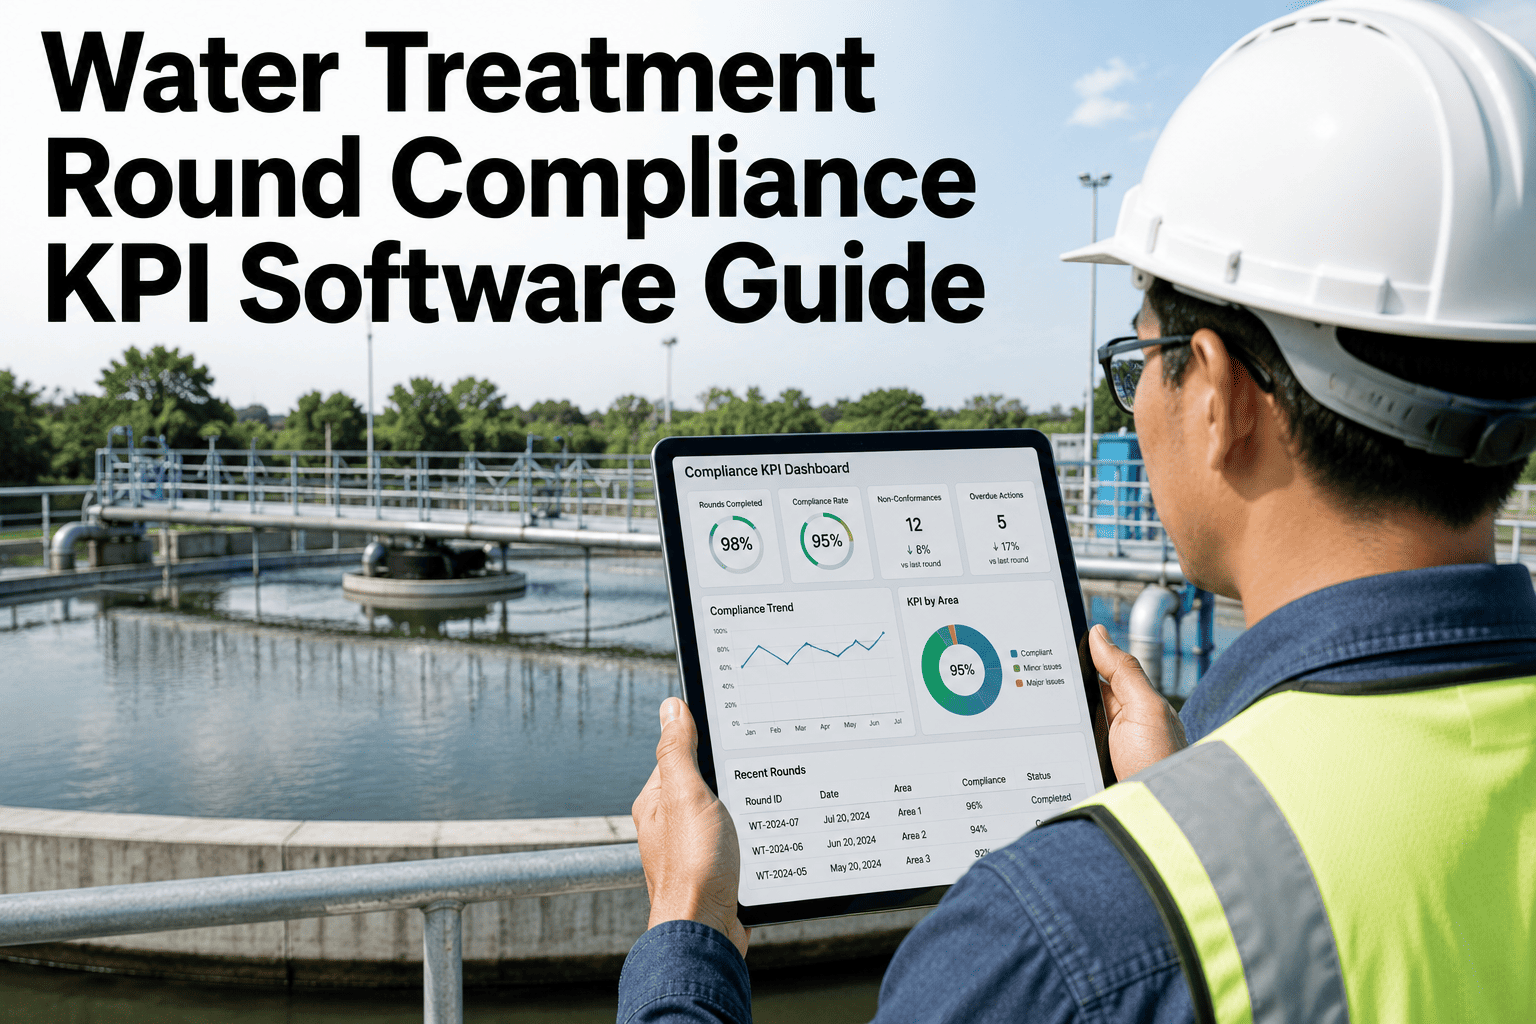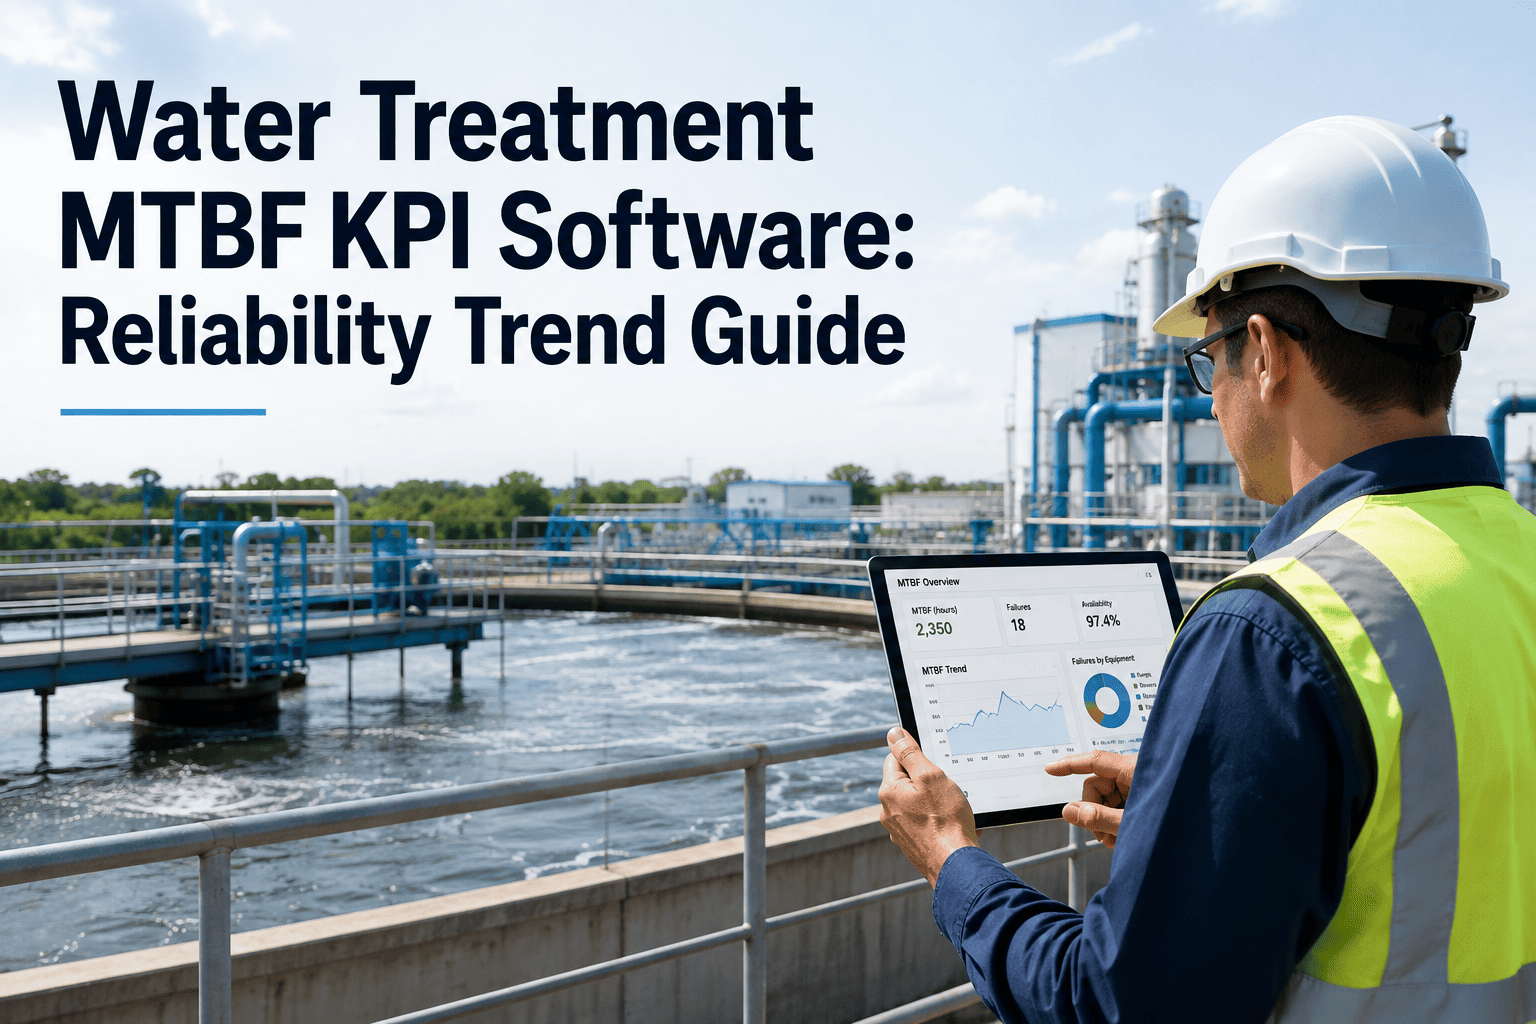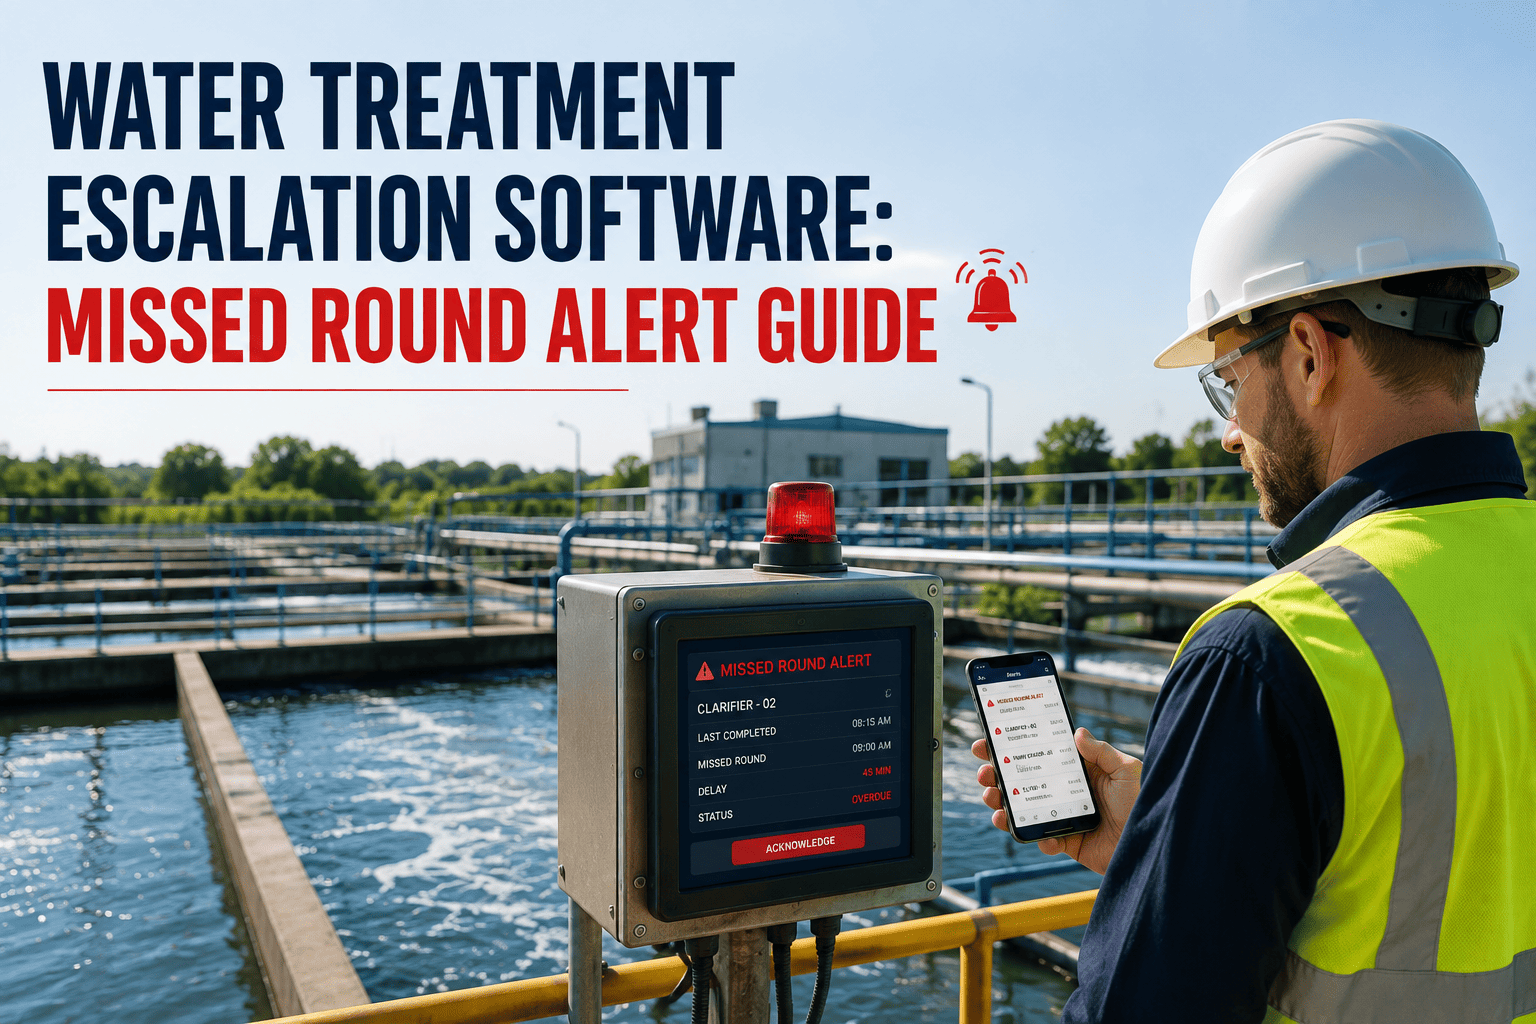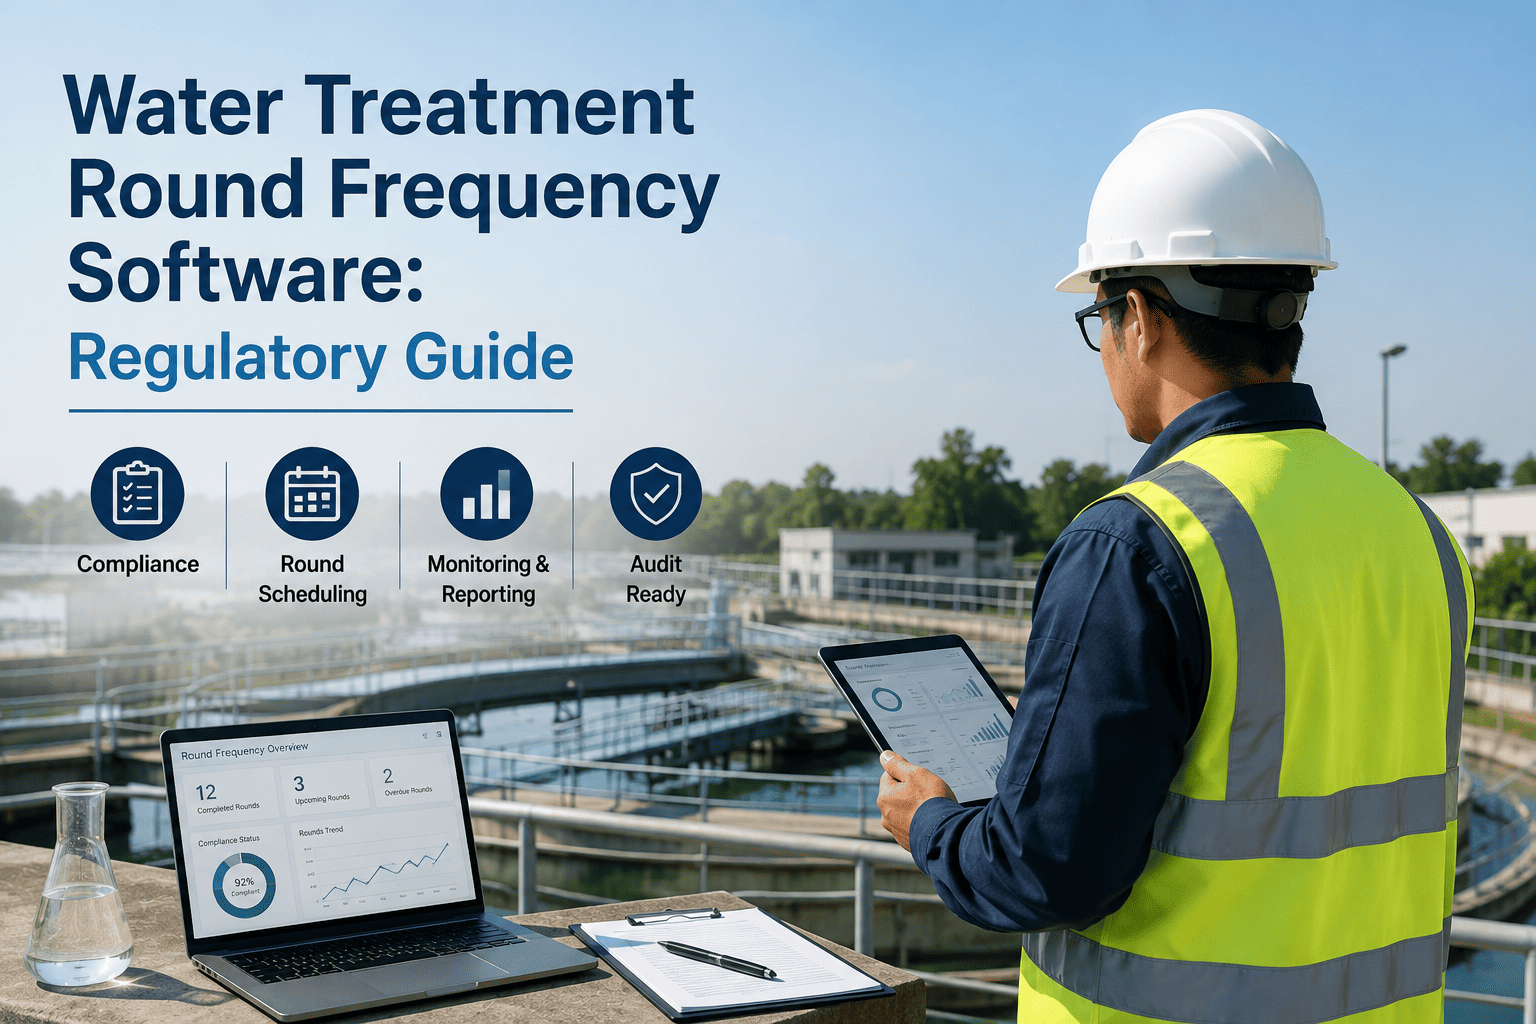
Every shift change at a water treatment plant starts the same way: a stack of round sheets, a row of meter readings, and an operator trying to recall whether this morning's turbidity number looks like last Tuesday's or something new. Multiply that across three shifts a day, dozens of monitoring points, and a full year of rounds, and a plant is sitting on thousands of readings nobody has time to line up side by side. Small drifts in turbidity, chlorine residual, or CT margin rarely show up as one bad reading; they build quietly across rounds until a filter run or a disinfection contact time slips past what the permit allows. That gap between round data captured and round data compared is where most treatment technique violations actually start to form. Water treatment round analytics software closes that gap by pulling every round, every shift, and every parameter into one connected trend line that operators and supervisors can read at a glance, which is why more utilities are running their daily rounds through a connected analytics platform.
Why A Single Round Reading Rarely Tells The Full Story
Regulators and researchers keep finding the same pattern: it is rarely one bad sample that causes a violation, it is a residual or a turbidity number drifting quietly for days before anyone compares it to what came before. These figures show why lining up rounds over time matters as much as recording them.
Why Paper Rounds Catch Bad Readings But Miss Bad Patterns
A single grab sample can look perfectly normal on its own and still be one more step in a slow slide toward a violation. These are the patterns that round-by-round paper logging is least equipped to catch, no matter how carefully each round is filled out, because the problem is not the number on any one sheet, it is the direction those numbers are moving across an entire week.
A fouling filter rarely jumps straight to a violation. Its turbidity output creeps upward round after round, and a reading that looks fine in isolation can already be the fourth or fifth step in a pattern nobody has plotted yet, which is exactly why filter-to-filter comparison matters as much as the single number in front of an operator.
Free chlorine residual can drift downward shift by shift as seasonal demand changes, a feed pump wears, or a dosing set point gets nudged and never reset, and paper logs are rarely compared closely enough to catch the direction before residual sits close to the minimum a permit allows.
As flow rises, baffling efficiency changes, or contact basin levels drop, the CT margin sitting above the regulatory minimum can shrink across several shifts in a row, and a supervisor reviewing one round at a time has no easy way to see that margin closing in until it is uncomfortably thin.
The operator logging the six a.m. round is rarely the one reviewing the six p.m. round, and without a shared trend view, every new shift effectively restarts the pattern-spotting process from a blank page, losing whatever context the previous shift already noticed.
See The Trend Before It Becomes A Violation
OxMaint plots every round against its own history automatically, so a turbidity number that looks normal on its own but abnormal against the trend gets flagged the moment it happens, not the moment someone finally reviews it.
The Parameters A Trend Line Actually Needs
Trend detection is only as good as the data feeding it. These are the readings that matter most across every shift, and the ones that tell the clearest story once they are lined up side by side instead of read one round at a time.
Individual filter effluent turbidity, not just a combined reading, so one fouling filter cannot hide behind the average of a bank that is otherwise performing well.
Residual at the point of application, the entry point, and selected distribution points, tracked together so a creeping dose change shows up before it ever reaches a customer tap.
The calculated contact time credit for the current shift, trended against the regulatory minimum rather than checked only when a single number looks unusual.
Upstream chemistry that quietly drives downstream turbidity and disinfection performance, so a dosing drift can be traced back to its source instead of treated as a mystery.
Rising head loss across a filter run signals the same media fouling that eventually shows up in turbidity, often days before the turbidity trend confirms it on its own.
Actual equipment runtime tied to the same round, so water quality trends and maintenance trends are read from one timeline instead of two disconnected systems.
How Different Roles Read The Same Trend Line
A trend line does not mean the same thing to every person looking at it, and it should not have to. The value of round analytics is that one connected dataset can answer very different questions depending on who is checking it that day.
Sees whether the reading just logged fits the pattern from earlier shifts, so a borderline number gets a second look immediately instead of waiting for a supervisor to notice it later.
Reviews a full day or week across every point at once, catching a slow drift on one filter or one chemical feed line that no single round would have surfaced on its own.
Pulls the same trend history to answer a state inspector's question about a specific date, or to justify why reduced monitoring is still appropriate, without reconstructing records from paper.
Recorded Rounds vs Connected Rounds
The difference between a round sheet and a trend line is not extra paperwork, it is whether today's reading gets compared automatically to yesterday's, last week's, and last shift's, instead of standing alone.
| Question | Manual Round Tracking | Analytics-Driven Tracking |
|---|---|---|
| How is a turbidity drift caught? | Noticed only once a single reading breaches the limit | Flagged the moment a filter deviates from its own rolling trend |
| How is chlorine creep noticed? | Reviewed only when residual nears the minimum | Tracked shift over shift with an early deviation alert |
| How are shift logs compared? | Paper handoff and operator memory | Same dashboard, timestamped and lined up automatically |
| How is CT margin monitored? | Recalculated by hand each shift | Auto-calculated and trended against the regulatory minimum |
| How fast does a pattern reach a supervisor? | End of week or end of month review | Flagged in real time as the round is logged |
Where Trend Detection Pays Off Fastest
Not every plant needs trend detection for the same reason. These are the moments where a connected view of round history tends to make the biggest difference first.
An inspector asking for a month of turbidity or chlorine history gets a pulled report instead of a search through binders, with the trend already visible.
Corrosion control parameters tracked over time make it easier to show whether treatment changes are holding steady as inventory work continues.
A logged history of stable results attached to every sample record supports a reduced monitoring request far better than memory alone.
As PFAS treatment and reporting deadlines take shape, a plant already trending its data has a baseline ready the moment a new parameter is added.
How A Single Round Becomes A Usable Trend
Trend detection is not a separate task bolted onto rounds, it is what happens automatically once rounds are captured the same way, by every shift, every single time, without asking operators to do anything more than the round they already walk.
Replacing the paper sheet with a mobile checklist that captures the same fields, in the same order, on every shift.
Logging turbidity, chlorine, pH, pressure, and flow together so nothing gets skipped when a round runs long or short-staffed.
Letting the system learn what a typical reading looks like for each point, on each shift, before flagging anything as unusual.
Comparing every new reading against its own trend line and the regulatory limit, not only against a single pass or fail threshold.
Turning a flagged pattern into an assigned corrective task instead of a note that sits in a logbook until the next audit.
Turn Every Round Into A Data Point That Works For You
OxMaint connects rounds, lab results, and equipment data into one trend view, so operators spend less time re-checking old sheets and more time acting on what the data is already showing them.
Frequently Asked Questions
What counts as trend detection versus routine round monitoring?
Does trend analytics replace SCADA and lab testing?
How much history does a plant need before trends become useful?
Can a small utility with one or two operators use round analytics?
What happens once a trend is flagged?
Stop Reading Rounds One At A Time
Every turbidity reading, chlorine residual, and CT value your plant logs this year can sit in one connected trend view instead of a stack of separate sheets scattered across shifts. See what your own round data looks like once every reading is finally compared against the ones that came before it.