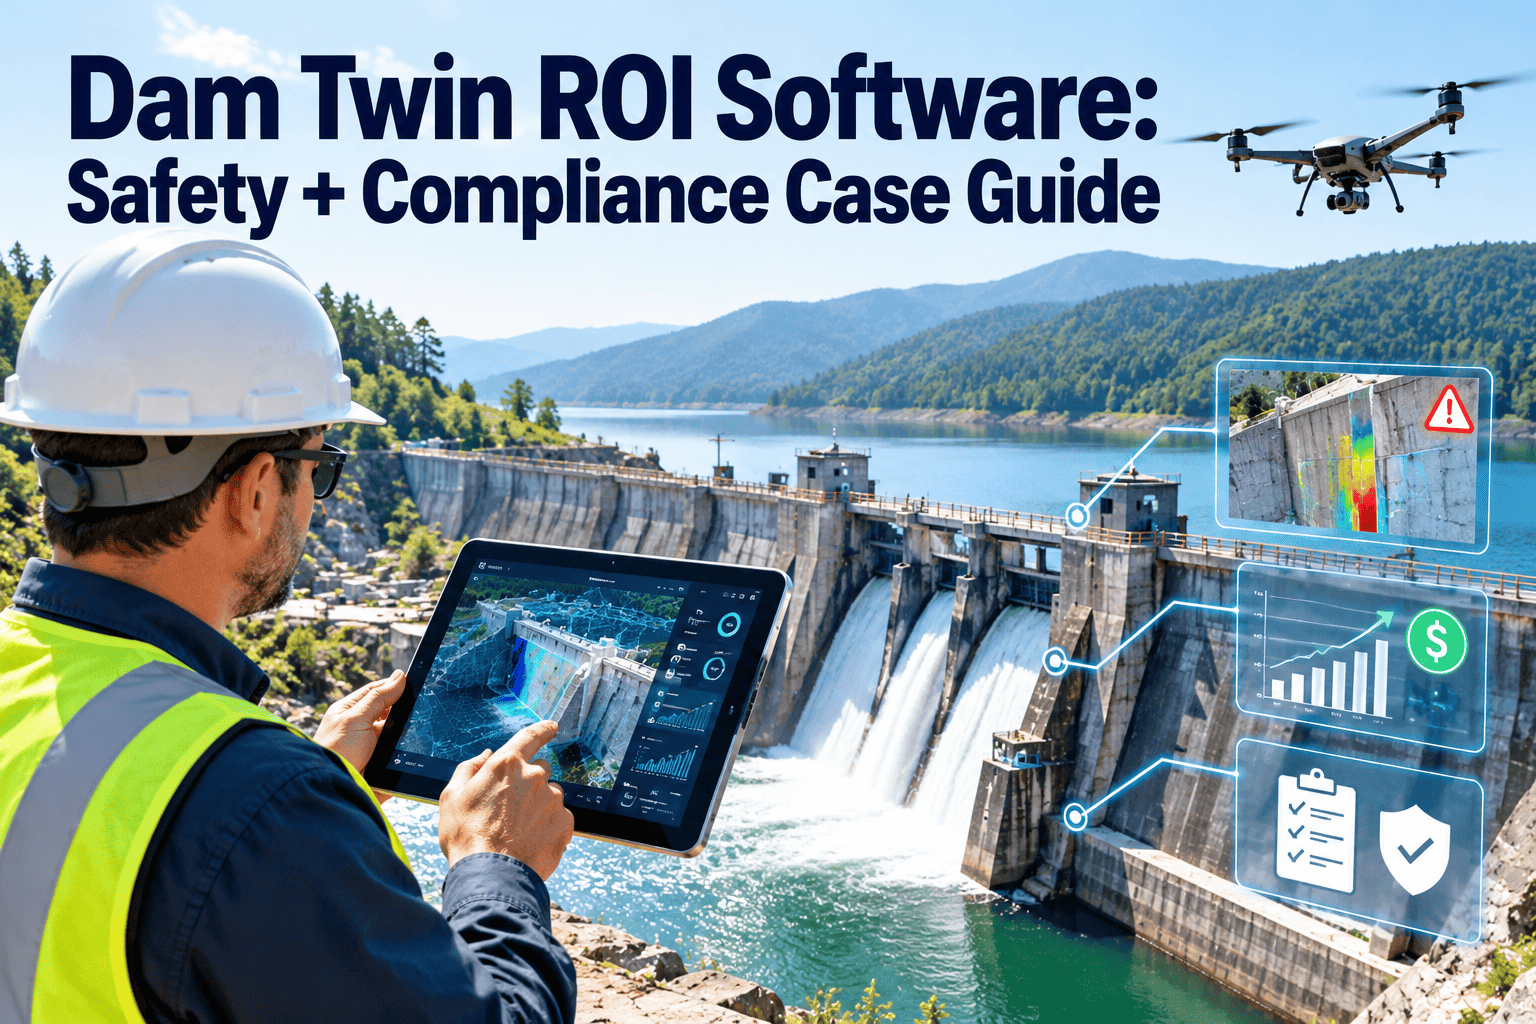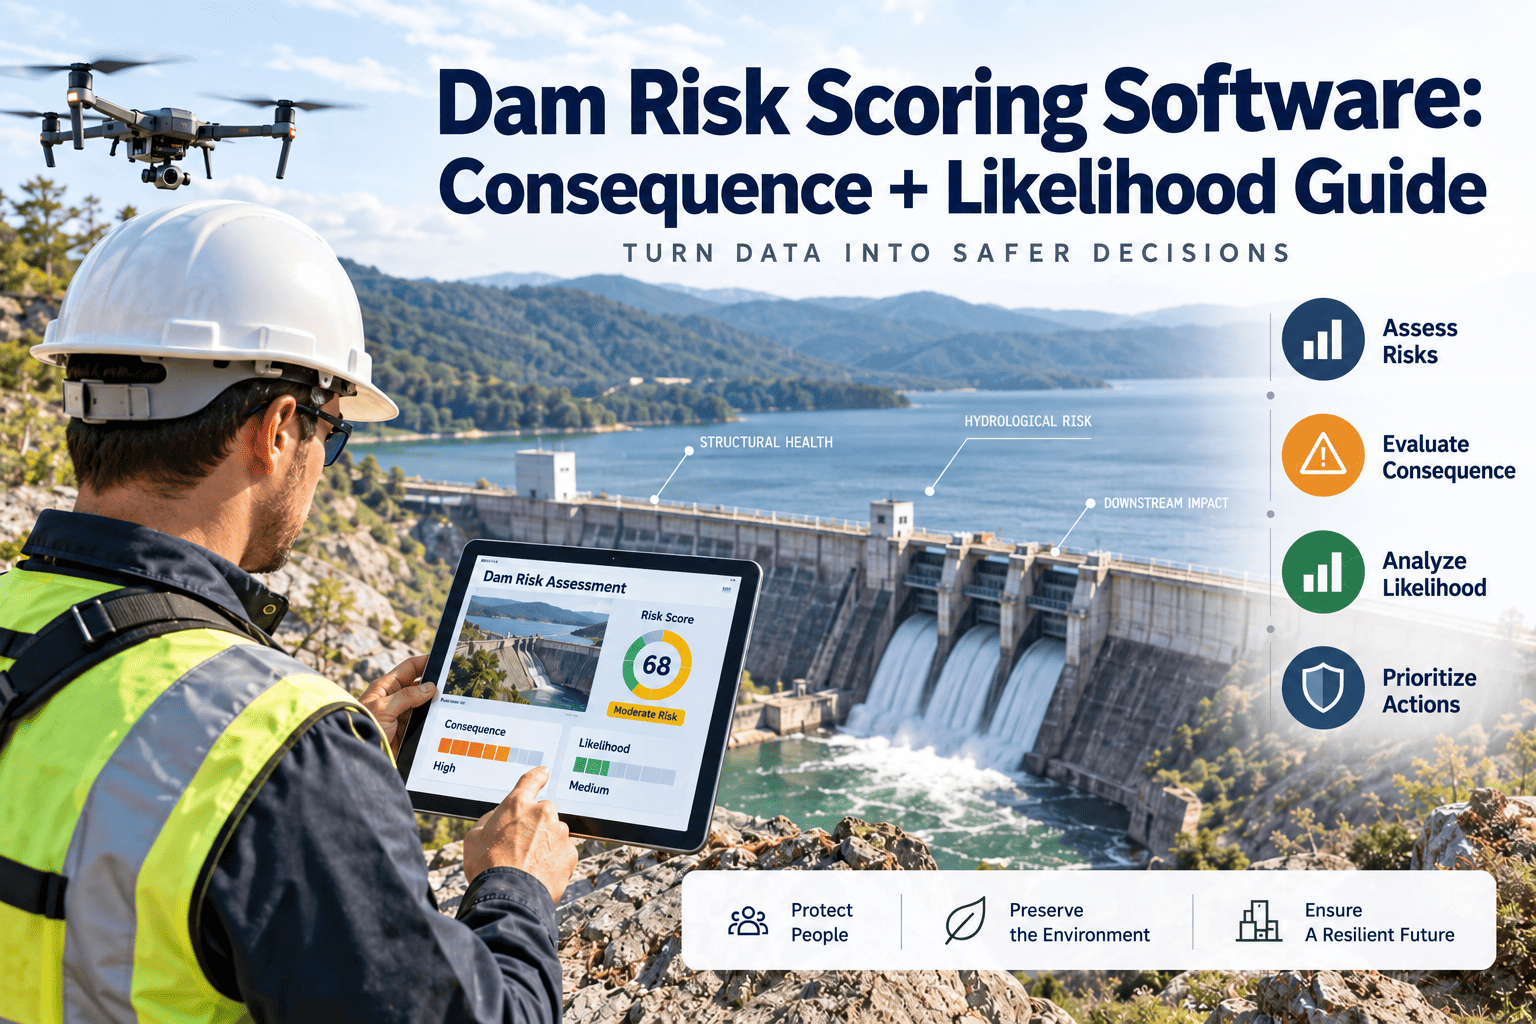
Dam safety programs are shifting away from pass/fail inspection checklists toward risk-informed decision making — ranking every structure by what would happen if it failed, not just how it looks today. That shift is exactly what the Bureau of Reclamation and a growing number of state dam safety offices have built their programs around, and it is why a defensible consequence times likelihood score is becoming the backbone of every serious dam safety budget request. Owners who cannot produce that score on demand are increasingly the ones explaining themselves after an incident, not before one — which is where a dam-specific CMMS workflow earns its place in the program.
If a downstream reviewer asked for your dam's consequence-times-likelihood score right now, could you produce it?
Reclamation's Safety of Dams program and a majority of state dam safety offices now run on risk-informed decision making — not condition ratings alone. This guide shows how to build a consequence and likelihood scoring workflow inside a CMMS, per potential failure mode, with an audit trail behind every number.
A dam in "satisfactory" condition can still carry unacceptable risk
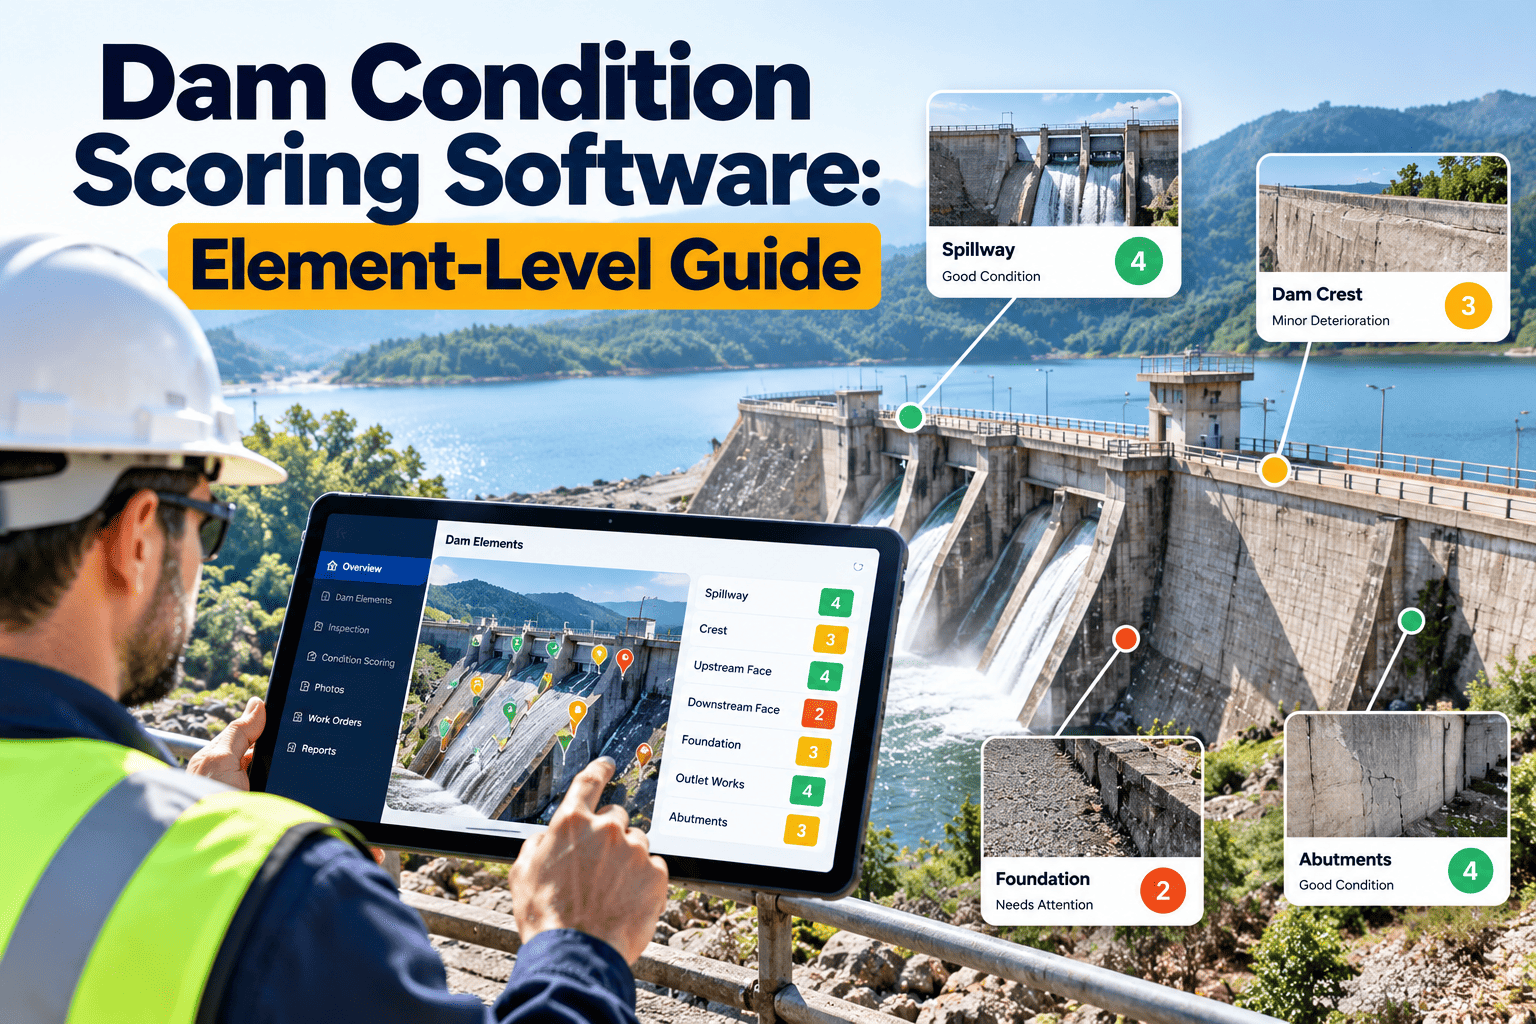
Condition ratings describe the structure today. Risk describes what happens downstream tomorrow if a specific failure mode plays out — and those are two different questions with two different answers.
A dam's hazard classification is fixed by what sits downstream, not by the structure's physical condition. That is precisely why risk-informed programs score consequence and likelihood as separate, multiplied factors rather than folding everything into a single condition grade.
Risk is likelihood times consequence — the Reclamation definition
The Bureau of Reclamation's own guidelines define risk plainly: the product of the probability of an adverse event and the severity of its consequences, evaluated across every credible failure scenario. That definition is the reason a defensible dam risk score cannot be a single subjective number typed into a spreadsheet once a year.
Reclamation's own Consequence Estimating Methodology (RCEM) — the tool the agency uses to support its Safety of Dams risk analyses — bases life-loss estimates on flood severity and warning time drawn from documented dam-failure and flood case histories, reviewed by a risk analysis team rather than assigned by one engineer working alone.
Why "one score per dam" is the wrong resolution
A single embankment dam typically carries several distinct potential failure modes, each with its own likelihood and its own consequence profile. Scoring the dam as a whole hides the one PFM that actually drives the risk.
Internal Erosion / Piping
Progressive seepage through the embankment or foundation. Tracked in a CMMS through piezometer readings, seepage-flow logs, and turbidity observations tied to a recurring inspection work order.
Overtopping
Spillway or freeboard inadequacy during extreme inflow. Likelihood updates when hydrologic loading assumptions or spillway condition assessments change.
Spillway / Gate Failure
Mechanical or structural failure of spillway gates and appurtenant structures, tracked through corrective work order history and gate-operability testing records.
Foundation / Seismic
Liquefaction or foundation instability under seismic loading. Likelihood is periodically re-evaluated as geotechnical assessments and regional seismic hazard data are updated.
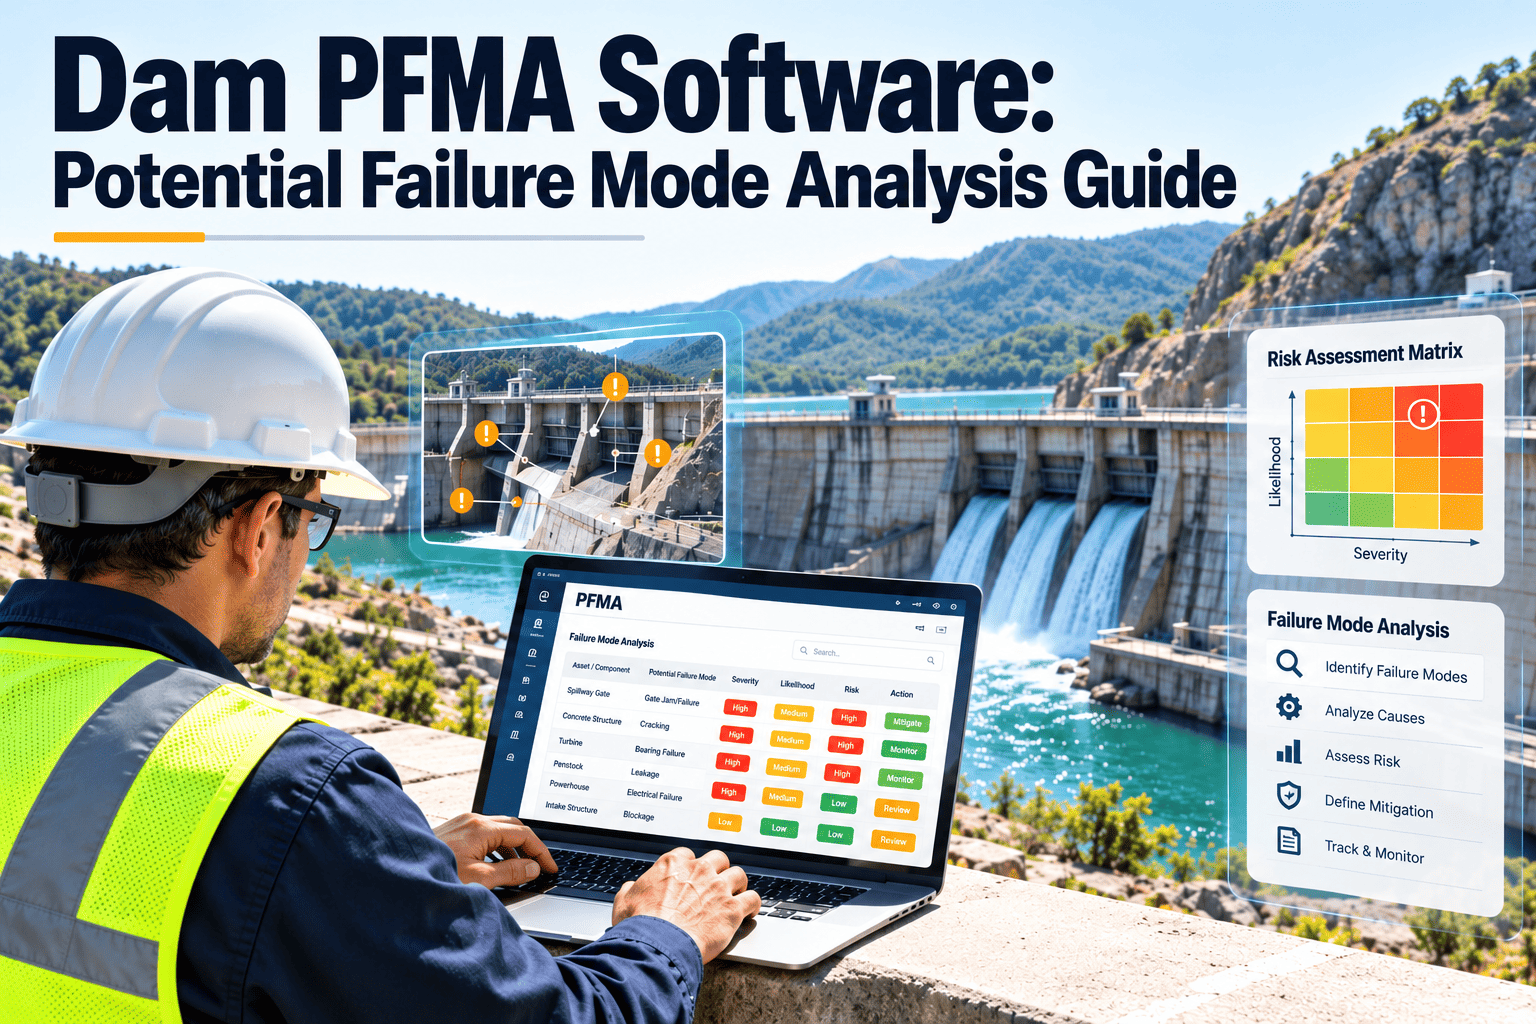
A CMMS that stores each PFM as its own scored record — with its own inspection cadence, its own instrumentation thresholds, and its own likelihood-consequence pairing — lets a dam safety engineer see which specific failure path is driving a structure's overall risk ranking, instead of guessing from a single blended grade.
Replace the annual spreadsheet with a live risk register
Score every potential failure mode, attach the instrumentation data behind each likelihood estimate, and generate a ranked portfolio view your review board can actually defend.
What actually feeds the consequence half of the score
Consequence estimation is where dam risk analysis differs most from ordinary facility risk work — it depends on hydraulic modeling and population data, not just asset condition.
| Consequence Input | Source Data | What It Drives |
|---|---|---|
| Inundation extent | Breach and dam-break flood modeling | Population and structures at risk downstream |
| Flood severity (depth × velocity) | Hydraulic modeling of the breach flood wave | Fatality rate selection, per Reclamation's RCEM approach |
| Warning time | Emergency Action Plan, detection and notification lag | Evacuation success and life-loss estimate |
| Downstream development | Population-at-risk surveys, land-use records | Hazard classification and economic consequence estimate |
This is also why hazard classification tends to rise over time even when a dam's physical condition does not change — as the Association of State Dam Safety Officials has documented, growth in downstream development is the primary driver behind the expanding count of high-hazard-potential dams nationwide. A CMMS that links each dam record to its current EAP and downstream population data keeps the consequence side of the score current as that development happens, instead of stale until the next multi-year reassessment.
The backlog risk scoring is meant to prioritize against
Risk scoring only matters if it changes which dam gets funded first. The scale of the national backlog is why that prioritization discipline has become non-negotiable for owners managing more than a handful of structures.
Turning a risk register into a maintenance and inspection program
A risk score that lives apart from the maintenance system tends to age out of date within a year. The four steps below are how programs keep the two connected inside a single CMMS.
Register every dam and its potential failure modes
Each dam becomes a parent asset record; each PFM becomes a linked sub-record carrying its own likelihood estimate, monitoring instrumentation, and consequence profile.
Attach instrumentation and inspection data to each PFM
Piezometer readings, seepage logs, gate operability tests, and visual inspection findings are logged against the specific failure mode they inform, not against the dam generically.
Calculate and rank the portfolio
Likelihood × consequence is calculated per PFM, rolled up to a dam-level and portfolio-level ranking, and refreshed automatically as new inspection or instrumentation data arrives.
Generate preventive and corrective work orders from the ranking
The highest-risk PFMs drive scheduled inspection intervals and corrective work order priority automatically, with every action logged against the dam's compliance record.
A CMMS built for the maintenance side of the risk register
Oxmaint does not replace an engineer's hydraulic modeling or the formal Potential Failure Mode Analysis process — it gives the dam safety and O&M team a place to operationalize the outputs of that process day to day.
Asset hierarchy by dam and PFM
Model each dam as a parent asset with individual PFM sub-assets, so likelihood, consequence, and inspection history stay attached to the right failure path.
Preventive maintenance scheduling
Set inspection intervals — visual, instrumentation, gate operability — by hazard classification and risk score, with automatic recurrence.
Mobile field inspections
Capture piezometer readings, seepage observations, and visual inspection findings from the field, timestamped and attached to the correct PFM record.
Compliance and audit records
Maintain a defensible history of every inspection, corrective action, and risk score change for state dam safety office and Reclamation review.
Corrective work order tracking
Convert flagged instrumentation trends or inspection findings into corrective work orders with full traceability back to the PFM that triggered them.
Portfolio dashboards
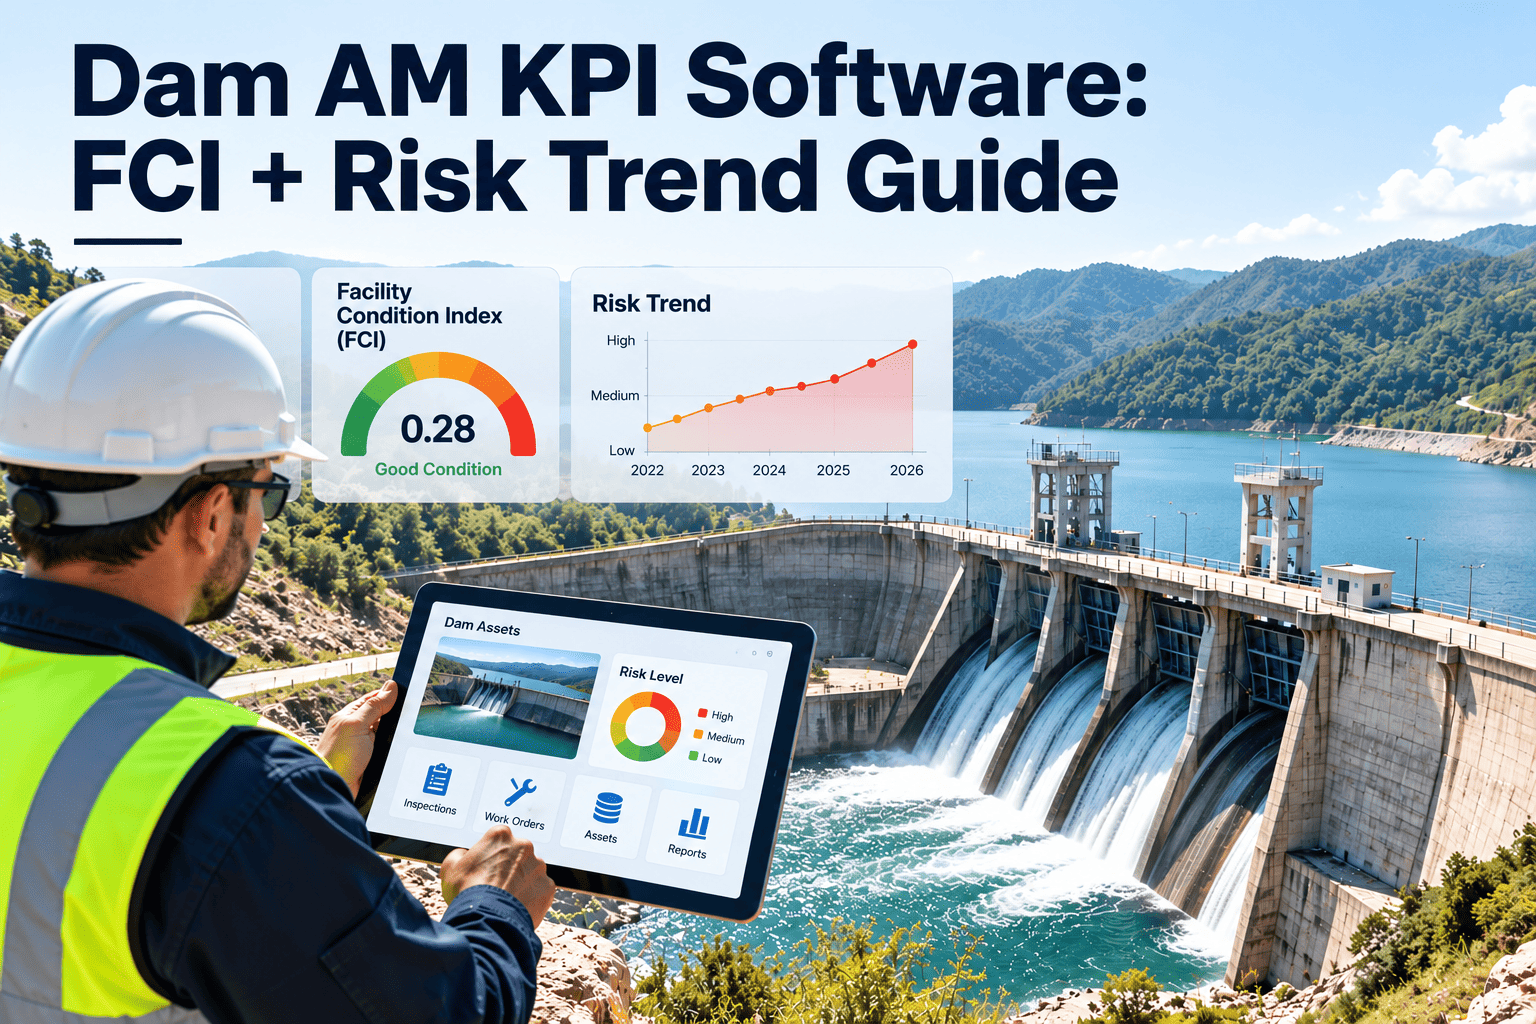
Roll every dam's risk score into a single ranked view, filterable by hazard classification, owner, or governing regulator, for capital planning conversations.
State programs are converging on the same risk-informed logic
Reclamation's Safety of Dams program pioneered formal risk analysis for federal structures, but the approach has since spread well beyond the roughly 360 high- and significant-hazard dams Reclamation itself owns. State dam safety offices — which together regulate the vast majority of the nation's dams — increasingly reference the same likelihood-times-consequence logic when prioritizing limited inspection and rehabilitation dollars.
This convergence matters for owners of state-regulated dams for a practical reason: reviewers and funding agencies are getting used to seeing risk expressed this way, and a submission that still relies on a single subjective condition grade increasingly stands out as the exception rather than the norm. A CMMS that structures data around potential failure modes from the start makes it far easier to produce a submission in the format reviewers now expect, rather than translating an informal spreadsheet after the fact.
| Ownership Type | Approximate Share of NID Dams | Typical Risk Documentation Expectation |
|---|---|---|
| Private | ~66% | Emergency Action Plan plus state-required inspection and condition reporting |
| Local government | ~20% | Condition rating plus hazard classification review on a periodic cycle |
| State | ~7% | Formal risk analysis increasingly requested for high-hazard structures |
| Federal | ~4% | Full potential-failure-mode risk analysis, reviewed by an independent panel |
Regardless of ownership category, the direction of travel is the same: more structured documentation, scored per failure mode, refreshed more often than an annual review cycle. Owners who build that habit into a CMMS now are better positioned as state programs continue tightening their own reporting requirements.
Where dam risk scoring efforts stall before they reach a review board
Most programs that attempt risk scoring do not fail because the formula is wrong — they fail because the supporting data never makes it into a system that can be queried, updated, and defended on short notice.
Scores live in a one-time consultant report
A formal risk analysis is completed, filed as a PDF, and never updated until the next multi-year reassessment — even as new instrumentation readings would justify a change.
Instrumentation data sits outside the risk record
Piezometer and seepage readings are logged in a separate monitoring system with no link back to the likelihood estimate they should be informing.
Consequence data goes stale
Downstream population and development figures are not revisited as growth occurs, understating consequence — and therefore risk — for years at a time.
No single portfolio view
Individual dam files exist, but nothing rolls them into one ranked list, so capital requests are built dam by dam instead of against the full portfolio's relative risk.
Each of these pitfalls is a data-architecture problem rather than an engineering one — which is exactly the layer a CMMS is built to solve, sitting underneath the formal risk analysis process rather than replacing it.
Dam risk scoring — five common questions
What is the difference between hazard classification and risk score?
Hazard classification (low, significant, high) describes what would happen downstream if the dam failed, regardless of condition. A risk score multiplies that consequence by the actual probability of failure for a specific potential failure mode — two dams with the same hazard classification can carry very different risk scores.
Do I need hydraulic modeling before I can start scoring risk in a CMMS?
Full breach and inundation modeling strengthens the consequence estimate, but a CMMS can track interim consequence categories and likelihood indicators immediately, then refine the score as formal modeling is completed by your engineer of record.
How often should potential failure mode likelihoods be reassessed?
Most programs formally reassess PFM likelihoods on a multi-year cycle aligned with periodic inspections, but update the supporting instrumentation data continuously so a trend — rising seepage, for example — can trigger an off-cycle review.
Can a CMMS support both state-regulated and Reclamation dams?
Yes — the asset, inspection, and risk-record structure is the same regardless of regulator; what changes is the specific compliance documentation and reporting format each program requires, which can be configured per dam. Book a Demo to review your regulator's specific requirements.
How does this help justify capital funding requests?
A ranked, instrumented risk register gives reviewers and legislators a transparent basis for prioritization instead of anecdote — the same discipline state dam safety officials cite when estimating the national repair backlog. Start a free trial to build your first ranked register.
Score every potential failure mode. Rank the whole portfolio. Defend the number.
Import your dam inventory, attach each potential failure mode, and generate a ranked, audit-ready risk register your review board can approve.
Free 14-day trial · No credit card