Deferred maintenance in the public sector is not a budget line item that holds still — it is a compounding liability that grows by an estimated 7% every year it goes unaddressed. Across the United States, the accumulated deferred maintenance backlog for government infrastructure now exceeds $1 trillion, and federal building repair backlogs alone more than doubled from $171 billion to $370 billion between fiscal years 2017 and 2024. The core problem is not the existence of deferred items — every government agency defers some work — but the absence of structured systems that define, measure, and report the backlog so that leadership can fund it before failure. When deferred maintenance lives in spreadsheets and institutional memory instead of a centralized work order system, it becomes invisible to the budget process and compounds into crisis. OxMaint gives government asset managers the tracking, measurement, and reporting infrastructure that converts invisible backlogs into funded capital plans.
Infrastructure Asset Management · Government Operations
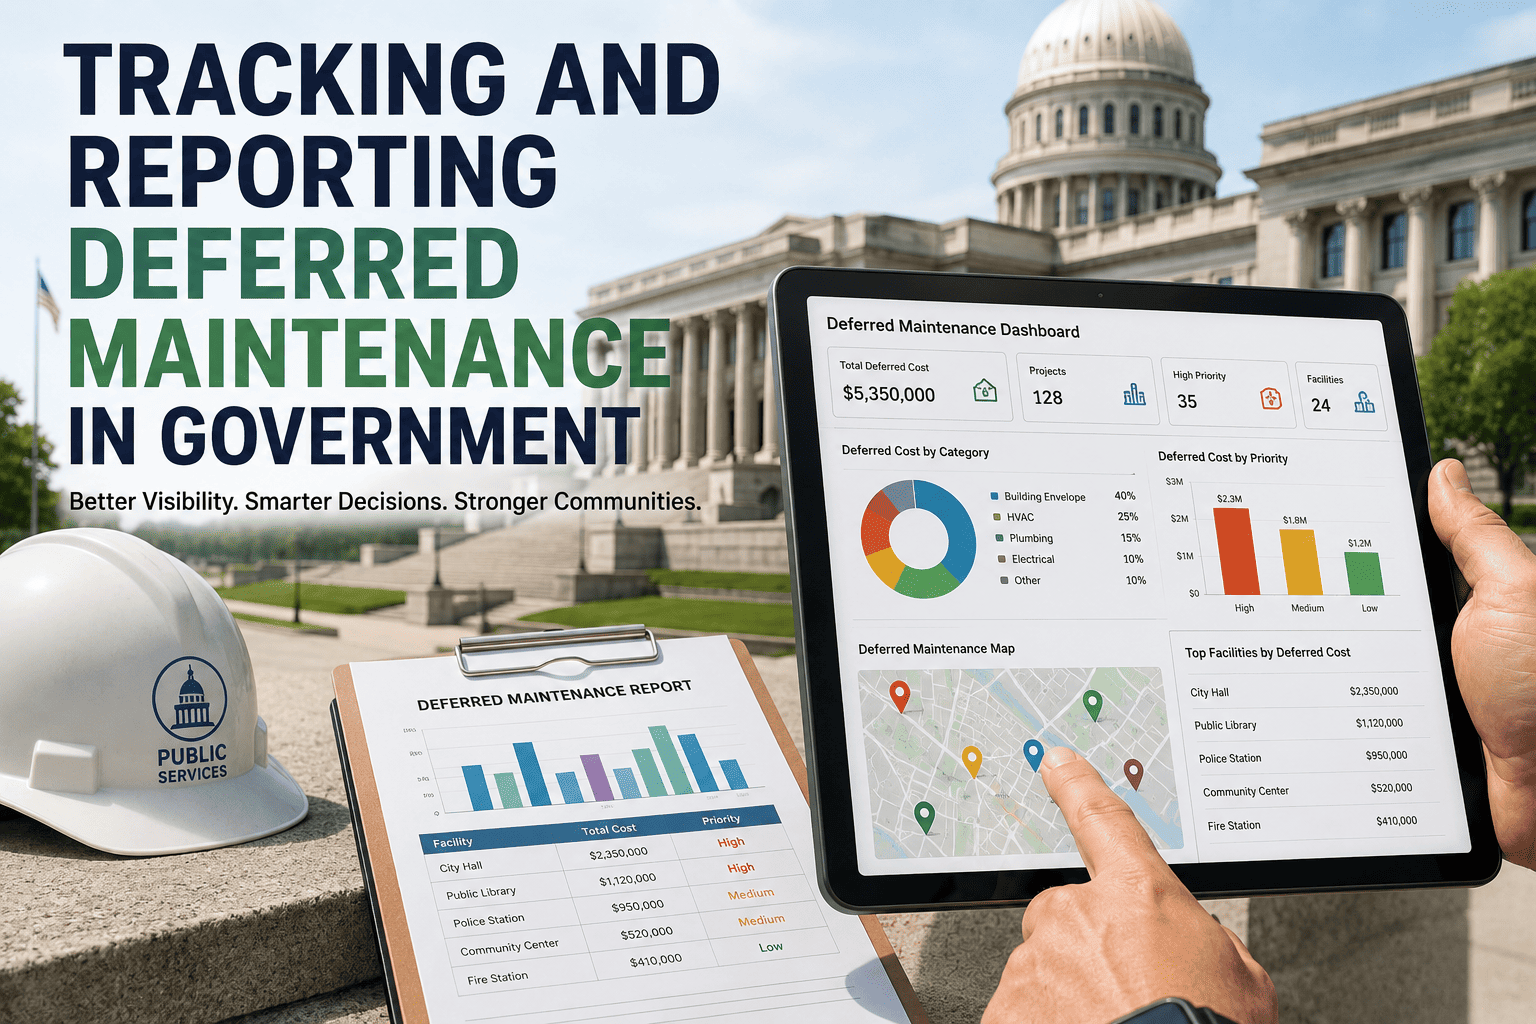
Tracking and Reporting Deferred Maintenance in Government
How to define, measure, and report your deferred maintenance backlog so leadership funds repairs before they become emergencies — with real FCI data, not estimates.
$1T+
Total US public infrastructure deferred maintenance backlog
7%
Annual compound rate at which deferred repair costs escalate
$370B
Federal building repair backlog as of FY 2024 — doubled since 2017
88%
Capital request approval rate when backed by FCI condition data
Why Unmeasured Deferred Maintenance Compounds Into Crisis
Every dollar of maintenance deferred today generates four to eight dollars in future repair cost. The compounding is not theoretical — it is driven by five documented mechanisms that operate simultaneously once a repair is postponed past its scheduled window.
Year 0
$10,000
Original scheduled repair — planned, budgeted, minimal disruption to operations
Year 3
$12,250
Deterioration compounds at 7% annually — protective coatings fail, moisture enters
Year 5
$14,025
Adjacent systems begin taking damage — single-system repair becomes multi-system scope
Year 8
$40,000–$70,000
Emergency replacement required — after-hours labor, expedited procurement, service disruption costs
Five Pillars of a Government Deferred Maintenance Tracking Program
Research from the Volcker Alliance and Pew Charitable Trusts found that states with effective deferred maintenance programs share five structural practices. Without all five, backlogs remain invisible to budget decision-makers and continue compounding.
01
Standardized Definition
Define precisely when maintenance qualifies as "deferred" — what asset categories are included, what condition threshold triggers classification, and which department is responsible for documentation. Without a consistent definition, agencies cannot compare backlogs or aggregate them into a portfolio-level number.
02
Complete Asset Inventory
Every building, structure, road segment, and utility system in the government portfolio must exist in a centralized asset register with current replacement value, age, and condition rating. OxMaint's asset register captures these fields at setup and updates them with every completed work order and inspection.
03
Condition Assessment Process
Scheduled facility condition assessments — using mobile inspection checklists with photo documentation — score each asset's systems and calculate the Facility Condition Index. OxMaint's mobile inspections feed directly into FCI calculation without a separate assessment contract.
04
Prioritization Framework
Not every deferred item carries equal risk. A prioritization matrix scores each item by safety impact, mission criticality, cost escalation rate, and regulatory compliance exposure — converting a flat backlog list into a ranked capital investment plan.
05
Consistent Budget Reporting
Deferred maintenance totals must appear in capital budget documents with year-over-year trending, appropriation tracking, and FCI benchmarks. OxMaint generates these reports automatically from work order and inspection data — no manual spreadsheet assembly required.
Facility Condition Index — The Metric That Gets Budgets Approved
The Facility Condition Index is the industry-standard formula that converts deferred maintenance costs into a single comparable percentage. FCI equals the total deferred maintenance cost divided by the current replacement value of the asset. A capital request backed by FCI scores and trending data carries an 88% approval rate — versus 47% for requests supported only by estimates.
| FCI Score |
Condition Rating |
What It Means |
Action Required |
| Below 0.05 |
Good |
Deferred maintenance is under 5% of building replacement value — asset is well-maintained |
Continue preventive maintenance program; monitor for emerging items |
| 0.05 – 0.10 |
Fair |
Backlog is growing — some systems approaching end-of-life without funded replacement |
Increase PM frequency; include in next capital improvement plan cycle |
| 0.10 – 0.30 |
Poor |
Significant backlog — multiple systems need repair or replacement to maintain operations |
Prioritized capital investment required; submit for council or board funding |
| Above 0.30 |
Critical |
Deferred maintenance exceeds 30% of replacement value — replacement may be more cost-effective |
Refurbish-versus-replace analysis mandatory before further investment |
Calculate Your Portfolio FCI From Live Maintenance Data
Every closed work order in OxMaint reduces your deferred maintenance backlog and recalculates system-level FCI automatically. Build capital plans on this week's data — not last year's assessment report.
What an Effective Deferred Maintenance Report Includes
Budget committees reject maintenance requests that arrive as flat dollar figures without context. The reports that secure funding share a consistent structure — one that OxMaint generates automatically from work order and inspection data.
A
Portfolio Summary
Total deferred maintenance liability across all buildings, year-over-year change, and portfolio-level FCI score with trendline
B
Building-Level Ranking
Each facility ranked by FCI score with deferred maintenance cost, replacement value, and condition trajectory — worst-first prioritization
C
System-Level Breakdown
Deferred items categorized by building system — HVAC, roofing, electrical, plumbing, structural — showing which systems are consuming the most backlog
D
Cost Escalation Projections
What today's $500K backlog becomes at 7% annual compounding — presented as a 5-year and 10-year projection that shows the cost of continued deferral
E
Funded vs. Unfunded Analysis
Clear comparison of what was appropriated versus what the condition data says is needed — the gap that budget committees need to see quantified
F
Prioritized Capital Request
Ranked project list with safety scores, regulatory compliance flags, mission criticality ratings, and recommended funding phasing across budget cycles
Expert Perspective
The real problem with deferred maintenance in government is not that we do not know things need fixing — it is that the backlog has no number attached to it. When I present a capital request to the city council with a flat dollar figure and no condition data, the approval rate is a coin flip. When I present the same request with FCI scores, a five-year cost escalation curve, and a building-by-building ranking generated from twelve months of work order data, the conversation changes entirely. The council stops debating whether the money is needed and starts debating the phasing. That shift — from justifying the need to planning the spend — only happens when deferred maintenance is tracked in a system that produces defensible numbers, not estimated in a spreadsheet once a year.
Frequently Asked Questions
How does OxMaint define and classify deferred maintenance for government agencies?
OxMaint uses the FASAB definition — maintenance and repairs that were not performed when scheduled and are postponed to a future period. Any work order that passes its scheduled date without completion is automatically reclassified as deferred and added to the backlog register with cost-to-correct and asset replacement value for FCI calculation.
Start tracking your deferred backlog with a standardized classification from day one.
Can OxMaint calculate Facility Condition Index automatically from work order data?
Yes — every closed corrective work order removes a documented deficiency from the backlog, and every inspection that logs a new condition issue adds to it. OxMaint calculates FCI at the system, building, and portfolio level using live data rather than point-in-time assessment snapshots.
Book a demo to see FCI scoring calculated live from real asset data.
What reports does OxMaint generate for council or board budget presentations?
OxMaint generates portfolio-level deferred maintenance summaries, building-by-building FCI rankings, system-level backlog breakdowns, year-over-year trending, and cost escalation projections. All reports pull directly from work order and inspection data — no manual spreadsheet assembly.
See the reporting suite in a live walkthrough.
How do we get started if our agency has no existing digital asset inventory?
OxMaint supports phased implementation — start with your highest-priority buildings, load them into the asset register with replacement values and known condition issues, and begin generating FCI scores from the first round of inspections. The backlog register builds itself as work orders accumulate.
Start your free trial and begin building your asset inventory today.
Does OxMaint support multi-department asset sharing for government organizations?
Yes — government agencies often share buildings across departments with separate maintenance responsibilities. OxMaint supports department-specific work order queues and visibility controls while maintaining a single consolidated asset record and FCI score at the building level.
Book a demo to discuss your department structure.
Turn Your Deferred Maintenance Backlog Into a Funded Capital Plan
OxMaint gives government asset managers the deferred maintenance tracking, FCI scoring, and capital reporting tools that convert invisible backlogs into approved budgets. Talk to our public sector team about your building portfolio and reporting requirements.