A city with forty public buildings and a five-year capital plan usually has one number missing from the conversation: how bad is each building's condition, expressed in a way a finance committee can actually compare across a fire station, a library, and a wastewater office. That number is the Facility Condition Index, and most public agencies still calculate it once every three to five years from a spreadsheet that goes stale within months. The gap between "we think the roof needs work" and "this building carries a 34% FCI and should move ahead of the parking structure in next year's bond request" is the difference between a capital request that gets tabled and one that gets funded. This guide walks through how the FCI is scored under APPA benchmarks, why public portfolios lose track of it between assessments, and how a connected CMMS keeps the score current instead of frozen at whatever it was during the last consultant visit.
Government FCI Software: Score Every Public Building the Way Finance Committees Expect
FCI turns a deferred maintenance backlog into a single percentage every building can be ranked against — Good, Fair, or Poor. OxMaint keeps that percentage live across your whole portfolio, recalculated every time a work order closes instead of waiting for the next facility condition assessment.
What the Facility Condition Index Actually Scores
FCI is a ratio, not an opinion. It divides the dollar cost of a building's deferred maintenance and repair needs by its current replacement value — what it would cost to rebuild that facility today, not its tax value or its original construction cost.
Both halves of that ratio decay independently, which is where most agencies lose accuracy. Current replacement value has to be re-indexed for construction inflation every year — a figure that has moved 5 to 7 percent annually in recent cycles — or the denominator understates true rebuild cost and the score reads artificially healthy.
Where the Deferred Maintenance Number Comes From
Deferred maintenance cost, the numerator, is built from a facility condition assessment: a physical, system-by-system inspection that documents every deficiency, assigns a repair or replacement cost to it, and rolls those costs up into a single figure for the building. The assessment itself is only as accurate as the cost estimates behind it, which is why agencies that outsource condition assessments to a consultant every few years often see the number swing sharply from one cycle to the next — not because the building changed that much, but because estimating methodology changed between assessments.
Why Public Agencies Adopted FCI in the First Place
FCI was first published by NACUBO in 1991 as a way for university facilities officers to justify capital requests with something more defensible than a list of complaints. APPA later adopted it as a core facilities performance indicator, and it has since become the common language between facilities staff, finance offices, and elected bodies across higher education, K-12 districts, municipal government, and federal agencies.
Why the Ratio, Not the Dollar Figure, Matters
The reason it spread beyond universities is straightforward: a percentage is comparable across very different buildings in a way a raw dollar figure never is. A $2 million backlog on a small branch library sounds alarming until it's expressed as a 55% FCI against a building worth $3.6 million to rebuild — at which point replacement, not repair, becomes the obvious conversation. The same $2 million backlog on a $40 million public safety complex reads as an 5% FCI, a routine maintenance conversation rather than a crisis. Without the ratio, both buildings would compete for attention using nothing but the size of their dollar figure, and the smaller, more urgent problem would consistently lose.
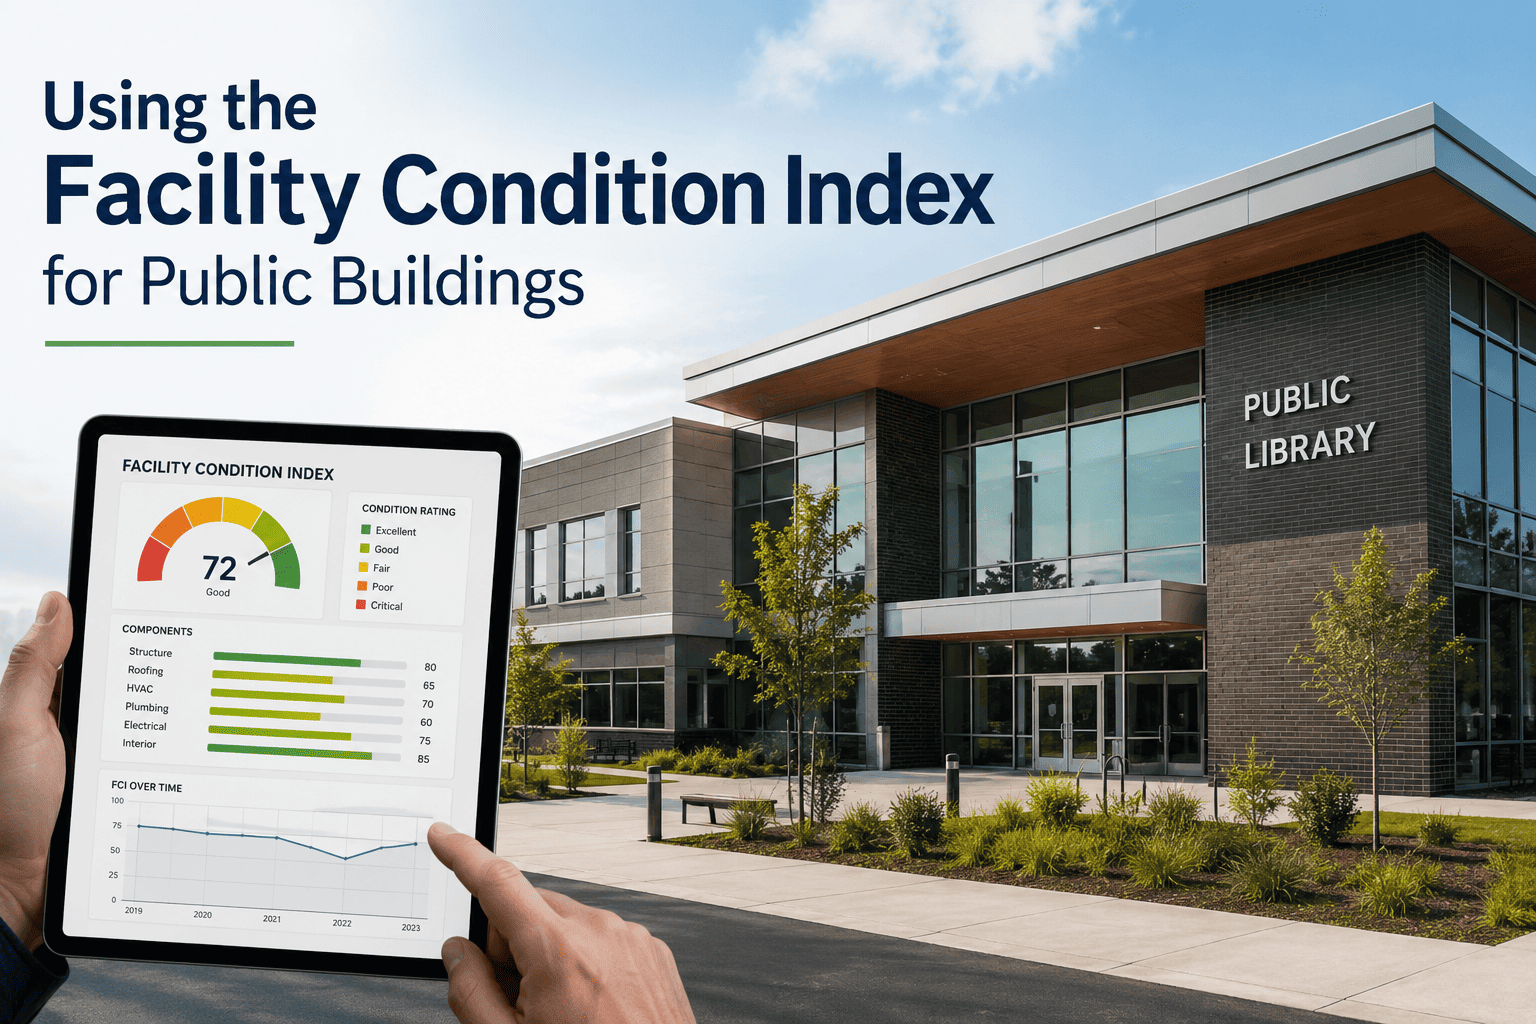
The Four Condition Bands Every Capital Plan Should Track
| FCI Range | Condition | What It Means for the Building | Typical Capital Action |
|---|---|---|---|
| Under 10% | Good | Minor, routine deficiencies only | Sustain with preventive maintenance |
| 10% – 30% | Fair | Systems aging, some approaching end of life | Begin targeted 3–5 year capital planning |
| 30% – 60% | Poor | Multiple systems failing or near failure | Prioritized renovation or major system replacement |
| Above 60% | Critical | Repair cost approaches full rebuild cost | Evaluate replacement, consolidation, or disposal |
Public agencies frequently tighten these bands further based on mission criticality — a fire station or emergency operations center may be flagged for action well before it reaches the general "Fair" threshold, because the cost of a service disruption outweighs the cost of early intervention.
The Two-Thirds Replacement Rule
There's also a widely cited rule of thumb sitting above the "Critical" band that most public capital policies eventually reference: once repair costs reach roughly two-thirds of full replacement value, continued repair stops being the financially defensible choice. It's not a hard rule — a historically significant courthouse might justify repair well past that point — but for a standard administrative building or a mid-life mechanical room, an FCI approaching 60% to 65% is usually the point where a capital committee should be asking about replacement rather than another repair appropriation.
Why the Score Goes Stale Between Assessments
- The assessment is a snapshot, not a feed. A facility condition assessment happens once, gets typed into a report, and is treated as current until the next one — often three to five years later, during which every completed repair and every new deficiency goes untracked.
- Replacement value drifts silently. If nobody re-indexes current replacement value for inflation each year, the FCI understates real condition and a building that should have moved into "Fair" still reads as "Good."
- Work order history lives somewhere else. When completed repairs sit in a separate maintenance log instead of feeding the FCI calculation, the score never reflects the work that's already been done.
- System-level detail gets flattened. A single portfolio-wide FCI hides which system — roof, HVAC, electrical, structural — is actually driving the score up, which is exactly the detail a capital committee asks for.
- Portfolio ranking has to be rebuilt by hand. Comparing forty buildings against each other to decide which capital project moves first means re-sorting a spreadsheet every budget cycle instead of pulling a live ranked list.
The practical result shows up at budget time. A facilities director walks into a capital committee meeting with a number that was accurate eighteen months ago, gets asked a pointed question about a specific building system, and has no way to answer it without going back to the original assessment report. That single moment — the inability to answer a follow-up question with current data — is usually what turns a routine capital request into a tabled item pushed to next year's cycle, while the underlying deterioration keeps compounding in the meantime.
Stop Presenting a Number From Three Years Ago
OxMaint recalculates FCI as deficiencies are logged and work orders close, so the score in front of your finance committee reflects the building today — not the building at the last assessment.
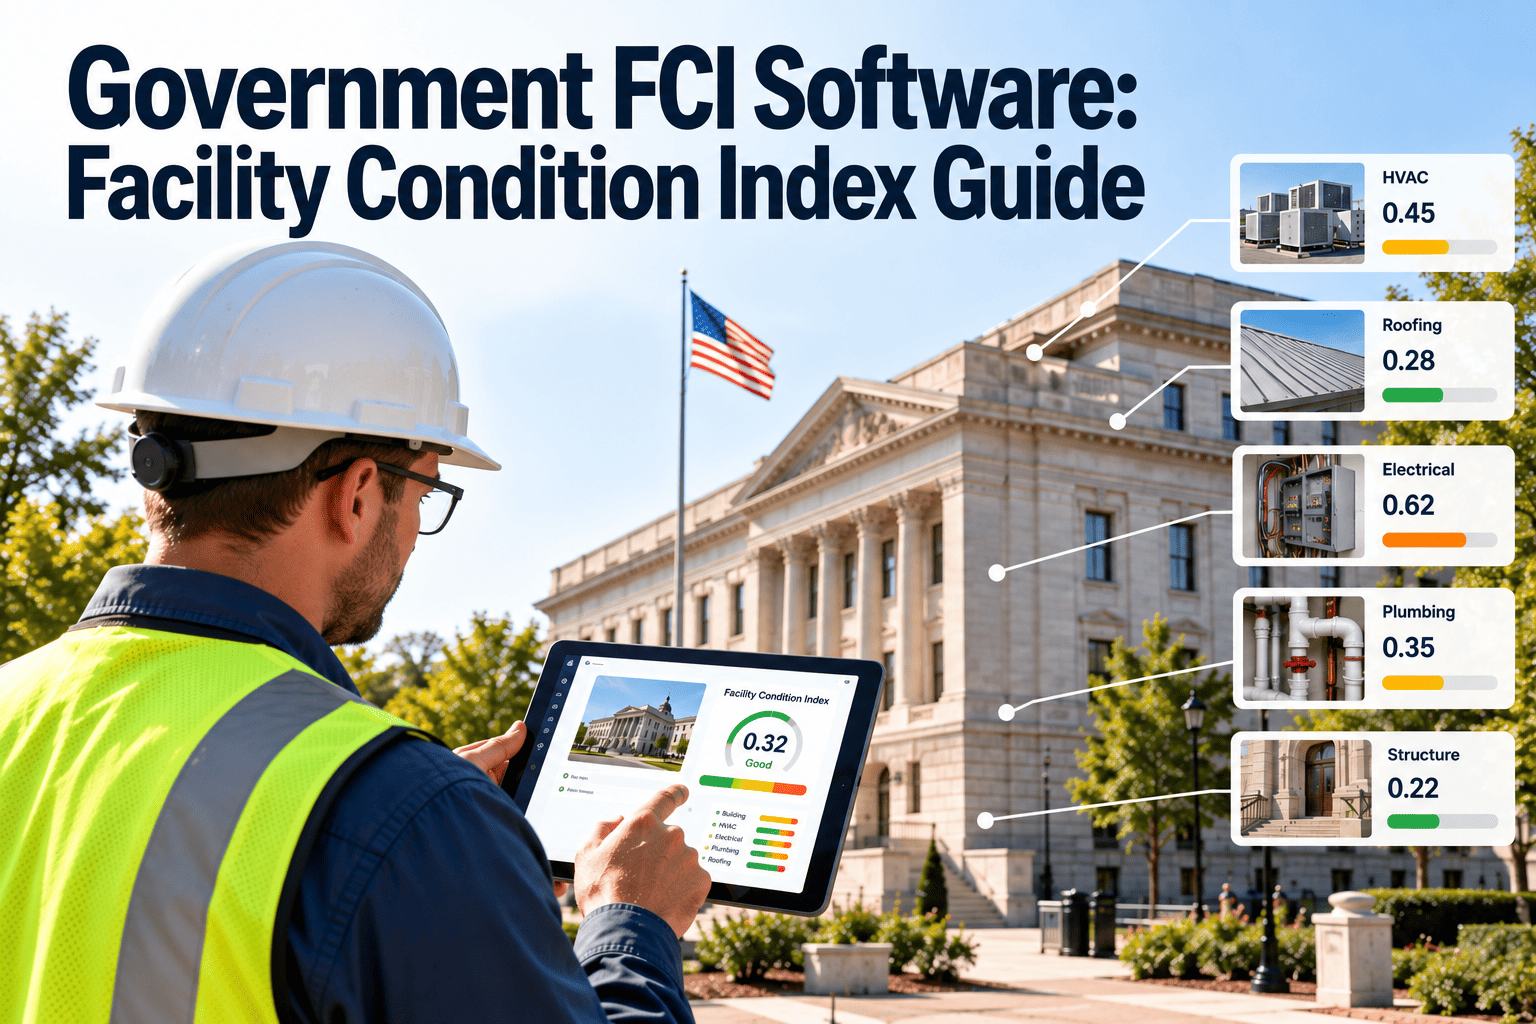
Breaking FCI Down by Building System
A portfolio-level FCI tells a council whether the news is good or bad. A system-level breakdown tells maintenance staff and capital planners where to spend the next dollar.
This breakdown matters because two buildings can arrive at the identical portfolio-wide FCI through completely different paths, and each path calls for a different response. A building carrying a 22% FCI driven mostly by cosmetic interior finishes is a very different capital conversation than a building at the same 22% driven by a structural or life-safety deficiency, even though the top-line number looks the same on a summary report. System-level scoring is what lets a capital planner tell those two stories apart without opening the underlying assessment file every time.
From Score to Capital Request: The Five-Step Workflow
The step that gets skipped most often in agencies running FCI from spreadsheets is the fourth one — ranking. It's not enough to know that a portfolio's average FCI is 18%; a capital committee needs to know which five buildings out of forty are driving that average and which project, funded this year, moves the needle furthest per dollar spent. A CMMS that already holds every asset's condition score, criticality rating, and repair cost can generate that ranked list on demand instead of requiring a planner to rebuild it manually each budget cycle.
What This Looks Like Applied Across a Portfolio
Consider a mid-size county with thirty-one buildings — administrative offices, a courthouse, several fire stations, a library system, and a public works yard. Run as a periodic assessment, the portfolio produces one report every four years, a single average FCI for the county, and a narrative list of "priority" projects that gets reordered informally as squeaky wheels get attention.
The CMMS-Connected Version of the Same Portfolio
Run through a connected CMMS instead, the same thirty-one buildings each carry their own live FCI, broken into structural, mechanical, electrical, plumbing, and life-safety components. When a roof repair closes out on the library, that building's envelope score updates immediately and its overall FCI drops without anyone re-running an assessment. When a fire station's HVAC unit fails unexpectedly, the resulting emergency work order feeds straight back into that building's mechanical score, and the county's ranked capital list reorders itself automatically — with the fire station's tightened mission-critical threshold already factored in, moving it ahead of a lower-priority administrative building even at a similar raw FCI.
Static Spreadsheet vs. a Connected FCI Score
| What Matters | Spreadsheet, Periodic Assessment | OxMaint, Continuous Scoring |
|---|---|---|
| Score freshness | Accurate only at assessment date | Updates as work orders close |
| System-level detail | Buried in the assessment PDF | Broken out by building system |
| Replacement value | Manually re-indexed, if at all | Tracked and adjusted per asset |
| Capital request packaging | Rebuilt from scratch each cycle | Generated from live condition data |
| Portfolio comparison | Manual ranking across buildings | Automatic ranking by score and risk |
Getting a Portfolio Onto Live FCI Scoring
Agencies moving off spreadsheet-based FCI rarely need to start from zero. The most recent facility condition assessment already contains the deficiency list, cost estimates, and system breakdown a CMMS needs — the work is loading that data in as the baseline, then letting ongoing work orders keep it current instead of waiting for the next full assessment cycle to reset it.
Shrinking the Annual Workload
From there, the annual task shrinks considerably. Instead of commissioning a new assessment every time a capital plan needs updating, a facilities team re-indexes replacement values for inflation, reviews any deficiencies flagged since the last cycle, and lets the CMMS produce the current ranked list. The full walk-through condition assessment still has its place — usually every three to five years, to catch anything a work order history alone wouldn't surface — but it stops being the only source of truth in between.
Frequently Asked Questions
Give Your Capital Committee a Score They Can Trust
Stop presenting FCI as a number from the last assessment cycle. OxMaint keeps it live, broken down by system, and ready to back up your next capital request.