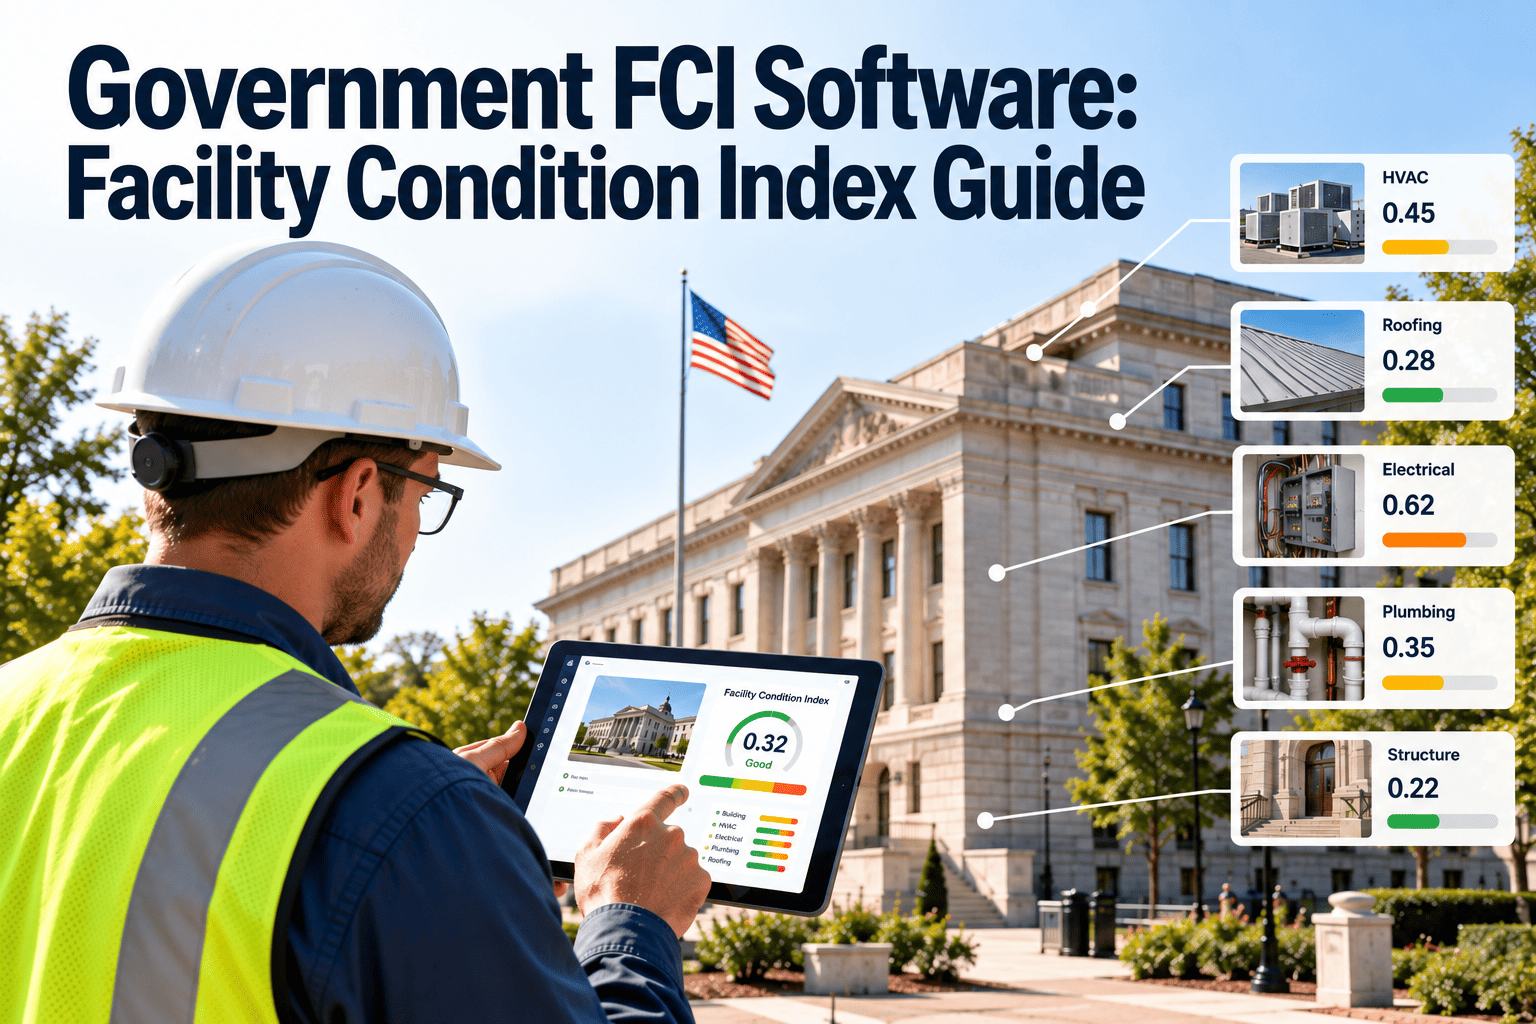
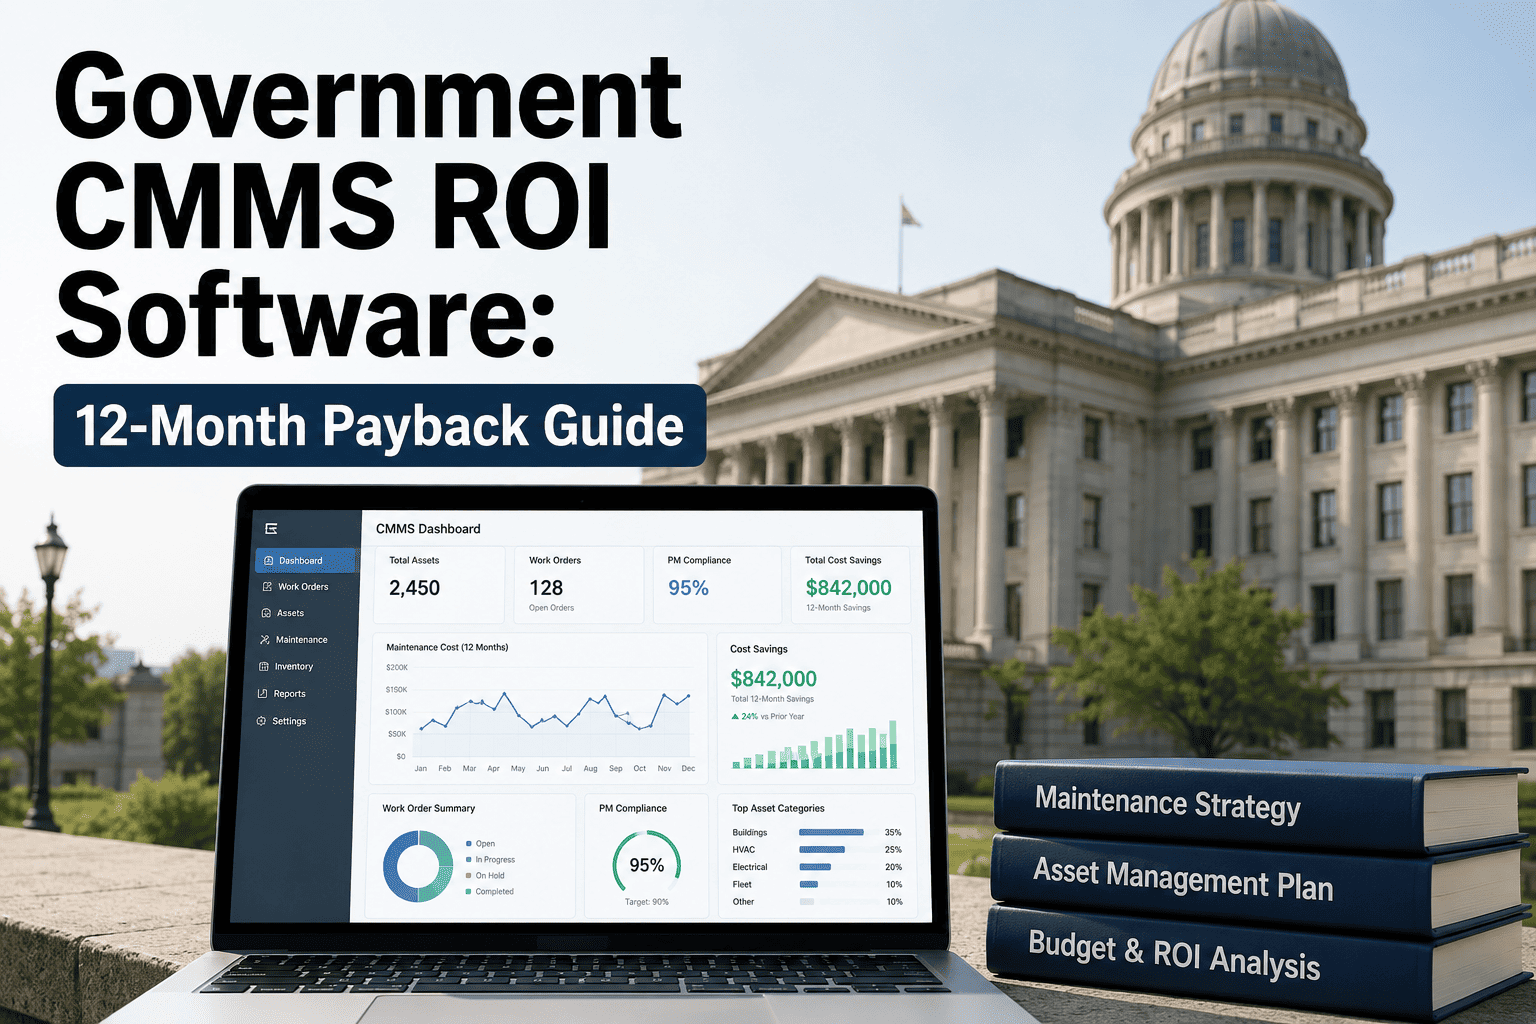
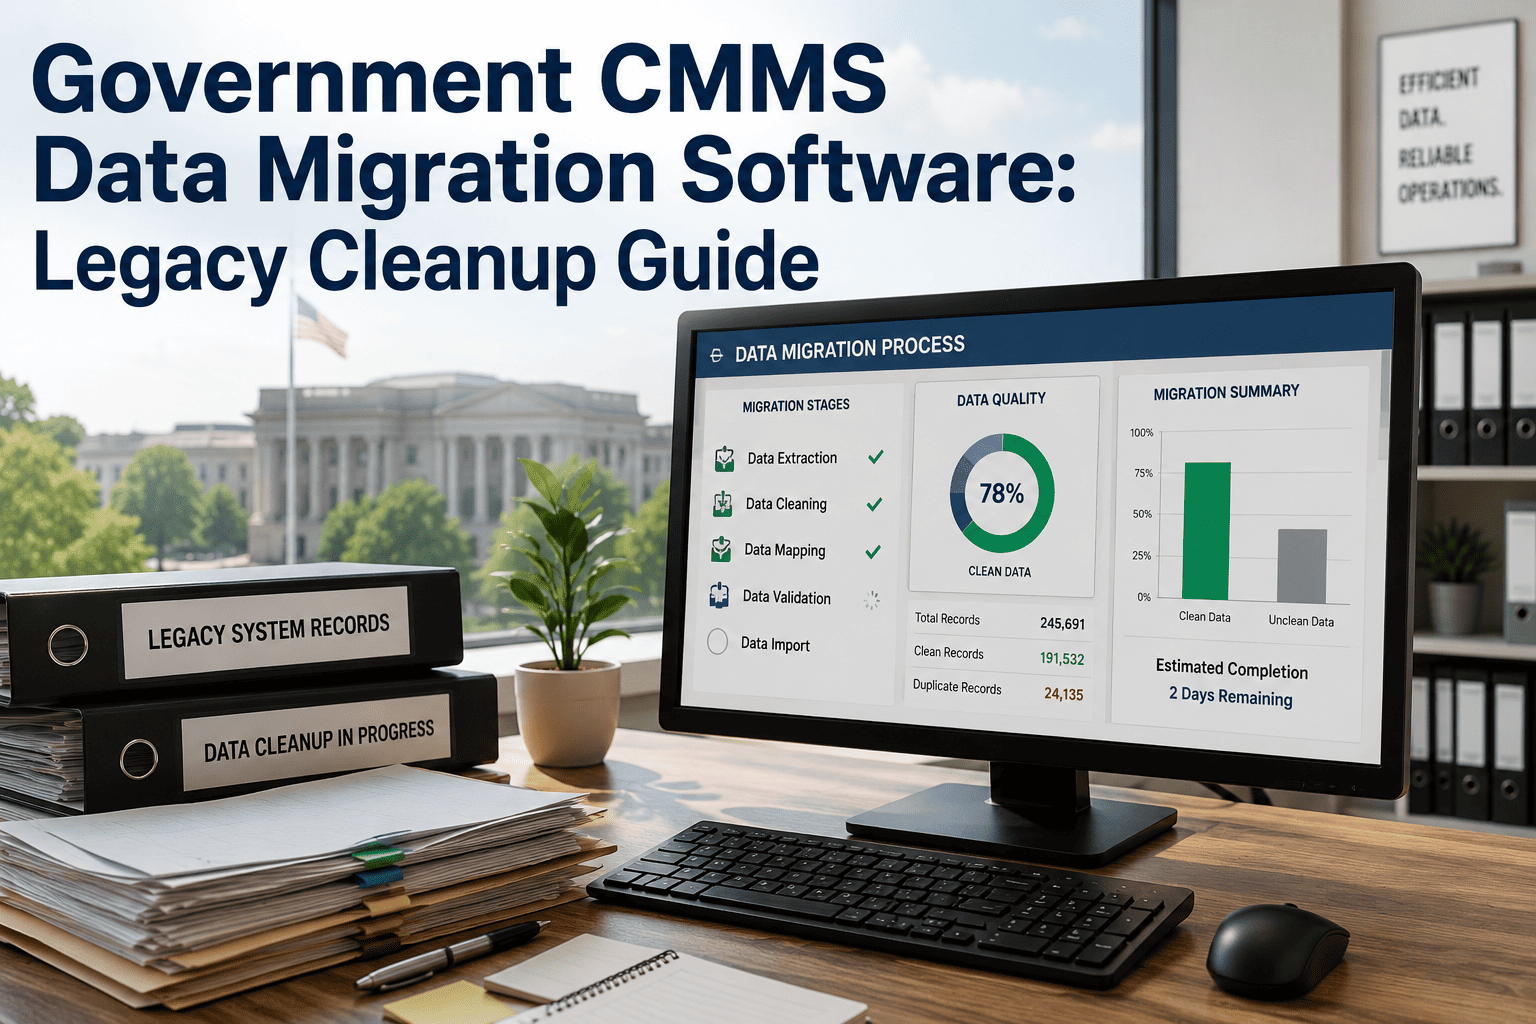
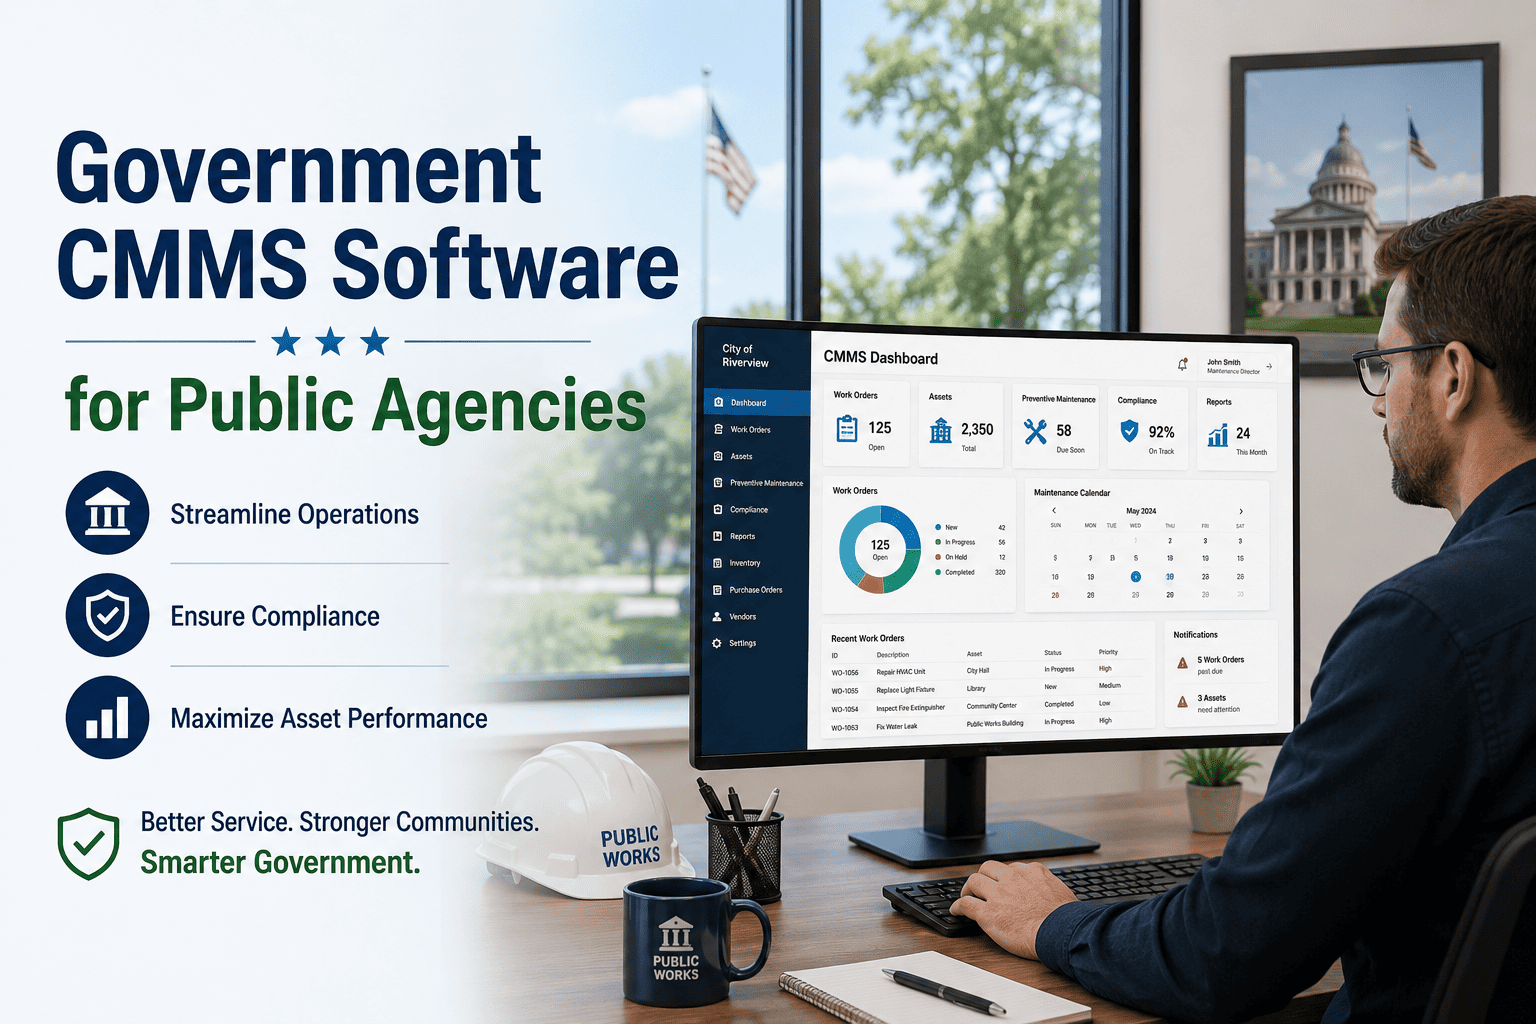
Every public agency owns buildings that are quietly getting older, and most of them cannot tell you — with a defensible number — how much it would cost to bring their portfolio back to acceptable condition. That single number is the Facility Condition Index, and the assessment that produces it is the one document that unlocks capital budget approvals, federal grant applications, and honest conversations with council about which buildings deserve investment. A modern Facility Condition Assessment done inside a CMMS turns a static consultant report into a living portfolio score that updates every time a work order closes. Start free with Oxmaint and see your first FCI score inside a week.
What an FCA Actually Delivers for a Public Agency
A Facility Condition Assessment is not a walkthrough with a clipboard. It is a structured, system-by-system evaluation that produces four specific outputs — the deficiency inventory, the repair cost estimate, the current replacement value, and the FCI ratio. Together those four numbers are what every federal reviewer, grant panel, and finance committee actually asks for when a public agency requests capital funding for facility renewal. Skip any one of them and the assessment becomes a document that describes buildings rather than a tool that unlocks funding for them.
01
Deficiency inventory
Every gap, defect, and end-of-life component captured against the specific asset it belongs to — not just the ones already reported through work orders.
02
Repair cost estimate
Each deficiency priced using RS Means or local construction rates, giving directors a total deferred maintenance figure they can defend line by line.
03
Current replacement value
The cost to rebuild each building in-kind at today's prices, updated annually for construction inflation so the denominator of FCI stays honest.
04
Portfolio-level FCI
The single ratio that lets a director rank every building in the portfolio and explain in one number which ones need capital intervention now.
The FCI Formula, Made Concrete
The math is intentionally simple so that finance committees, grant reviewers, and council members can all follow it without a facilities background. The insight is in what the score triggers — not the arithmetic itself. Two agencies with identical raw deferred maintenance numbers can carry very different FCIs depending on their replacement values, which is exactly why the ratio matters more than the raw dollar figure ever could.
The Five FCI Bands Every Director Should Know
FCI scores fall into five recognizable bands that translate directly into capital action. Publishing these bands alongside every building on a portfolio dashboard turns the assessment into a decision instrument — not a static report.
0–5%
Excellent
New or recently renovated. Continue standard PM cycle. No capital action required.
5–10%
Good
Well maintained. Increase inspection cadence on aging systems. Monitor for drift.
10–30%
Fair
Capital planning attention. Prioritize highest-cost deficiencies in the next CIP cycle.
30–60%
Poor
Major renovation or partial replacement. Defer no further. Escalate to council.
Above 60%
Critical
Replacement economically favored over continued repair. Move to capital replacement plan.
Every public building in your portfolio should carry a live FCI score. Oxmaint calculates it automatically from your asset register and work order history — no annual consultant engagement required.
The Eight Building Systems Every FCA Must Cover
Uniformat is the industry-standard classification that keeps assessments consistent across buildings and across years. Every system below carries its own deficiency list, its own replacement value, and its own system-level FCI — which is where the real capital prioritization happens. A building can carry an acceptable overall FCI while hiding a critical envelope or life-safety score inside it, so the system-level breakdown is what turns FCI from a summary number into a capital planning instrument.
A
Substructure
Foundations, slabs, basements. Rarely fails but catastrophic when it does — cracking, settlement, and water intrusion are the top findings.
B
Shell and envelope
Roof, walls, windows, doors. The single largest source of deferred maintenance in aging public buildings and the easiest to defer until it becomes urgent.
C
Interiors and finishes
Partitions, ceilings, floors, doors. Cosmetic but consequential — worn finishes drive public perception of every civic building.
D1
Mechanical and HVAC
Boilers, chillers, air handlers, controls. High-cost, high-visibility, and the most common trigger for emergency capital requests.
D2
Electrical
Distribution, lighting, emergency power. Aging switchgear and undersized panels drive both compliance findings and life-safety risk.
D3
Plumbing
Supply, waste, fixtures, hot water. Corrosion and leaks accumulate silently and generate collateral damage far beyond the plumbing line itself.
E
Life safety
Fire alarm, sprinklers, egress, emergency lighting. Non-negotiable for occupancy and the first thing any state or federal audit checks.
F
Site and accessibility
Parking, walkways, drainage, ADA compliance. Often overlooked in FCAs and often the top source of citizen-facing findings.
The Real Cost of Skipping the FCA
Deferred maintenance is not a static number — it compounds. Every $100,000 of work that gets pushed past its optimal window becomes roughly $700,000 in reconstruction over a decade. Agencies that skip structured FCAs do not save money; they lose visibility into a curve that is accelerating quietly in the background. By the time a roof, boiler, or electrical panel fails outright, the choice is no longer between repair and replacement — it is between emergency replacement and closing the facility to the public, and neither option carries a defensible budget number.
Deferred maintenance compounds as failures cascade, materials inflate, and repair scope expands into replacement.
Legacy FCA vs Live CMMS-Driven FCA
The way most agencies still run FCAs — a consultant walks the building every three to five years and hands over a PDF — was designed for an era before every asset carried its own work order history. A CMMS-driven FCA replaces the static document with a portfolio score that updates itself, closing the gap between the assessment cycle and the day-to-day reality of maintenance activity. The consultant model is not wrong, but it is no longer sufficient on its own for agencies competing for scarce capital dollars against peers who report live condition data.
| Dimension |
Traditional consultant FCA |
CMMS-driven live FCA |
| Update cadence |
Every 3–5 years, static between cycles |
Continuous — updates on every closed work order |
| Deficiency source |
One-time visual walkthrough |
Walkthrough plus complete work order history |
| Cost per cycle |
$0.10–$0.30 per sq ft in consultant fees |
Included in CMMS subscription |
| Data ownership |
Trapped in consultant deliverable |
Native to your CMMS asset register |
| Grant readiness |
Data ages out between reports |
Current condition data always exportable |
| Capital planning speed |
Manual spreadsheet consolidation |
40% faster allocation decisions with live data |
| System-level FCI |
Building-level only in most reports |
Rolls up from asset through system to portfolio |
| Audit defensibility |
Report is only as fresh as its date |
Every deficiency traceable to a dated work order |
How Oxmaint Runs FCA for Public Agencies
Oxmaint is built to make FCA a continuous discipline rather than a periodic engagement. The register, the work orders, the cost data, and the replacement values all sit in one system — which is exactly what makes real-time FCI possible.
Register
Uniformat asset hierarchy
Every asset lives in the standard classification structure. Buildings roll up into systems, systems roll up into portfolio — the exact hierarchy grant reviewers expect.
Assessment
Digital FCA work orders
Assessors capture deficiencies on mobile against the specific asset. Photos, priorities, and cost estimates attach in the field — nothing waits for the office.
Calculation
Automatic FCI scoring
Deferred maintenance and replacement values roll into FCI at asset, system, building, and portfolio level. No spreadsheet consolidation.
Dashboard
Portfolio condition view
Every building ranked by FCI in a single view. Directors see at a glance which facilities are drifting into Fair or Poor territory this cycle.
Capital
CIP-ready exports
Capital Improvement Plan submissions export in the format finance committees and legislative reviewers expect — deficiency list, cost, FCI, priority.
Grants
Federal grant evidence
Condition reports and maintenance history export directly into the evidence packages federal infrastructure grants require to approve funding.
Agencies deploying Oxmaint typically stand up their first FCA-driven FCI score across a five-building pilot in under 30 days. See what your own portfolio looks like on a live condition dashboard.
The FCA Cadence Every Public Agency Should Run
FCA is not a one-shot exercise. Different building profiles need different assessment cadences, and running the right rhythm keeps FCI scores defensible when the state auditor or the federal grant reviewer arrives.
Every 3 years
Standard portfolio buildings
Well-maintained buildings under 20 years old with FCI below 10% get a full walk-through refresh every three years.
Every year
Aging or high-FCI buildings
Any building over 20 years old or scoring above FCI 15% gets an annual reassessment so the deferred maintenance curve stays visible.
Continuous
Every closed work order
Between formal assessments, FCI updates itself every time a deficiency is closed or a new one is logged — that is what makes CMMS-driven FCA superior.
Event-triggered
After major incidents
Major weather events, fires, floods, and mechanical failures trigger an immediate targeted reassessment of the affected building.
What Public Agencies Recover With Live FCA
The switch from periodic consultant FCAs to CMMS-driven live FCA does not just save assessment fees. It rewires the entire capital planning process — and the numbers below are what leading public agencies actually report.
40%
Faster capital decisions
Directors using live FCI make allocation decisions 40% faster because the data is current and the CFO presentation is already built.
7x
Deferred cost multiplier
Every $100K deferred becomes roughly $700K in reconstruction over ten years — the exact curve that a live FCI catches early.
3–5x
Grant award rate
Federal and state grants approve applications backed by documented condition data at 3–5x the rate of undocumented submissions.
15–21%
CRV correction
CRV updated annually for construction inflation prevents the 15–21% overstatement of FCI severity that stale replacement values create.
The Four Failure Modes That Make an FCA Useless
Not every FCA is worth the paper it is printed on. The pattern is consistent — agencies invest in the assessment, then one of four mistakes turns the deliverable into a document nobody uses. Every failure mode below has a CMMS-based countermeasure.
Stale replacement values
If CRV is not updated for construction inflation each year, FCI drifts. Oxmaint tracks inflation-adjusted CRV automatically so the ratio stays honest.
Deficiencies not tied to assets
Findings written against buildings instead of specific assets cannot be repriced or reprioritized later. Oxmaint forces every deficiency to attach to the asset it belongs to.
No system-level rollup
Building-level FCI alone hides which system is driving the score. Oxmaint calculates FCI per Uniformat system so directors can target the right capital request.
Assessment ages without updates
A three-year-old FCA is a liability, not evidence. Oxmaint keeps the score live between formal reassessments by ingesting every closed work order automatically.
How Different Public Agency Tiers Use FCA Data
An FCA program looks different at the federal, state, and municipal level — but the underlying discipline is the same. What changes is the audience for the score, the frequency of the reporting, and the specific evidence attached to each capital request. Understanding which pattern applies to your tier keeps the program aligned with the funding cycle that actually pays for the work.
Federal
GSA and agency portfolios
Federal FCAs feed into GSA reporting cycles, agency-level capital budget submissions to OMB, and mission-critical facility categorization. FCI trends drive multi-year requests defensible under Congressional review, and the data supports occupancy and consolidation decisions across entire regional footprints.
State
Legislative capital submissions
State agencies use FCA to defend biennial capital requests to the legislature, prioritize between universities, correctional facilities, and administrative buildings, and demonstrate stewardship of existing assets before requesting new construction dollars. FCI comparisons across facility types drive the appropriation conversation.
County
Commission capital cycles
County facilities managers report to commissioners on courthouse, jail, health department, and administrative building condition. FCA data supports the annual CIP hearing, drives bond referendum evidence, and produces the deferred maintenance backlog number that county auditors expect to see documented.
Municipal
Council and department heads
City facility directors use FCA to defend budgets at council meetings, prioritize between fire stations, libraries, community centers, and city halls, and produce the evidence packages that unlock CDBG and infrastructure grants. The score becomes the shorthand every council member learns to look for.
Districts
School and special district boards
School districts, water districts, and transit authorities run FCAs against distributed portfolios where every building serves a different community. FCI data supports bond campaigns, informs facilities master plans, and gives boards a portfolio-level view rather than the building-by-building emergency pattern most districts default to.
Tribal
Tribal nation facilities
Tribal governments use FCA data to compete for federal funding streams including BIA, IHS, and HUD block grants. Documented condition evidence is often the differentiating factor in competitive federal grant programs where tribal facilities compete against state and municipal applicants.
The FCA-Driven Capital Improvement Plan
A Capital Improvement Plan built from FCA data does not just list projects — it ranks them by evidence. Every line in the CIP carries an FCI score, a system-level deficiency count, and a projected FCI improvement once the project completes. That is the language finance committees actually respond to.
Rank by FCI severity
Buildings in the Poor and Critical bands automatically populate the top of the CIP list. Directors no longer defend priority order — the score does it for them.
Show FCI delta per project
Every proposed project carries a projected FCI improvement. Council sees "this $2M investment moves the building from Fair 22% to Good 8%" — not just a line item.
Portfolio-level trajectory
The dashboard shows the projected portfolio FCI curve over five years with and without the requested capital. That single chart wins more budget hearings than any narrative.
Grant-application ready
Every CIP entry exports directly into federal and state grant applications with the deficiency list, cost, condition data, and photos already attached in the required format.
Frequently Asked Questions
How often should a public agency run a Facility Condition Assessment?
Every 3–5 years for standard buildings, annually for anything over 20 years old or scoring above FCI 15%, and immediately after major weather or facility incidents. A CMMS-driven approach keeps FCI live between formal cycles.
Set up automated cadence free.
What FCI score means a building should be replaced instead of repaired?
Above 60% is the threshold where replacement is economically favored over continued repair investment. Between 30% and 60% the building typically enters major renovation planning rather than replacement.
Does Oxmaint calculate FCI automatically or do we still need spreadsheets?
Oxmaint calculates FCI directly from your asset register and work order history. Deferred maintenance rolls up from asset to system to building to portfolio without any spreadsheet consolidation, and the score updates on every closed work order.
How does FCA data help with federal and state grant applications?
Grant reviewers require documented condition evidence to approve infrastructure funding. Agencies with current FCI scores and asset-level deficiency records see approval rates 3–5x higher than those submitting undocumented requests.
Book a walkthrough to see the grant export.
Can we run an FCA ourselves or do we need to hire a consultant?
Both approaches work with Oxmaint. In-house staff can conduct assessments using mobile FCA work orders against the Uniformat hierarchy, or consultants can enter their findings directly into the same register so the data stays with your agency.
Turn your FCA from a PDF on a shelf into a live capital planning tool
Oxmaint gives public agencies the register, the digital FCA work orders, the automatic FCI calculation, and the grant-ready exports that turn condition assessment into defensible capital decisions. See your portfolio's first FCI score inside a week.