Government maintenance departments present budget requests every fiscal cycle with the same problem: the numbers are based on last year's spend, not next year's actual asset needs. That gap between historical actuals and forward-looking condition data causes both chronic underfunding of critical infrastructure and unnecessary spending on assets that don't yet need intervention. OxMaint's Analytics & Reporting gives budget planners a maintenance forecasting dashboard built from real asset condition data — so funding requests reflect what infrastructure actually needs, not what it historically spent. Book a demo to see a live budget forecasting dashboard for government maintenance.
Analytics & Reporting · Budget Planning · P1 Critical
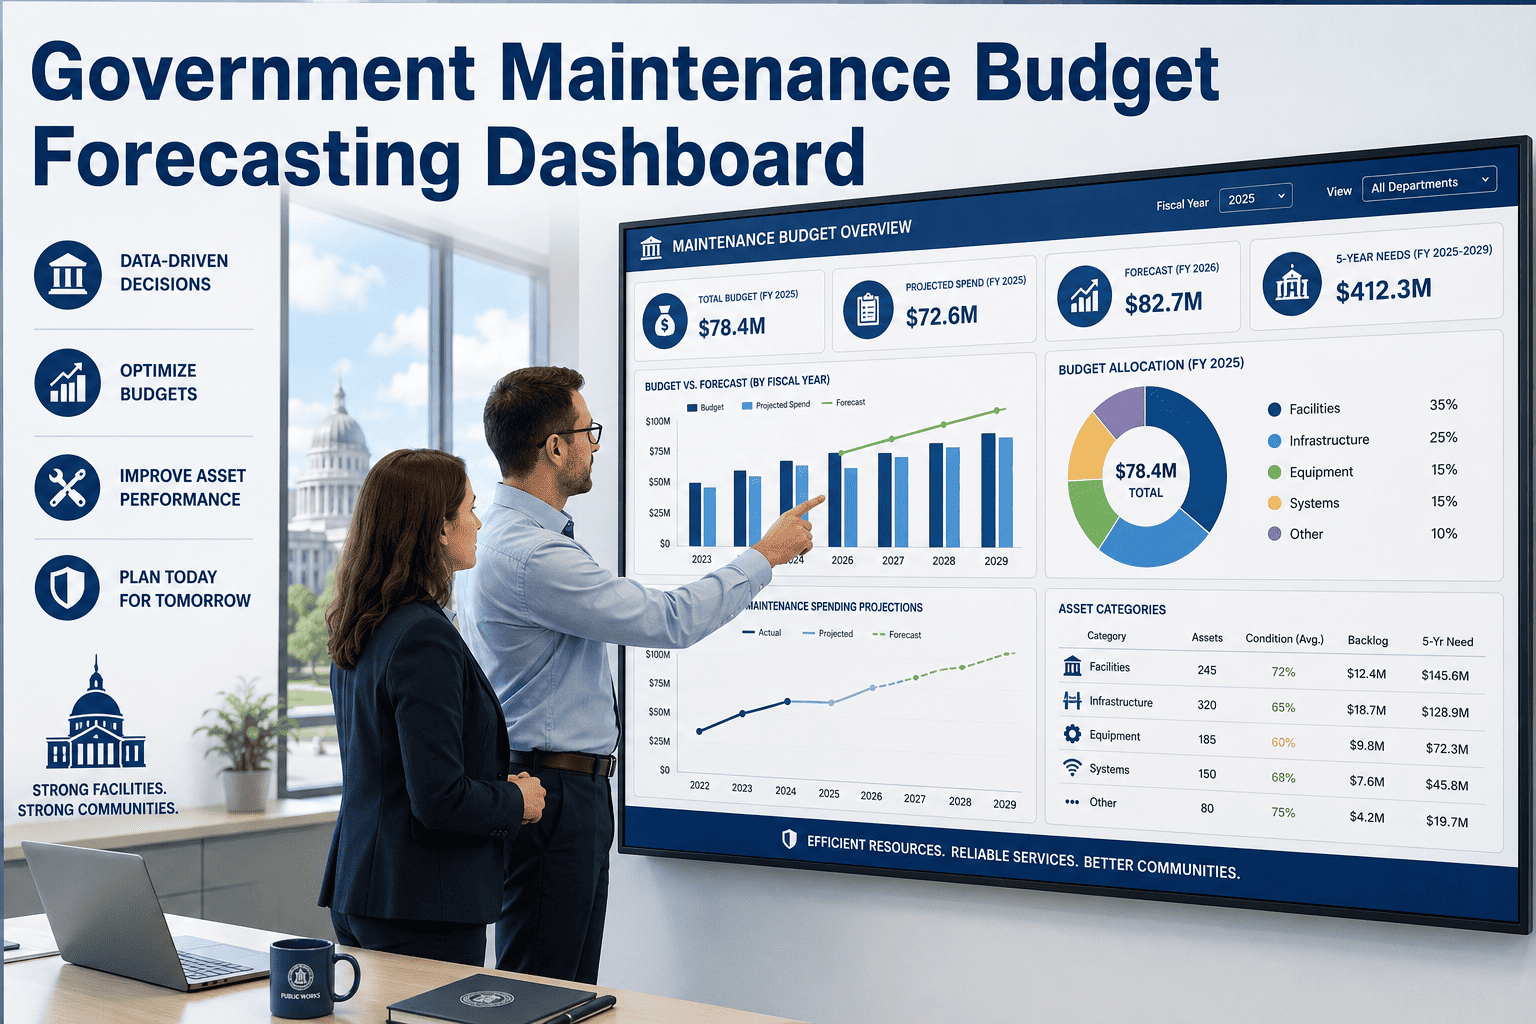
Government Maintenance Budget Forecasting Dashboard
Move from gut-feel budget requests to data-driven forecasts that elected officials can approve and auditors can verify.
$4.3M
Avg. budget variance reduction in first year of data-driven forecasting
-62%
Reduction in emergency budget amendments from unplanned failures
91%
Forecast accuracy for 12-month maintenance spend vs actual
3 Days
Time to produce a complete 5-year capital maintenance forecast
Why Government Maintenance Budgets Consistently Miss the Mark
Budget overruns and underfunding in government maintenance are predictable — not because public works teams make poor decisions, but because the data they use to make decisions is structurally incomplete. The three root causes below account for the majority of budget misses across municipal and county maintenance departments.
01
Historical Spend ≠ Future Need
Budgets built on last year's actuals assume asset condition stays constant. In reality, infrastructure ages non-linearly — a road that cost $12K to maintain in year 8 may need $90K in year 12. Without condition data, this inflection point is invisible until it becomes an emergency.
02
No Visibility Into Deferred Work
Maintenance deferred due to budget constraints accumulates compound costs. A $3K inspection missed this year becomes a $22K repair next year. Most departments track what was spent — not what was skipped and what it will cost to skip it.
03
Siloed Data Across Departments
Roads, utilities, facilities, and parks maintenance are often budgeted separately with no shared asset data. Capital planning decisions are made without visibility into cross-department maintenance obligations on shared infrastructure.
Budget Forecast Accuracy: Traditional vs. OxMaint Analytics
12-Month Forecast Accuracy
61% avg accuracy
91% avg accuracy
5-Year Capital Projection
±40% variance
±12% variance
Emergency Amendment Rate
3–5 per year
Less than 1 per year
Data Prep for Budget Request
4–6 weeks manual
3 days automated
Deferred Maintenance Visibility
Estimated at best
Real-time dashboard
Audit Trail for Budget Decisions
Spreadsheet notes
Timestamped records
What the OxMaint Budget Forecasting Dashboard Shows
A
Asset Condition Waterfall
Visual breakdown of all managed assets by current condition score — critical, poor, fair, good, excellent. Forecasts maintenance cost by condition tier for the next 3 fiscal years with automated deterioration modeling.
B
Deferred Maintenance Liability
Running total of maintenance work identified but not yet completed — with cost escalation forecasts showing what each deferred item will cost if addressed in year 1, year 2, or year 3. Makes the cost of delay visible to decision-makers.
C
Work Order Cost Actuals vs Budget
Real-time comparison of actual maintenance spend against budget allocation by department, asset class, and cost category. Variance alerts flag overspend before it becomes a budget crisis, not after the fiscal year closes.
D
5-Year Capital Replacement Forecast
Remaining useful life estimates from AI condition models generate a capital replacement schedule — showing which assets will reach end-of-life in each planning year, with cost estimates and priority ranking for funding decisions.
For Budget Officers and Public Works Directors
Build Your Next Budget Request on Real Asset Data
OxMaint's budget forecasting demo runs a live walkthrough of the forecasting dashboard using sample municipal asset data. See exactly what elected officials and auditors see when reviewing a data-backed maintenance budget request.
Expert Review
"Budget committees in local government are deeply skeptical of maintenance budget requests — because historically those requests have been based on history and intuition, not condition data. When a public works director walks in with a dashboard showing exactly which assets are at what condition level, what the deferred maintenance liability is, and what happens to that number if the budget is cut by 10%, the conversation changes entirely. We've seen departments go from years of flat budgets to approved capital programs — not because they asked louder, but because they finally had the data to show what they were actually managing. That shift from 'we think we need' to 'here's what the data shows' is what AI-powered budget analytics makes possible."
Chief Financial Officer · County Public Works Department · 80,000 Managed Assets
Frequently Asked Questions
How does OxMaint generate maintenance cost forecasts without historical data?
OxMaint builds cost forecasts from two sources: live asset condition data from inspections and sensors, and industry cost benchmarks for each asset class (road, bridge, facility, utility infrastructure). If historical work order data exists, it's imported and used to calibrate forecasts. If it doesn't, the system begins building cost history from day one of deployment. Forecasts improve in accuracy over 6–12 months as the system accumulates facility-specific cost data.
Start a free trial to see how forecasts are built from your available data.
Can OxMaint produce documentation for GASB 34 asset reporting requirements?
Yes. OxMaint's Analytics & Reporting module generates infrastructure asset inventory reports, condition assessments, and maintenance cost histories in formats aligned with GASB 34 modified approach and depreciation reporting requirements. Departments using OxMaint report reductions in GASB 34 preparation time from 6–8 weeks of manual compilation to dashboard exports completed in 2–3 days.
Book a demo to review GASB 34 reporting capabilities for your department.
How does the deferred maintenance liability feature work?
Every time a maintenance work order is identified but not completed — whether due to budget, staffing, or priority deferral — OxMaint records it with the original cost estimate and applies cost escalation modeling based on asset type and deterioration rate. The deferred maintenance dashboard shows the current liability value and a year-by-year projection of cost escalation if work remains deferred. This gives budget officers a direct line between deferral decisions and future cost consequences.
Is the forecasting dashboard accessible to elected officials and budget committees without full CMMS access?
Yes. OxMaint provides read-only dashboard access with configurable sharing options — elected officials, budget committees, and external auditors can view dashboards via secure link without requiring a full CMMS user account. Dashboards can also be exported as scheduled PDF reports delivered to stakeholders automatically before each budget cycle, council meeting, or audit period.
Stop Defending Budgets. Start Proving Them.
The public works departments that get consistent budget approvals are the ones with data — asset condition scores, deferred maintenance costs, capital replacement timelines. OxMaint builds that case automatically, so your next budget request is a briefing, not an argument.