Municipal pump stations silently drain millions from public utility budgets every year. Aging motors running at inefficient load curves, undetected seal leaks, and reactive maintenance cycles compound into energy costs that most water utilities accept as fixed — when they aren't.OxMaint AI's Energy & ESG Reporting gives operations teams the real-time visibility to find waste before it shows up on the bill. Book a demo to see how pump station energy analytics works in practice.
Water Utilities · Energy & ESG Reporting
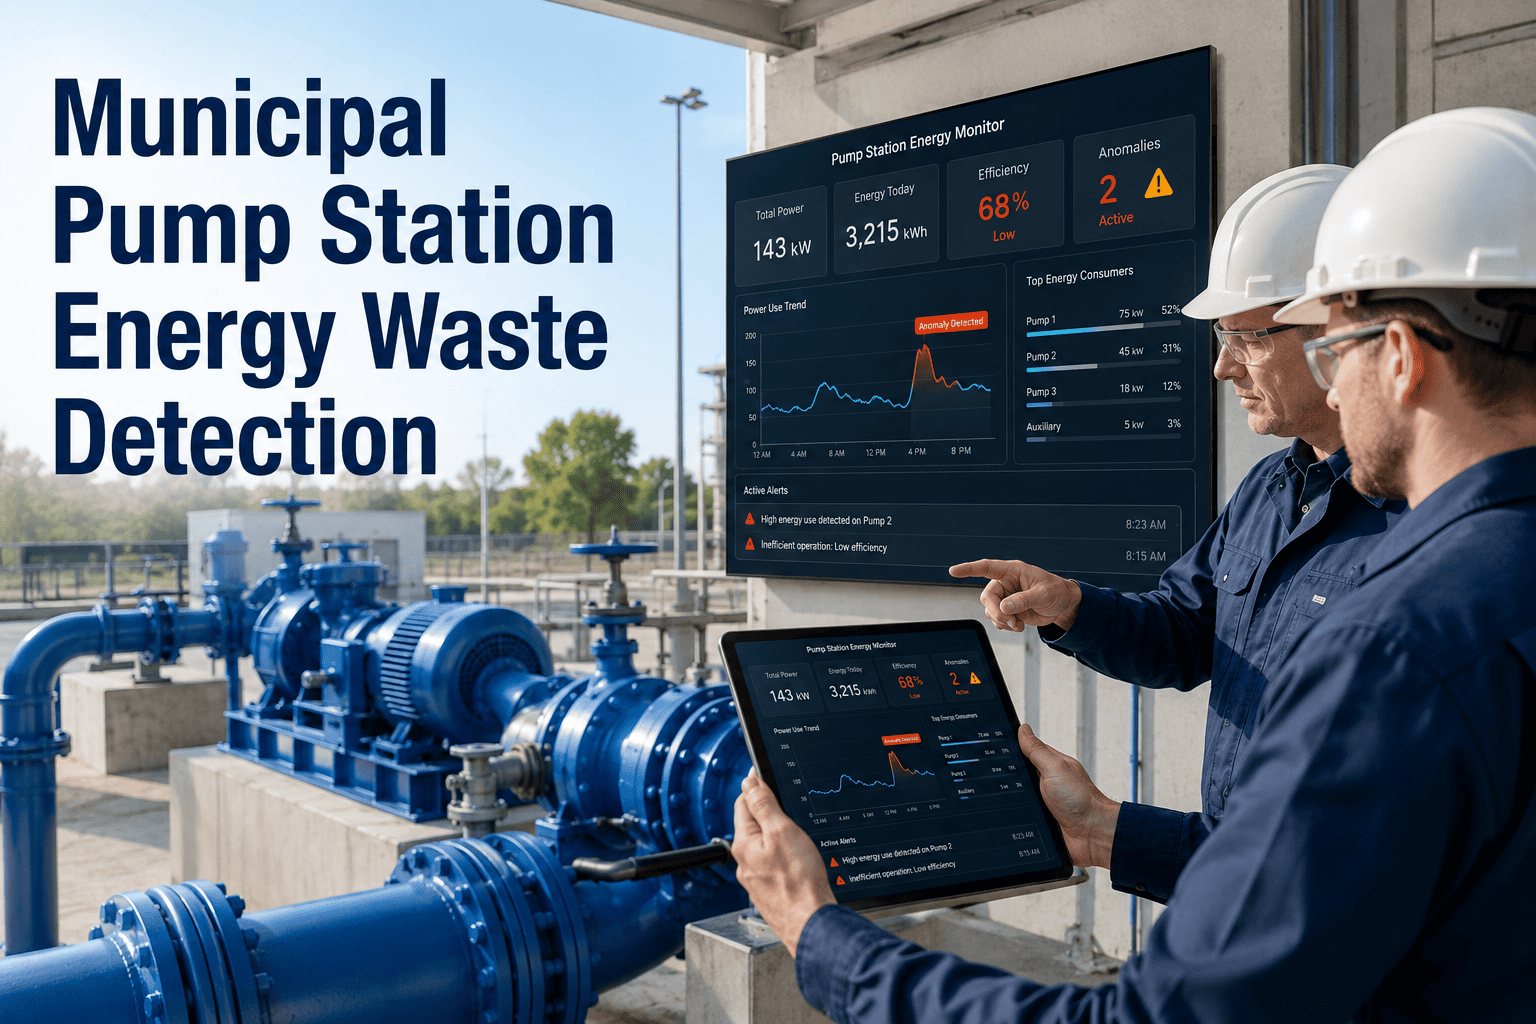
Municipal Pump Station Energy Waste Detection
How AI-powered monitoring identifies hidden energy losses in public water infrastructure — and what utilities save when they act on the data.
34%
Average energy overspend in pump stations running on calendar-based maintenance
$180K
Median annual energy savings per pump station after AI monitoring deployment
6 Wks
Typical advance warning before motor efficiency drops to critical failure threshold
-41%
Reduction in unplanned downtime across utilities using continuous flow analytics
Where Pump Station Energy Waste Actually Hides
Energy waste in pump stations is rarely visible to the naked eye. Most losses happen inside mechanical systems operating within acceptable parameters — until they aren't. The four categories below account for over 80% of documented energy overspend in municipal water infrastructure.
01
Motor Efficiency Degradation
Motors operating at 85–92% of rated efficiency appear functional but consume 8–15% more energy than a healthy unit. Without baseline comparison, the loss is invisible on standard SCADA dashboards.
Detected by: Current signature analysis
02
Pump Curve Deviation
Impeller wear and seal deterioration shift the operating point away from the best efficiency point (BEP). A pump running 12% off its BEP wastes energy proportional to the cube of that deviation — losses compound fast.
Detected by: Flow-to-power ratio monitoring
03
VFD Setpoint Drift
Variable frequency drives programmed for peak demand conditions often run at excessive speeds during off-peak hours. Manual setpoint management fails to track demand cycles — AI does this automatically.
Detected by: Demand-pattern correlation
04
Cavitation and Air Entrainment
Cavitation forces pumps to work harder to deliver the same flow. It's damaging and energy-intensive — and it produces a distinctive vibration signature that AI models detect weeks before physical damage accumulates.
Detected by: Vibration frequency analysis
Energy Performance Benchmark: Before vs. After AI Monitoring
| Performance Indicator |
Without AI Monitoring |
With OxMaint AI |
Change |
| kWh per million gallons pumped |
1,840 kWh/MG |
1,290 kWh/MG |
-30% |
| Emergency repair events per year |
8.4 avg |
2.1 avg |
-75% |
| Motor replacement frequency |
Every 4.2 yrs |
Every 7.1 yrs |
+69% |
| ESG reporting prep time |
3–5 weeks/quarter |
2–3 days/quarter |
-88% |
| Mean time to fault detection |
After failure |
14–42 days prior |
Proactive |
See Your Numbers
Calculate Your Pump Station's Energy Waste
OxMaint's team runs a facility-specific energy audit model before every deployment — factoring your pump inventory, operating hours, utility rates, and current maintenance spend. The ROI numbers are built from your data, not averages.
How OxMaint Detects Energy Waste in Real Time
1
Sensor Data Ingestion
Current draw, vibration, flow rate, pressure, and temperature data stream continuously from pump station sensors into the OxMaint platform — no manual data entry, no reporting delays.
2
Baseline Efficiency Modeling
AI establishes a healthy performance baseline for each pump and motor over 4–8 weeks. Deviations from this baseline — even subtle ones — are flagged automatically with severity scores.
3
Automated Work Order Creation
When efficiency loss exceeds configured thresholds, OxMaint generates a prioritized work order with sensor evidence attached — so technicians arrive with context, not just a fault code.
4
ESG & Energy Reporting
Energy consumption, carbon intensity, and maintenance actions are automatically logged. Quarterly ESG reports and compliance documents export in formats accepted by EPA, state regulators, and bond rating agencies.
Expert Review
"The standard approach in water utilities is to run pumps until something breaks, then fix it. The problem is that the energy cost of running degraded equipment is often three to five times the cost of the eventual repair — and nobody is tracking it. AI monitoring platforms that tie energy consumption to asset health in real time are closing a gap that manual inspection simply cannot address at scale. Utilities that make this shift typically recover platform costs within the first operating year from energy savings alone, before factoring in avoided failures."
Director of Asset Management
Regional Water Authority — Midwest United States · 12 Pump Stations Monitored
Frequently Asked Questions
Does OxMaint integrate with existing SCADA systems in pump stations?
Yes. OxMaint connects to most SCADA systems via standard industrial protocols (Modbus, OPC-UA, MQTT). Sensor data already captured by your SCADA platform feeds directly into the AI analytics layer — there is no need to replace existing infrastructure or purchase new sensors in most cases. Integration is typically completed within 2–4 weeks.
Start a free trial to review your station's integration path.
How does OxMaint support ESG and sustainability reporting for water utilities?
OxMaint's Energy & ESG Reporting module automatically calculates energy intensity (kWh per million gallons), Scope 2 carbon emissions from pump station power consumption, and maintenance-related emissions. Reports export in formats aligned with GRI, CDP, and EPA WaterSense frameworks. Quarterly reporting that previously required weeks of manual data compilation is reduced to a dashboard export.
Book a demo to see the ESG reporting dashboard for water utilities.
Can small utilities with limited IT staff deploy and manage OxMaint?
OxMaint is designed for operations teams, not IT departments. The platform runs on cloud infrastructure maintained by OxMaint — utilities do not manage servers, databases, or software updates. Configuration, sensor mapping, and alert threshold setup are completed during onboarding with OxMaint's implementation team. Most small utilities are operational within 3–4 weeks with no ongoing IT requirement beyond internet connectivity at the pump station.
What is the typical payback period for pump station energy monitoring?
Documented deployments at municipal pump stations show payback periods of 7–14 months. The primary driver is energy cost reduction — typically 25–35% in the first year — followed by avoided emergency repair costs and extended equipment life. Utilities with older motor fleets and high local electricity rates tend to see the fastest payback. A facility-specific model is built during the OxMaint demo process before any commitment is required.
Your Pump Stations Are Spending More Than They Should
Energy waste in pump stations is not a capital problem — it's a visibility problem. OxMaint gives operations teams the data to find inefficiency before it compounds into budget overruns and compliance exposure. The savings pay for the platform. The compliance documentation is a bonus.