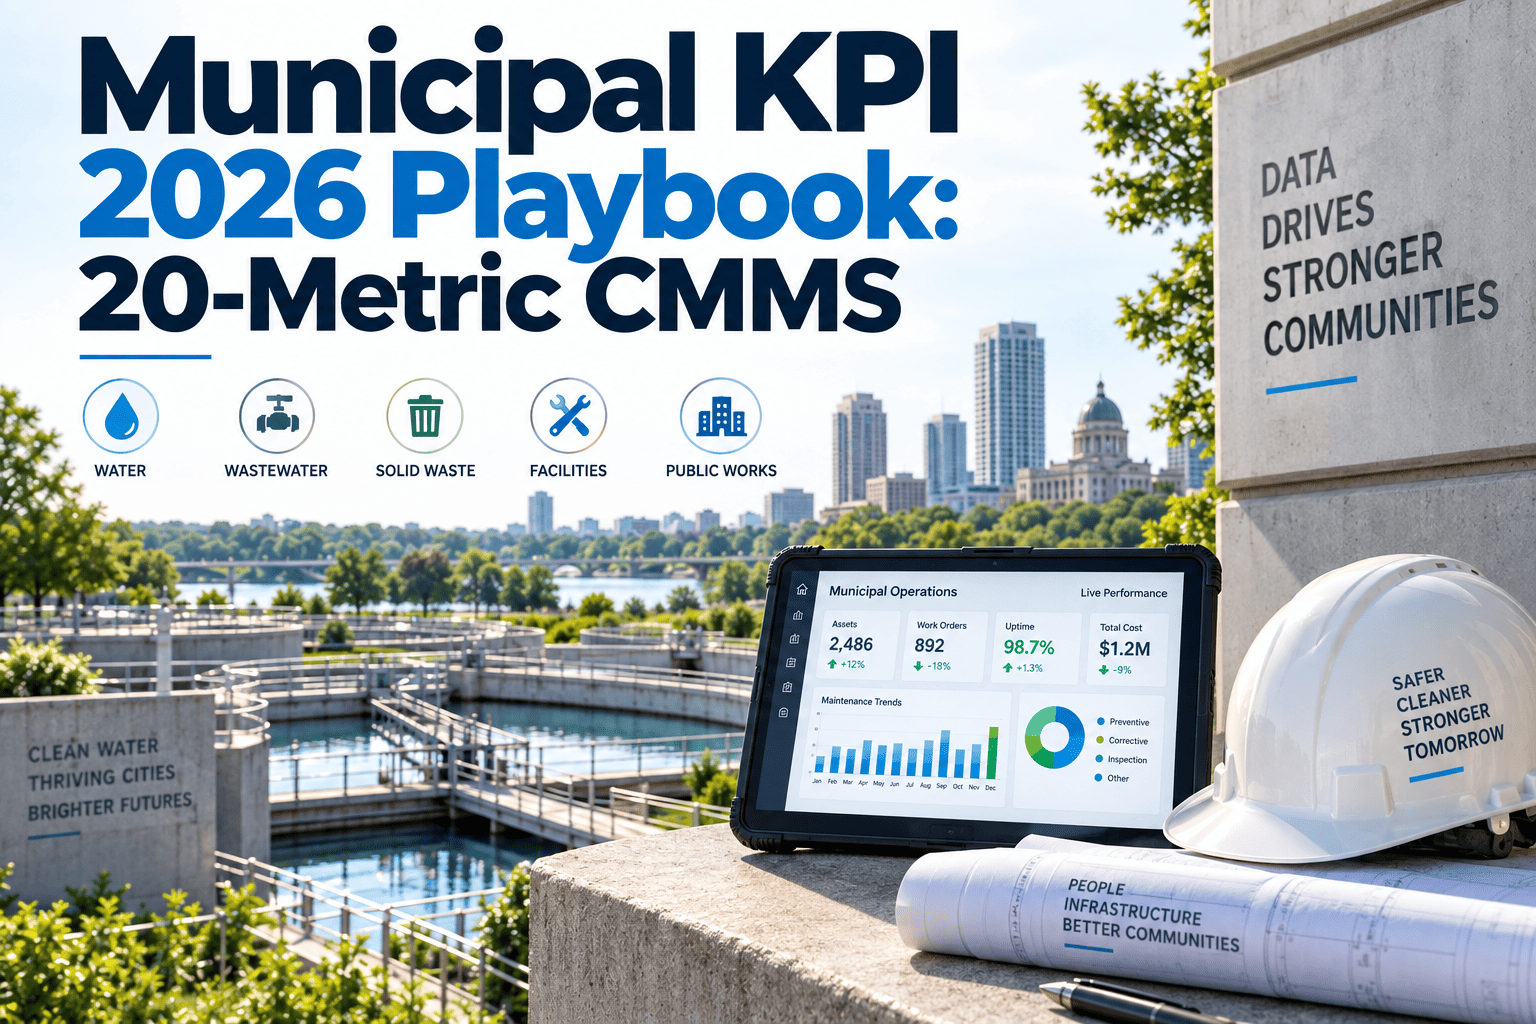
Most cities do not have a KPI problem — they have a KPI overload problem. A public works director might be handed 60 different metrics across streets, parks, utilities, and buildings, half of them tracked in a spreadsheet nobody updates after the first quarter, and none of them tied back to an actual work order. Councils ask for numbers at budget season, residents judge the city on potholes and playgrounds they can see with their own eyes, and staff end up reporting whatever is easiest to pull rather than what actually predicts service failure. This playbook cuts that noise down to 20 metrics — five per department — chosen because each one is both trackable inside a CMMS and directly tied to a resident-facing outcome. Every one of them can be run without building a separate reporting spreadsheet, right from app.oxmaint.ai.
Four Departments. Five Metrics Each. Twenty Numbers That Matter.
Every metric in this playbook answers one of two questions: is the asset in acceptable condition, and is the department responding fast enough when it is not. Metrics that do not answer one of those two questions were left out on purpose, because a 20-metric list only works if every department can actually keep up with it.
Get The 20-Metric Playbook Set Up Inside Your Own CMMS
See the exact work order fields, PM schedules, and dashboard views that generate each of these 20 metrics automatically, with no manual spreadsheet reconciliation at month end.
Streets & Roads — 5 Metrics To Track Every Month
Streets carry the heaviest resident attention of any department on this list, because a pothole is the one piece of infrastructure almost everyone drives over. These five metrics balance the visible, short-term response numbers against the longer-term condition trend that actually protects the road network.
Measured from citizen report or field inspection to repair completion. This is the single metric residents notice fastest, and the one most cities set a published SLA against.
A zero-to-100 score reflecting actual road surface condition rather than the volume of repair activity performed. Tracking PCI trend over time shows council whether the maintenance budget is preserving the network or losing ground.
Total maintenance spend divided by lane-miles serviced. A rising trend without a matching PCI improvement is usually a sign of reactive patching replacing planned resurfacing.
Falling behind the planned annual resurfacing percentage is the earliest warning sign of a growing backlog, long before it shows up as a drop in the overall PCI score.
Tracked by route priority tier rather than as one blended average, since arterial and school-zone routes carry tighter response expectations than residential streets.
Parks & Grounds — 5 Metrics To Track Every Month
Parks metrics tend to get less budget attention than streets or utilities, but complaints about overgrown turf or an unsafe playground move just as fast through a council inbox. These five keep grounds crews ahead of the visible problems instead of reacting to them.
A rough but useful staffing efficiency measure that flags whether crew size is keeping pace as new park acreage is added to the inventory.
One of the most visible grounds metrics — a missed mowing cycle generates complaints almost immediately, making this an early signal of crew capacity strain.
A liability-sensitive metric with zero acceptable margin — every playground should have a documented inspection record, not a verbal confirmation from a crew lead.
Covers broken benches, downed limbs, and restroom issues reported by residents. Broken out from emergency safety requests, which should carry a same-day target.
Irrigation faults are easy to miss until turf visibly browns out, which is why proactive fault tracking matters more than reactive complaint response here.
Utilities & Water — 5 Metrics To Track Every Month
Utility metrics carry the highest public safety stakes on this list, since a slow response to a main break or a lift station failure can turn into a service outage or a public health issue within hours, not weeks.
A main break affecting multiple accounts is a public safety metric as much as an operational one — every hour of delay adds pressure loss risk and potential contamination exposure.
The clearest early indicator of aging infrastructure risk, and the number most rate-setting and capital planning conversations should be built around.
Unplanned lift station downtime is one of the fastest paths to a sewer overflow event, which is why uptime deserves its own tracked metric rather than being folded into a general maintenance report.
The leading indicator that predicts most of the other utility metrics on this list — a slipping PM compliance rate today shows up as main breaks and lift station failures months later.
A quiet but expensive metric — high correction rates usually point to aging meter infrastructure or a data entry process that a CMMS-linked meter workflow can remove entirely.
Buildings & Facilities — 5 Metrics To Track Every Month
Facilities metrics are easy to overlook because buildings fail more slowly than a water main, but the cost of ignoring a rising backlog or a slipping HVAC PM rate shows up later as an emergency repair bill nobody budgeted for.
A rising backlog is usually the first visible sign that facilities staffing has not kept pace with the square footage the city now owns and maintains.
HVAC failures in city hall, a fire station, or a senior center are expensive and disruptive, and nearly all of them are preventable with a maintained filter and inspection schedule.
The facilities equivalent of PCI for roads — the ratio of deferred repair cost to full replacement value, and one of the strongest numbers to bring into a capital budget request.
A rising trend often points to deferred equipment maintenance long before an audit would catch it, making this a useful early-warning companion to the FCI score.
Reserved for failures that make a building unusable or unsafe, tracked separately from routine requests so an emergency never gets buried in a general queue.
Turn These 20 Metrics Into A Dashboard Your Council Can See
OxMaint pulls every metric on this list from the same work orders and PM schedules your crews are already completing — no separate spreadsheet, no month-end scramble before a budget hearing.
How To Put These 20 Metrics On A CMMS Instead Of A Spreadsheet
A KPI list only stays accurate if the numbers come from the same system crews use every day. Spreadsheets drift out of date the first week nobody has time to update them, and a report built from memory the night before a council meeting is a guess dressed up as data. Here is the sequence that keeps this playbook running without a manual reporting cycle.
Streets, park sites, utility assets, and buildings are set up as assets with condition baselines, so PCI, FCI, and uptime metrics have a starting point to measure against.
Mowing cycles, HVAC filter changes, playground inspections, and lift station checks are scheduled tasks, not reminders in someone's notebook — so compliance rate calculates itself.
Pothole reports, park complaints, and building issues all become timestamped work orders, which is what makes response-time metrics accurate instead of estimated.
Labor hours, parts, and contractor invoices tied to a work order feed cost-per-lane-mile, cost-per-square-foot, and similar cost metrics without a separate finance export.
Departments that check the dashboard monthly catch a slipping PM compliance rate or a growing backlog while it is still a small problem, not a council question. Waiting until budget season to look at the numbers means finding out about a problem months after it started, when the fix costs far more than it would have in month one.
What Changes When These 20 Metrics Move Into A CMMS
| Reporting Task | Spreadsheet Process | OxMaint CMMS | Change |
|---|---|---|---|
| Time to build a monthly KPI report | 6 to 10 hours | Under 30 minutes | -92% |
| Metrics updated in real time | 0 of 20 | 20 of 20 | 100% |
| PM compliance visibility | Manual tally, monthly | Live, by asset | Continuous |
| Response-time accuracy | Estimated from memory | Timestamped automatically | Verified |
| Council-ready export | Rebuilt each meeting cycle | One-click, always current | -80% prep time |
The departments that struggle with performance reporting are almost never short on data — they are short on a single place to put it. Every city already tracks pothole repairs, mowing schedules, main breaks, and HVAC filters somewhere. The moment those records live in one system instead of four separate logs, a 20-metric playbook stops being an extra project and becomes a report that generates itself. That is the difference between a KPI program that survives one budget cycle and one that becomes how the department actually runs. The cities that get the most out of this approach are rarely the largest ones — they are the ones willing to hold every department to the same five numbers, month after month, without exceptions.
That habit — checking the same 20 numbers on the same schedule, department after department — is what separates cities that treat performance measurement as a reporting chore from cities that treat it as how decisions actually get made. Neither the metrics nor the targets in this playbook are meant to be final; they are meant to be a starting point that is already better than no consistent tracking at all.
Frequently Asked Questions
Stop Rebuilding This Report By Hand Every Month
Put all 20 metrics on one dashboard, pulled straight from the work orders and PM schedules your crews already complete, and walk into every council meeting with current numbers instead of last quarter's estimate.