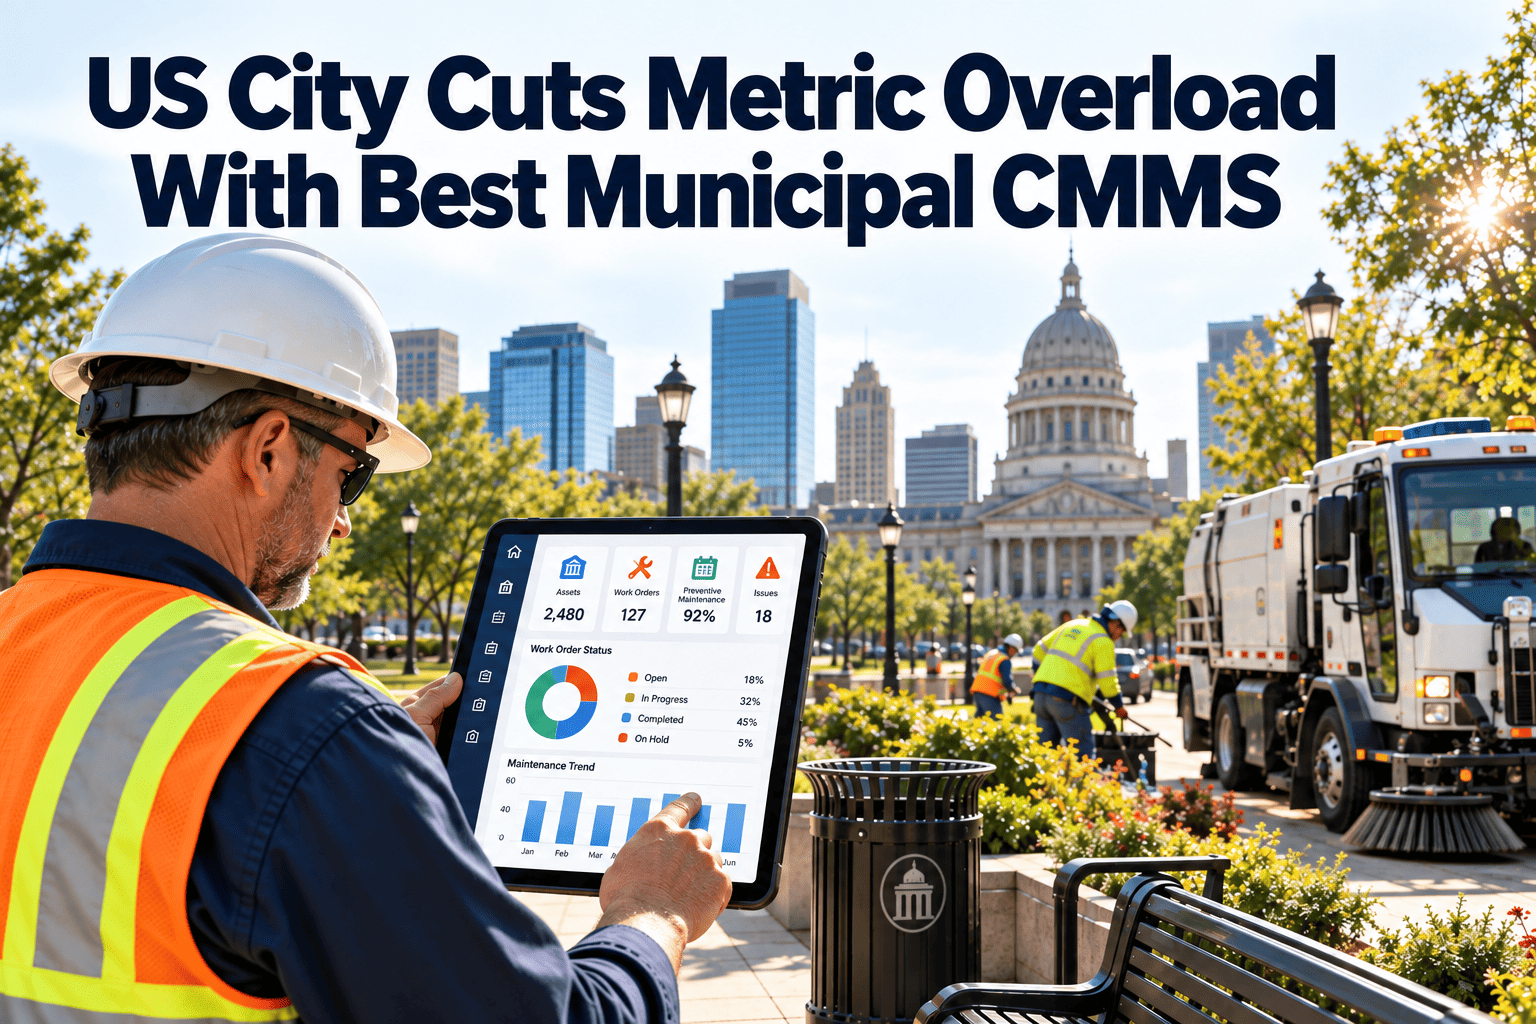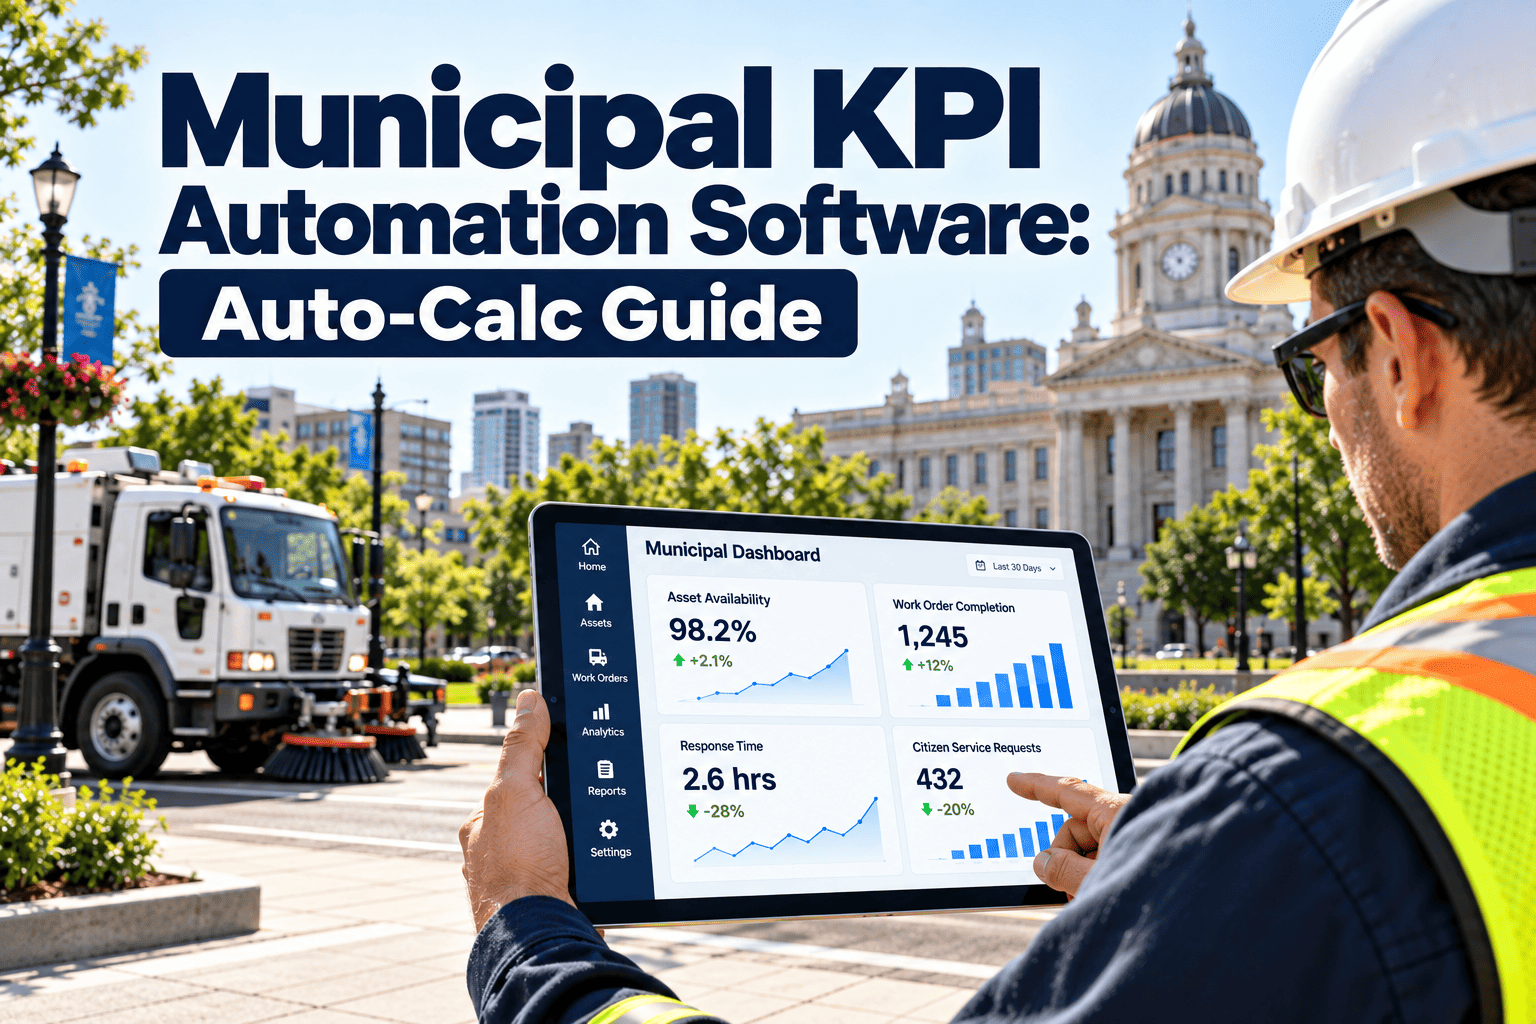
Every month, someone in the maintenance office exports work orders, pastes them into a workbook and rebuilds the same KPI formulas. By the time the report reaches the division head, the data is a week old and nobody is sure which version is right. Municipal KPI automation software calculates those figures continuously from live work orders. See how a CMMS with automatic KPI calculation removes the month-end scramble.
Municipal KPI Automation
From Month-End Spreadsheets to KPIs That Calculate Themselves
Replace manual Excel reporting with KPIs calculated automatically from live work order data, so city maintenance leaders see current numbers every day, not once a month.
Work orders and asset data
then
Definition rules applied
then
KPI values calculated
then
Live dashboards
The Month-End KPI Scramble
Manual KPI reporting follows a predictable cycle. Each step adds delay and another chance for error.
Day 1: Export
Staff pull work order lists from each system or module. Formats differ between divisions.
Days 2 to 3: Clean
Duplicates, blank dates and inconsistent status labels are fixed by hand.
Days 3 to 5: Calculate
Pivot tables and formulas are refreshed. Someone copies last month's file and hopes the ranges still match.
Days 5 to 7: Reconcile
Managers question the numbers. Analysts trace figures back to source rows.
Day 8 or later: Report
The pack is published. Any problem it reveals is already weeks old.
The cost is not only analyst time. Slow reporting means slow decisions about crews, parts and overdue preventive work.
Where Excel-Based KPI Reporting Breaks Down
| Weak point | How it shows up | Consequence |
|---|---|---|
| Broken references | A formula range misses new rows or a renamed column | KPI silently understates or overstates results |
| Version sprawl | Several copies of the workbook circulate by email | Divisions quote different figures for the same month |
| Manual edits | Values are overtyped to fix a problem | No audit trail, hard to reproduce |
| Person dependency | Only one analyst understands the file | Reporting stalls during leave or turnover |
| Static snapshots | Numbers reflect the export date only | Issues are found after they have grown |
| Limited drill-down | A total cannot be traced to work orders quickly | Debates replace decisions |
How Automated KPI Calculation Works
Automation is not a bigger spreadsheet. It moves the logic into the system that already holds the work.
1
Capture at the source
Technicians record start, finish, labour, parts and failure codes on mobile devices. Data enters once, at the point of work.
2
Apply agreed definitions
Each KPI formula, exclusion and time rule is stored in the platform. Every calculation uses the same version.
3
Calculate on live data
Values update as work orders open, progress and close. There is no export step and no manual refresh.
4
Slice by division and asset
The same KPI can be viewed by department, asset class, location or crew without rebuilding anything.
5
Drill down to records
Any figure links back to the work orders behind it, which shortens reconciliation and audit questions.
Which Municipal KPIs to Automate First
Begin with metrics that rely on data your teams already capture. Add others as data quality improves.
| KPI | Data needed | Why automate it |
|---|---|---|
| PM compliance | PM due dates, completion dates, status | Shows slipping preventive work while there is time to act |
| Maintenance backlog | Open work orders, priority, estimated hours | Changes daily, so monthly snapshots hide trends |
| Response time | Request time, dispatch time, arrival time | Supports service-level commitments |
| Mean time to repair | Start and finish times, wait time | Highlights slow repair categories |
| Planned vs reactive work | Work order type and trigger | Tracks progress toward proactive maintenance |
| Cost per asset class | Labour, parts, contractor cost | Feeds budget planning and replacement decisions |
Stop Rebuilding the Same Report Every Month
Watch KPIs calculate from live work orders, with drill-down to the records behind every number.
Data Readiness Checklist Before You Automate
Automation exposes data problems quickly. Address these items so the first dashboards earn trust.
Work order statuses limited to an agreed list
Start and finish times captured, not estimated later
Assets registered with class, location and criticality
Preventive schedules loaded with due dates and intervals
Priority levels defined the same way in each division
Failure and cause codes agreed and enforced
Labour and parts recorded against work orders
KPI formulas documented before they are configured
If several items are missing, treat the first reporting cycle as a data quality review rather than a scorecard.
Running Old and New Reports in Parallel
A parallel run builds confidence and reveals hidden assumptions in the old spreadsheets.
Legacy Excel process
- Monthly export and manual clean-up
- Formulas known to one analyst
- Figures fixed at the export date
- Adjustments made by overtyping
Automated calculation
- Continuous update from work orders
- Formulas stored and versioned in the platform
- Figures current to the last saved record
- Corrections made in the work order itself
Suggested parallel-run routine
- Run both methods for two full reporting cycles
- List every difference and trace it to a cause, such as an exclusion or a date rule
- Decide which behaviour is correct and update the definition, not the report
- Retire the spreadsheet only when division leads accept the automated figures
Governing Automated KPIs So They Stay Trusted
Automation removes manual effort, but it does not remove the need for ownership. A calculated number is only as reliable as the rules and records behind it.
Definition owner
Maintains the formula, exclusions and time rules for each KPI, and approves every change with a recorded reason.
Data steward per division
Reviews completeness of work orders each week, chases missing times and statuses, and reports recurring gaps to supervisors.
Report consumer
Managers and directors confirm the KPI answers the question they actually ask, and request new views through one channel.
A short monthly review of data quality metrics keeps the whole process honest.
Handling Exceptions and Corrections Without Overtyping
Spreadsheets allow quiet edits. Automated reporting needs a proper route for real-world exceptions such as duplicate requests, cancelled jobs and late entries.
1
Correct the source record
Fix the work order rather than the report. Every downstream KPI updates the same way and the change is logged.
2
Record the reason
Cancellations, reclassifications and date changes carry a reason code, so exclusions can be audited later.
3
Review outliers regularly
Very short or very long repair times often signal entry errors. A weekly outlier list keeps them from distorting averages.
4
Lock closed periods
Once a reporting period is approved, further changes follow a controlled process so published figures do not shift unnoticed.
Measuring the Payoff of KPI Automation
Track a few simple indicators before and after the change. Use your own baseline rather than borrowed benchmarks.
| Indicator | What to compare | What improvement looks like |
|---|---|---|
| Reporting cycle time | Days from period end to published report | Reports available immediately or within a day |
| Analyst hours on reporting | Time spent exporting, cleaning and checking | Hours shift to analysis and improvement |
| Data completeness | Share of work orders with all required fields | Rising completeness as gaps become visible |
| Disputed figures | Number of meetings spent debating numbers | Fewer disputes, quicker decisions |
| Time to detect a trend | How long a slipping KPI goes unnoticed | Issues raised within days, not months |
A Phased Roadmap for Replacing Excel Reporting
Phase 1: Baseline
Document current spreadsheets, formulas and owners. Identify the five to eight KPIs that matter most to leadership.
Phase 2: Configure
Set up statuses, work order types, asset classes and priorities to match the agreed definitions.
Phase 3: Pilot
Automate one or two divisions. Train supervisors on the fields that drive each KPI.
Phase 4: Parallel run
Compare automated and manual results, resolve differences and adjust rules where the old method was flawed.
Phase 5: Expand
Extend to remaining divisions, add dashboards for each audience and retire the legacy workbooks.
Keep the first release small. A reliable set of core KPIs is more valuable than a large set nobody trusts.
Common Automation Pitfalls
What goes wrong
- Automating formulas nobody has agreed on
- Ignoring gaps in field data until launch
- Building one dashboard for every audience
- Switching off Excel before trust is earned
- Leaving no owner for definitions
What works
- Agree definitions first, then configure them
- Treat early dashboards as a data quality check
- Tailor views to supervisors, managers and council
- Retire spreadsheets after a successful parallel run
- Assign named owners and a review schedule
Dashboards Built for Each Audience
Crew supervisors
Daily view of open work, overdue preventive tasks and jobs waiting on parts, so crews are assigned with current facts.
Division managers
Weekly trends in backlog, PM compliance and response time, with comparison to targets and prior periods.
Asset managers
Repeat failures, cost per asset class and reactive share, used to justify replacement or lifecycle change.
Directors and council
A short set of standard KPIs with clear definitions, ready for reports without a rebuild.
Excel Reporting vs Automated KPI Calculation
| Area | Excel workflow | Automated workflow |
|---|---|---|
| Update frequency | Monthly or quarterly | Continuous, viewable any day |
| Effort per cycle | Days of export, clean-up and checking | Review and comment only |
| Formula control | Held in individual files | Central, versioned definitions |
| Traceability | Manual search of source rows | Click from KPI to work orders |
| Consistency | Varies by analyst and division | Same rule applied to every record |
| Early warning | Problems found after the fact | Thresholds and alerts flag drift |
Thresholds and Alerts That Turn KPIs into Action
Live calculation lets teams act when a trend starts, instead of explaining it at month end.
- Alert a supervisor when overdue preventive work crosses an agreed level for an asset class
- Flag work orders that approach their response target before the target is missed
- Highlight assets with repeated corrective work in a short window
- Warn planners when parts shortages block a growing share of backlog
- Notify managers when reactive work rises above the division norm
Set thresholds with the people who own the work, then review them each quarter so alerts stay meaningful.
Oxmaint Capabilities That Support Automated KPIs
Work orders
Structured fields for type, priority, status, labour and parts feed every KPI calculation.
Preventive maintenance
Scheduled tasks with due dates enable PM compliance and forward workload views.
Asset management
A common asset hierarchy lets KPIs roll up by class, location and division.
Mobile workflows
Field entry of times and findings improves data accuracy at the source.
Inventory
Parts usage linked to work orders supports cost KPIs and shortage alerts.
Reporting and dashboards
Configurable views present standard KPIs to each audience without manual assembly.
Connecting Automated KPIs to Budget and Capital Planning
Live KPI data is most valuable when it feeds decisions outside the maintenance office. Finance and capital planners can use the same figures, with the same definitions, that operations use every day.
Operating budgets
Cost per asset class and reactive share show where emergency work consumes budget that preventive work could protect.
Capital renewal
Repeat-failure history and rising repair cost give evidence for replacing an asset instead of repairing it again.
Staffing and contracts
Backlog in labour hours and response performance help justify crew changes or contractor support.
Access and permissions
- Give each role a view suited to its decisions, without exposing unrelated records
- Limit who can edit KPI definitions to the named definition owners
- Keep a change history so any figure can be explained to auditors
- Share summary dashboards with leadership while detail stays with the divisions
Trends in Municipal Performance Reporting
- Cities increasingly publish service performance data to residents, which raises expectations for accuracy and timeliness
- Asset management programmes aligned with ISO 55001 concepts favour measurable, repeatable performance indicators
- Condition monitoring and inspection findings now create work orders automatically, adding new data for KPIs
- Tight budgets push teams to prove the value of preventive work with evidence rather than opinion
Each trend favours reporting that is automatic, consistent and traceable.
Quick Self-Assessment: Is Your City Ready to Automate?
Answer these honestly. Each item you cannot confirm is a task for the first phase, not a reason to delay.
We can name the person who owns each reported KPI formula
Two analysts would calculate backlog the same way
Technicians close work orders with real completion times
Preventive schedules exist for critical assets in every division
Leadership agrees on the short list of KPIs that matter
We can trace a reported number back to individual work orders within minutes
Most cities find three or four gaps. Closing them improves maintenance data even before automation goes live.
Municipal KPI Automation FAQs
Can we keep using Excel for some analysis?
Yes. Data can still be exported for special studies, while official KPIs come from the system.
How long does automation take to set up?
It depends on data quality and the number of KPIs. Book a demo to scope a first set.
Will automated numbers differ from our old reports?
Often, because old spreadsheets hide exclusions. A parallel run explains each difference before you switch.
What if our work order data is incomplete?
Start with the KPIs your data supports and improve capture. Start a trial to test with your own records.
Who owns the KPI formulas?
Name an owner per KPI, ideally in a central maintenance systems or asset management role.
Give Your Team the Numbers Without the Month-End Rush
Move city maintenance reporting from spreadsheets to KPIs that update themselves and can be traced to the work.