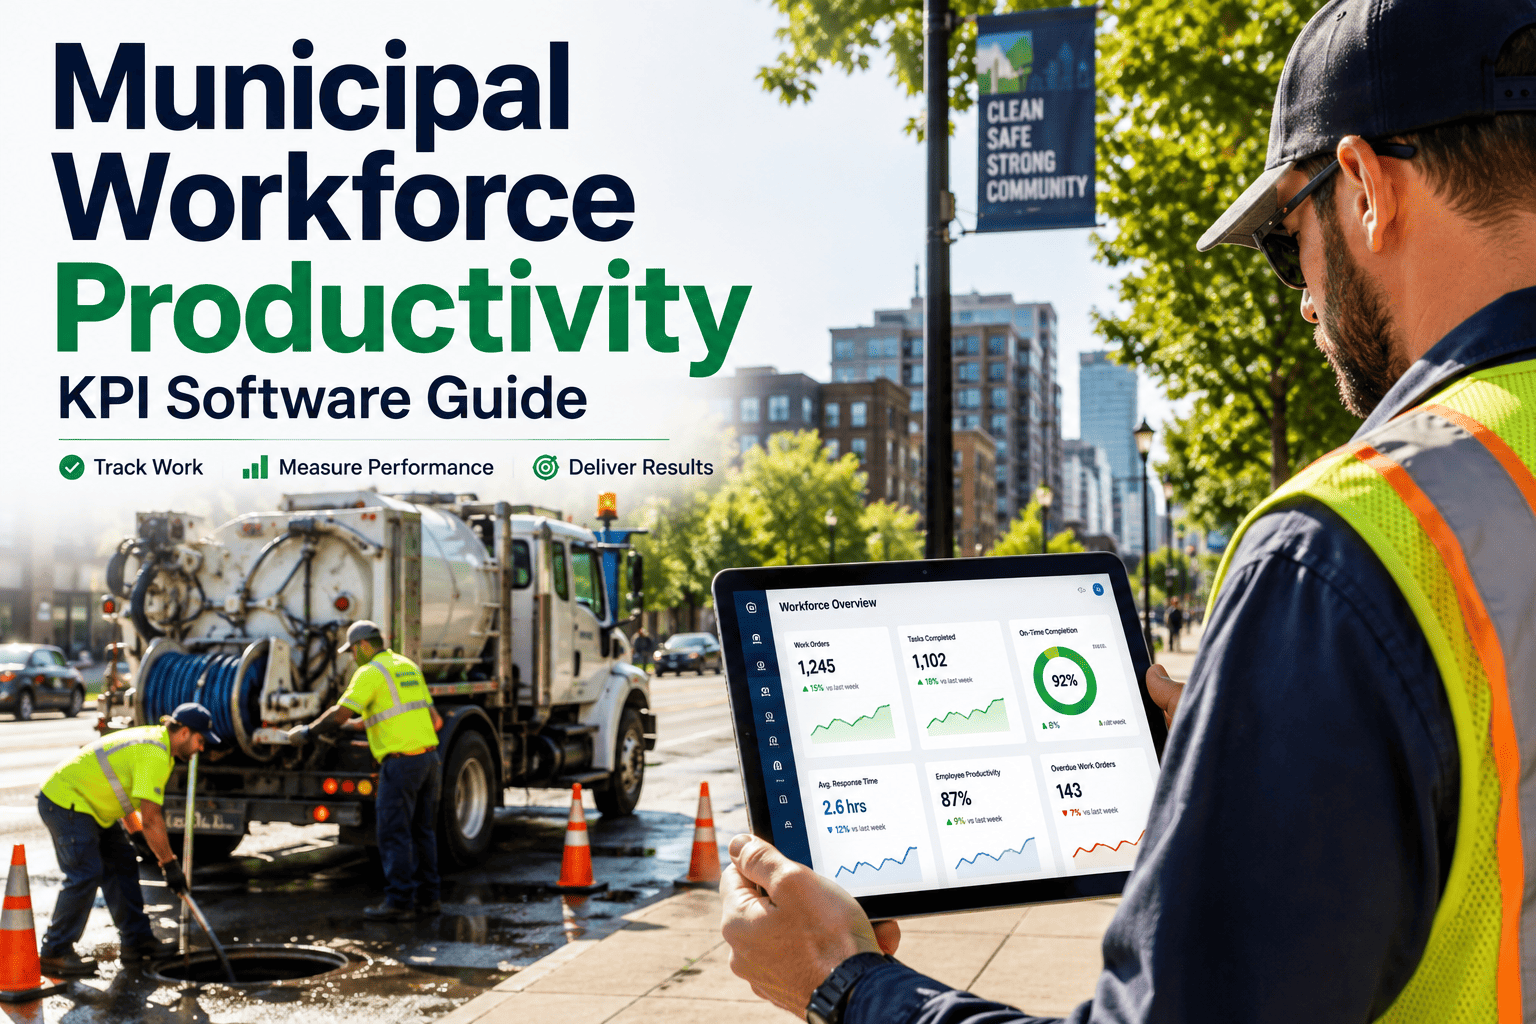
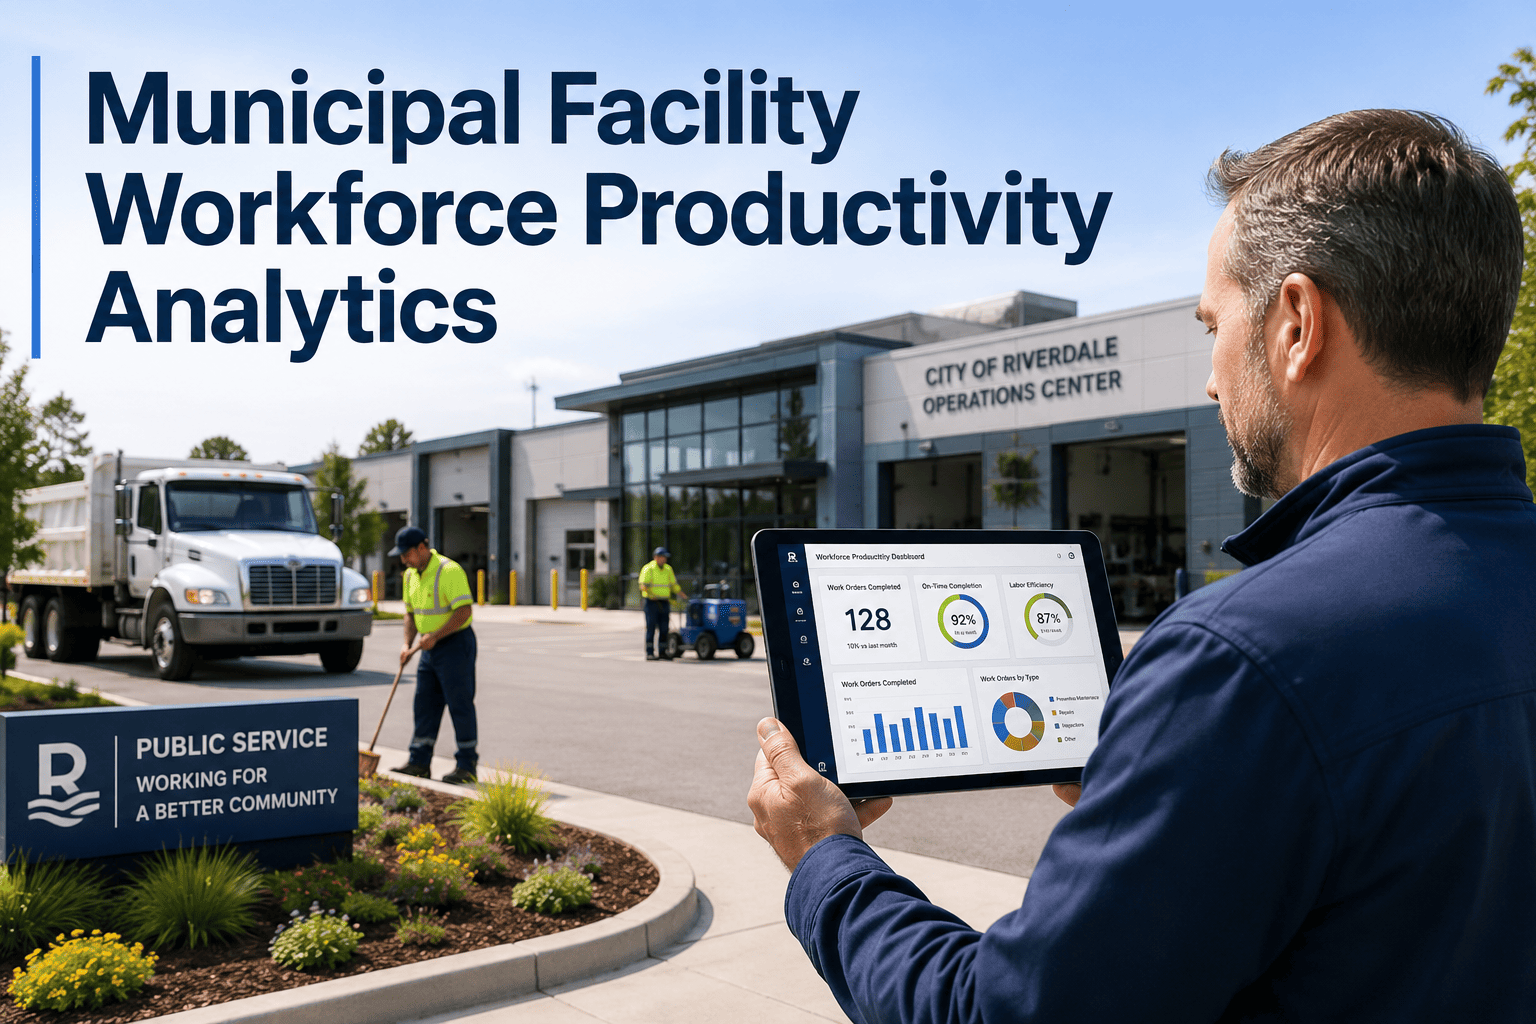
Ask most public works directors how productive their maintenance crews are, and the honest answer is a guess. Municipal workforce productivity is one of the most politically sensitive numbers in city government — council members ask about it during budget season, citizens compare it to whatever the neighboring city reports, and yet most departments still cannot produce a real wrench-time figure without a manual time study that takes weeks to run. The tools to measure this in real time already exist inside a properly configured CMMS: wrench time, work orders per technician, craft utilization, and PM compliance are not abstract HR metrics, they are numbers a maintenance management system can calculate automatically from the work already being logged. Seeing those four KPIs update themselves changes how a department defends its budget and staffs its crews.
Municipal Public Works · Workforce KPIs · CMMS-Driven Reporting
Municipal Workforce Productivity KPI Software — Wrench Time, WO-Per-Tech, and Craft Utilization
The four numbers that decide whether your next budget request gets approved or questioned — and how a CMMS calculates all of them automatically instead of a manual time study.
The Four Core KPIs
The Productivity Numbers Every Public Works Department Should Be Tracking
Workforce productivity in a municipal maintenance operation comes down to four measurable numbers. Each one answers a different question a council member, a budget office, or a new director is eventually going to ask.
Time on Tools
Wrench Time
The percentage of a technician's paid shift actually spent performing repair or maintenance work, excluding travel, waiting on parts, searching for a work order, or administrative tasks.
Formula: hours on active repair work ÷ total paid hours
Throughput
Work Orders per Technician
The average number of work orders a technician completes over a given period, used to compare throughput across crews, shifts, or trade specialties within the same department.
Formula: completed work orders ÷ active technicians
Labor Efficiency
Craft Utilization
The share of scheduled labor hours for a specific trade — electrical, HVAC, fleet, water and sewer — that goes toward productive, assigned work rather than idle or unassigned time.
Formula: assigned productive hours ÷ scheduled trade hours
Schedule Adherence
PM Compliance Rate
The percentage of preventive maintenance tasks completed within their scheduled window, a leading indicator of whether reactive work will climb in the following quarter.
Formula: PM tasks completed on schedule ÷ PM tasks due
Why the Numbers Go Missing
Why Most Cities Cannot Produce These KPIs Today
The KPIs are not hard to define — they are hard to calculate when work is tracked on paper timesheets, radio dispatch logs, and a spreadsheet someone updates at the end of the week. A technician's day might involve six separate jobs, two of which never get formally logged because they were quick fixes handled off a verbal request. Travel time between job sites blends into repair time on a handwritten sheet, so wrench time gets estimated rather than measured. Without a timestamp on when a work order was opened, assigned, started, and closed, work orders per technician becomes a headcount exercise instead of a productivity measure. Most departments do not lack productive crews — they lack a system that captures the timestamps productivity is actually built from. Start a free trial or book a demo to see what automatic timestamp capture looks like on a real work order.
Benchmark Ranges
Where Municipal Departments Typically Land on Each KPI
Wrench Time — Paper-Based Tracking
28% – 35%
Wrench Time — CMMS-Tracked Crews
55% – 65%
PM Compliance — Paper-Based Tracking
40% – 50%
PM Compliance — CMMS-Tracked Crews
85% – 92%
Typical Wrench Time Gain After CMMS Adoption
Up to 25 percentage points
For a 40-technician department, closing even half that gap is the productive equivalent of adding several full-time positions without a single new hire on the budget.
Manual vs Automated
How Each KPI Is Captured, Before and After a CMMS
OxMaint · Municipal Workforce KPIs
Stop Estimating Wrench Time. Start Measuring It.
OxMaint captures the timestamp on every work order automatically, turning wrench time, work orders per technician, craft utilization, and PM compliance into live numbers instead of a once-a-year manual study.
What Visibility Changes
What Happens Once a Department Can See These KPIs Live
Budget Season
Defensible Staffing Requests
A staffing request backed by a documented wrench-time gap and a rising work order backlog is a very different conversation than a request backed by a verbal impression that the crew feels stretched thin.
Daily Operations
Faster Dispatch Decisions
A supervisor who can see craft utilization in real time can shift a technician between jobs before a backlog forms, instead of discovering the imbalance at the end of the week.
Preventive Program
Fewer Emergency Callouts
Departments that keep PM compliance visible and above target consistently report fewer after-hours emergency work orders the following quarter, since fewer assets fail unexpectedly.
Council Reporting
Numbers That Match the Story
When the KPI export matches what the director says in a council meeting, it removes the credibility gap that comes from presenting numbers nobody can trace back to a source.
Public Works Leaders Ask
Municipal Workforce Productivity KPIs — Common Questions
What is a realistic wrench time target for a municipal maintenance crew?
+
Most CMMS-tracked municipal crews land between 55% and 65% once travel, dispatch, and admin time are separated out clearly.
Start a free trial to see your department's current baseline.
Can craft utilization be tracked separately for each trade in one department?
+
Yes. Electrical, HVAC, fleet, and water and sewer crews can each be segmented and reported on individually, so one underperforming trade does not get hidden inside a department-wide average.
Does tracking these KPIs require new hardware for field technicians?
+
No. Technicians log work orders from a mobile app on a phone or tablet they already carry, and the timestamps needed for every KPI are captured automatically as part of that normal workflow.
How quickly can a department expect to see wrench time improve?
+
Measurement improves immediately once timestamps are captured. Actual wrench-time gains typically build over one to two quarters as dispatch and scheduling adjust to the visible data.
Book a demo to map a realistic timeline for your crew size.
Can these KPI reports be exported for a council or budget presentation?
+
Yes. Wrench time, work orders per technician, craft utilization, and PM compliance can each be exported as a summary report formatted for budget and council presentations on demand.
OxMaint · Municipal Workforce KPIs · Live Dashboards
Your Crews Are Working. Now Prove It With Numbers That Hold Up.
OxMaint turns every logged work order into the timestamps wrench time, work orders per technician, craft utilization, and PM compliance are calculated from — automatically, without a manual time study or a spreadsheet reconciliation at month end.