Every water utility loses water it has already paid to treat, pump, and chemically dose — the only question is whether that loss is measured, located, and fixed, or quietly absorbed into the next rate case. Nearly one in five gallons of treated drinking water in the United States never reaches a paying customer, and industry researchers place the global average even higher, with real losses from leaks, pipe bursts, and background seepage responsible for the vast majority of it. For water and wastewater operators, non-revenue water is not an abstract accounting line — it shows up as pumps running longer than they should, chemicals dosed into water nobody bills for, and capital plans built on a supply picture that was never accurate to begin with. Leak detection, pressure management, and district metered area analysis close that gap by locating loss at the pipe segment instead of guessing at the system level. Activate OxMaint to turn your utility's water audit data into a structured, prioritized non-revenue water reduction program.
Non-Revenue Water · Leak Detection · Pressure Management · OxMaint
Non-Revenue Water Is Money Your Utility Already Spent. Leak Detection Analytics Is How You Get the Water Back.
OxMaint AI water loss analytics turns district metered area data, pressure logs, and acoustic survey results into a ranked list of where your system is losing water — and routes every finding straight into a work order before it becomes a main break.
19.5%
of treated drinking water in the US is lost before it reaches a paying customer or is properly billed
$6.4B
in uncaptured revenue lost annually by US utilities to non-revenue water, according to industry research
2 min
is the average interval between water main breaks somewhere across the aging US distribution network
87%
of total water loss comes from real losses — leaks, pipe bursts, and background seepage — not from metering or billing errors. That means the fastest path to revenue recovery is not a billing audit, it's finding the physical leak. Utilities that pair district metering with acoustic and pressure analytics typically cut losses in half within two to four years. OxMaint connects every audit finding to a scored, dispatched leak repair task so water loss stops being a line item and starts being a work queue.
Four Water Loss Detection Methods OxMaint Analyzes and Scores
DMA — District Metered Areas
District Metered Area Monitoring & Minimum Night Flow Analysis
Splitting a distribution network into discrete metered zones is the foundation of any serious leak detection program — it tells you which part of the system is losing water before you send a crew to look for it. OxMaint tracks minimum night flow per zone, the period when legitimate consumption should be near zero, and flags any zone where night flow climbs above its historical baseline.
Activate OxMaint to set up zone-level flow baselines for your distribution network.
Key Analytics OxMaint Generates
Minimum night flow trend per DMA zone, benchmarked to baseline
Zone-level loss ranking — worst-performing areas surfaced first
Inflow vs billed consumption reconciliation by metered area
Seasonal drift detection — separates weather effects from real loss
Loss Signals DMA Data Reveals
Rising night flow with no consumption source — likely undetected leak
Zone boundary meter drift — apparent loss masking real loss trends
New illegal connections — sudden unexplained demand increase
ALD — Acoustic Leak Detection
Acoustic Sensor Correlation & Leak Pinpointing
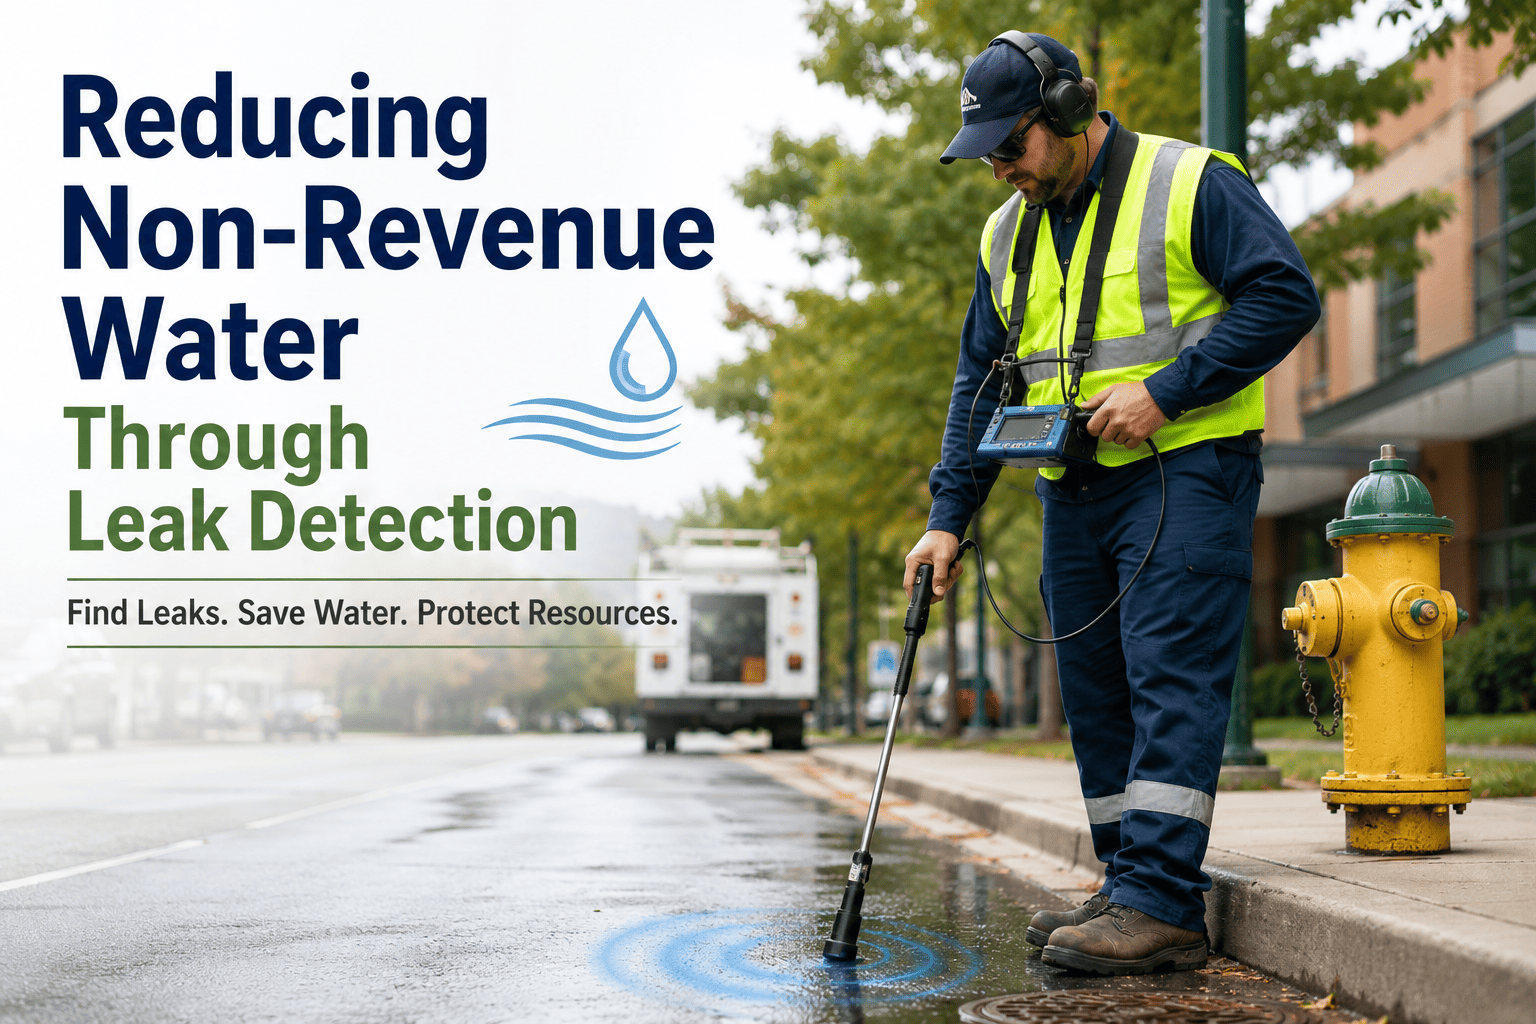
Acoustic loggers listen for the distinct sound signature a pressurized leak makes as it escapes through pipe material — and correlating two sensors on either side of a suspected leak narrows the location to within a few feet. OxMaint ingests correlator and logger output, ranks findings by confidence score, and routes high-confidence leaks directly to a repair work order with pipe material and depth context attached.
Book a demo to see acoustic survey results flow into scored repair tasks.
Key Analytics OxMaint Generates
Leak confidence score per acoustic reading — prioritize repair dispatch
Pipe material and age correlation — identify systemic failure patterns
Repeat survey comparison — track new leaks against last sweep
Estimated flow-loss volume per confirmed leak, in gallons per day
Loss Signals Acoustic Data Reveals
High-confidence leak signatures — direct repair dispatch candidates
Material fatigue clusters — cast iron and asbestos cement segments
Joint and service line failures — most common small-leak source
PRM — Pressure Management
Pressure Zone Control & Burst Frequency Correlation
Excess pressure is one of the most controllable drivers of both background leakage and outright pipe bursts — every extra psi above the minimum needed for service pushes more water through every existing crack and joint. OxMaint correlates zone pressure readings against historical burst locations and calculates the leakage reduction available from pressure reducing valve adjustments before a single valve is touched.
Activate OxMaint to model pressure reduction impact for your highest-loss zones.
Key Analytics OxMaint Generates
Average and peak zone pressure — compared to minimum service requirement
Burst frequency correlation — pressure history against historical repair log
Modeled leakage reduction from PRV setpoint adjustment, in gallons saved
Transient pressure spike detection — pump start and valve closure events
Loss Signals Pressure Data Reveals
Chronic over-pressurization — elevated background leakage across the zone
Transient spikes — precursor pattern to sudden main break events
PRV drift or failure — zone pressure trending outside setpoint over time
AMI — Smart Meter Analytics
AMI Data Review & Apparent Loss Detection
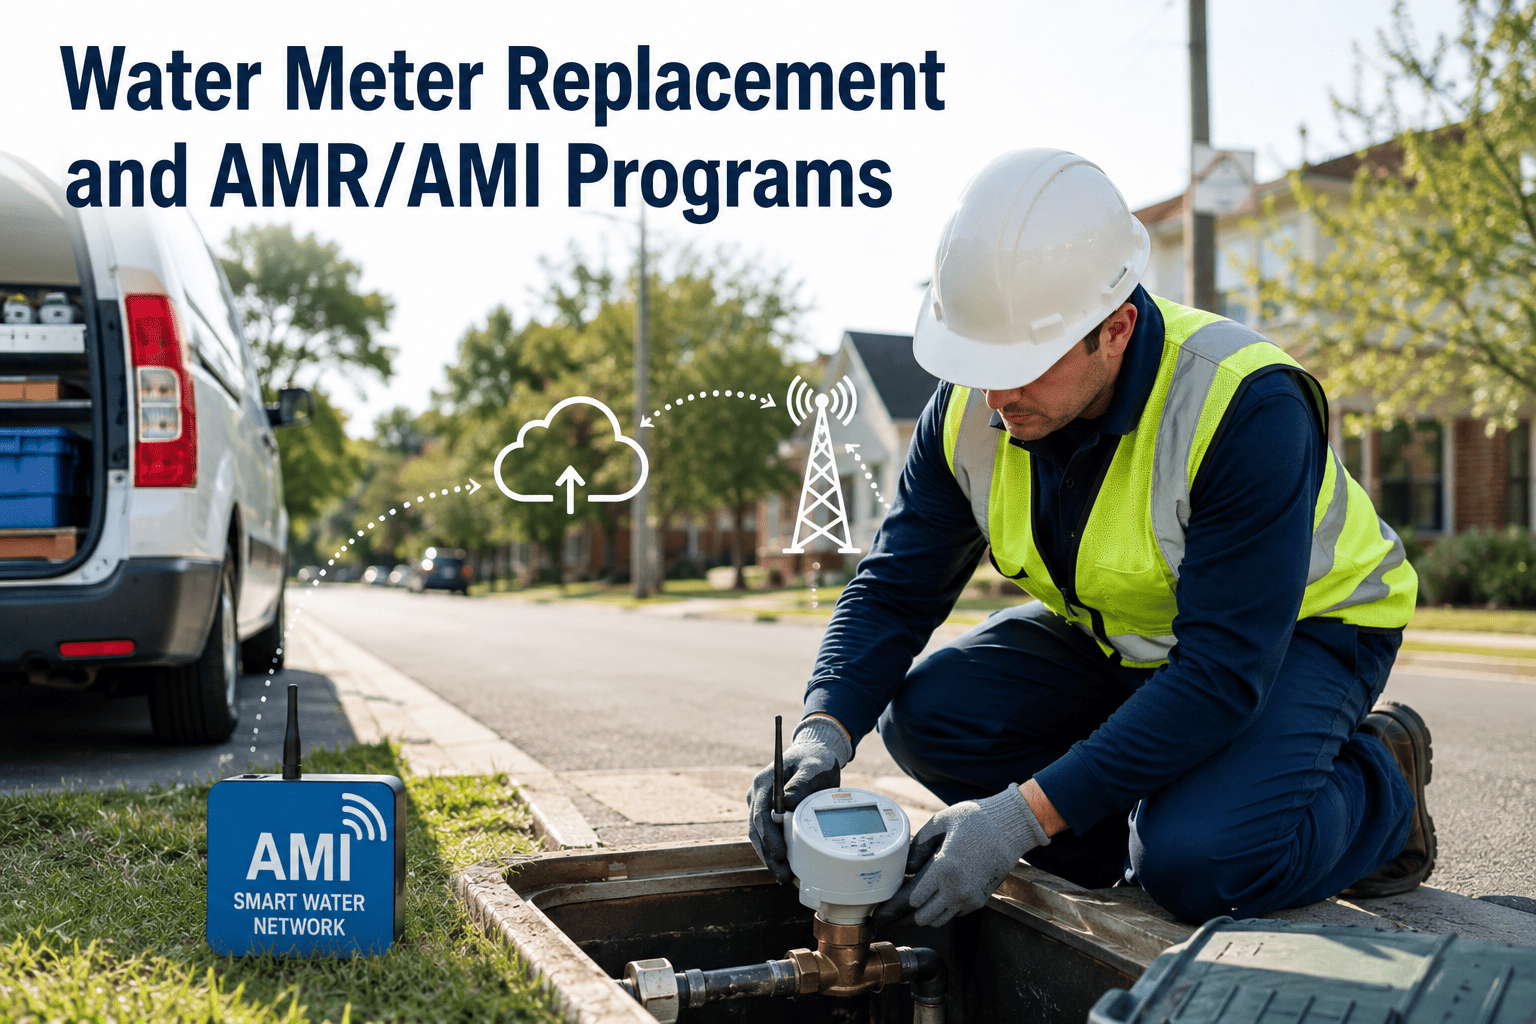
Not every gallon that goes missing is a physical leak — under-registering meters, data transfer errors, and unmetered authorized use account for the remaining share of non-revenue water, and advanced metering infrastructure data is how you find it. OxMaint cross-references AMI consumption patterns against expected usage profiles to flag meters that are likely under-registering before the next billing cycle locks in the loss.
Book a demo to see apparent loss detection applied to your AMI dataset.
Key Analytics OxMaint Generates
Meter accuracy drift flagging by age, size, and usage pattern
Zero-consumption account review — vacant, stopped, or bypassed meters
Unbilled authorized use tracking — hydrant flushing, firefighting, flushing
Billing data reconciliation against production volume, by billing cycle
Loss Signals AMI Data Reveals
Under-registering meters — direct revenue loss without physical leakage
Data transfer gaps — missed reads inflating apparent loss figures
Unauthorized consumption — theft or illegal connections on the network
OxMaint Non-Revenue Water Analytics · AI Loss Detection
Every Gallon of Non-Revenue Water Is Either Being Located and Recovered — or Quietly Funding Next Year's Rate Increase
OxMaint AI scores every zone, ranks every leak signal, and routes every finding into a work order automatically. Water audit data that used to sit in a spreadsheet now becomes a recovery plan.
How OxMaint AI Converts Water Loss Data Into a Recovery Plan
Three AI Analytics Workflows That Close the Loop Between Audit and Repair
Analytics Type · Audit
AWWA-Aligned Water Balance Scoring
OxMaint structures your system input volume, billed consumption, and loss categories into a standard water balance, calculating an Infrastructure Leakage Index so performance can be benchmarked against peer utilities rather than judged on a raw percentage alone.
Audit alert: ILI trending upward quarter over quarter → review triggered
Analytics Type · Pattern
Loss Hotspot & Zone Heat Mapping
Leak signals, pressure anomalies, and night flow deviations are plotted on a single zone map. When multiple loss signals cluster at the same segment, OxMaint elevates it to a priority repair candidate instead of leaving it buried across separate reports.
Pattern alert: 2+ loss signals overlapping at same segment within 30 days
Analytics Type · Forecast
Revenue Recovery Forecasting
OxMaint models the projected revenue and production-cost savings from repairing each ranked leak, using local water rate and treatment cost inputs — giving finance and operations a shared, defensible business case for repair budget priority.
Forecast alert: repair payback under 12 months → funding priority flag
Non-Revenue Water Risk by System Profile — What OxMaint Monitors
Critical Risk Profile
Aging Cast Iron Networks
Pipe material installed before mid-century is the leading driver of background leakage nationwide. OxMaint weights acoustic and burst-history findings higher on cast iron and asbestos cement segments, where failure probability compounds year over year.
Critical Risk Profile
Small & Rural Utilities
Systems with limited staffing and long transmission distances report water losses well above 20% on average. OxMaint's automated scoring gives small operations the prioritization power a large utility's engineering team would otherwise provide manually.
Critical Risk Profile
High-Pressure Transmission Zones
Zones carrying pressure well above minimum service requirements see disproportionately higher background leakage and burst frequency. OxMaint flags these zones first for pressure reducing valve review before physical inspection begins.
Elevated Risk Profile
Growing Suburban Systems
Rapid main extension without matching leak detection investment quietly grows the loss base. OxMaint tracks new-segment performance separately so expansion-driven loss doesn't get lost inside a system-wide average.
Elevated Risk Profile
Seasonal & Agricultural Demand Areas
Irrigation season swings make it hard to separate legitimate seasonal demand from real loss using raw consumption figures alone. OxMaint's seasonal baseline modeling isolates the two so summer spikes don't mask an actual leak.
Elevated Risk Profile
Coastal & Corrosive Soil Systems
Soil chemistry accelerates pipe corrosion well beyond a system's rated service life. OxMaint applies location-specific corrosion risk weighting so buried-asset condition, not just age, informs repair prioritization.
Leak Detection Method Comparison — OxMaint Analytics Coverage
Documented Outcomes from Non-Revenue Water Reduction Programs
50%
reduction in non-revenue water is an achievable target within two to four years for utilities starting above 20% loss
6-8%
is the non-revenue water level achieved by leading utilities combining regulation, technology, and active leak control
2.7T gal
of treated water is lost annually across US systems — a recoverable supply source without new infrastructure
2-4 yrs
typical timeline to cut non-revenue water in half with a funded, structured detection program
87%
of total water loss volume comes from real physical losses rather than billing or metering errors
2.2M mi
of aging water distribution pipe across the US, much of it approaching the end of its service life
$0
in new supply infrastructure required — recovered leakage is treated water your utility already produced
Frequently Asked Questions — Non-Revenue Water & Leak Detection
What is the difference between real losses and apparent losses in non-revenue water?
Real losses are physical water lost through leaks, bursts, and background seepage, while apparent losses come from metering inaccuracy, data errors, and theft.
Activate OxMaint to separate the two categories automatically from your existing audit data.
How does OxMaint prioritize which leak signals get dispatched first for repair?
OxMaint ranks findings by confidence score, estimated flow-loss volume, and pipe criticality, so crews are dispatched to the highest-value repairs first instead of working leak reports in the order they arrived.
Book a demo to see repair prioritization in action.
Can OxMaint work with the acoustic loggers and pressure sensors our utility already owns?
Yes. OxMaint ingests data from existing acoustic loggers, pressure sensors, and AMI systems rather than requiring new field hardware, so a detection program can start with the equipment already deployed across your network.
Does non-revenue water reduction require a large capital investment to see results?
Reducing apparent losses through meter and billing corrections often pays back quickly, while physical leak repair typically needs planned capital, but both start with the same audit and detection data.
Activate OxMaint to model recovery payback before committing capital.
How is an Infrastructure Leakage Index different from a simple loss percentage?
A loss percentage ignores system size, pressure, and pipe length, while the Infrastructure Leakage Index adjusts for those factors so utilities of different sizes can be benchmarked fairly against each other.
The Water Your System Lost This Month Is Either Getting Found — or Getting Written Off. OxMaint Decides Which.
AI water balance scoring, leak ranking, and automated repair dispatch — start recovering revenue today.