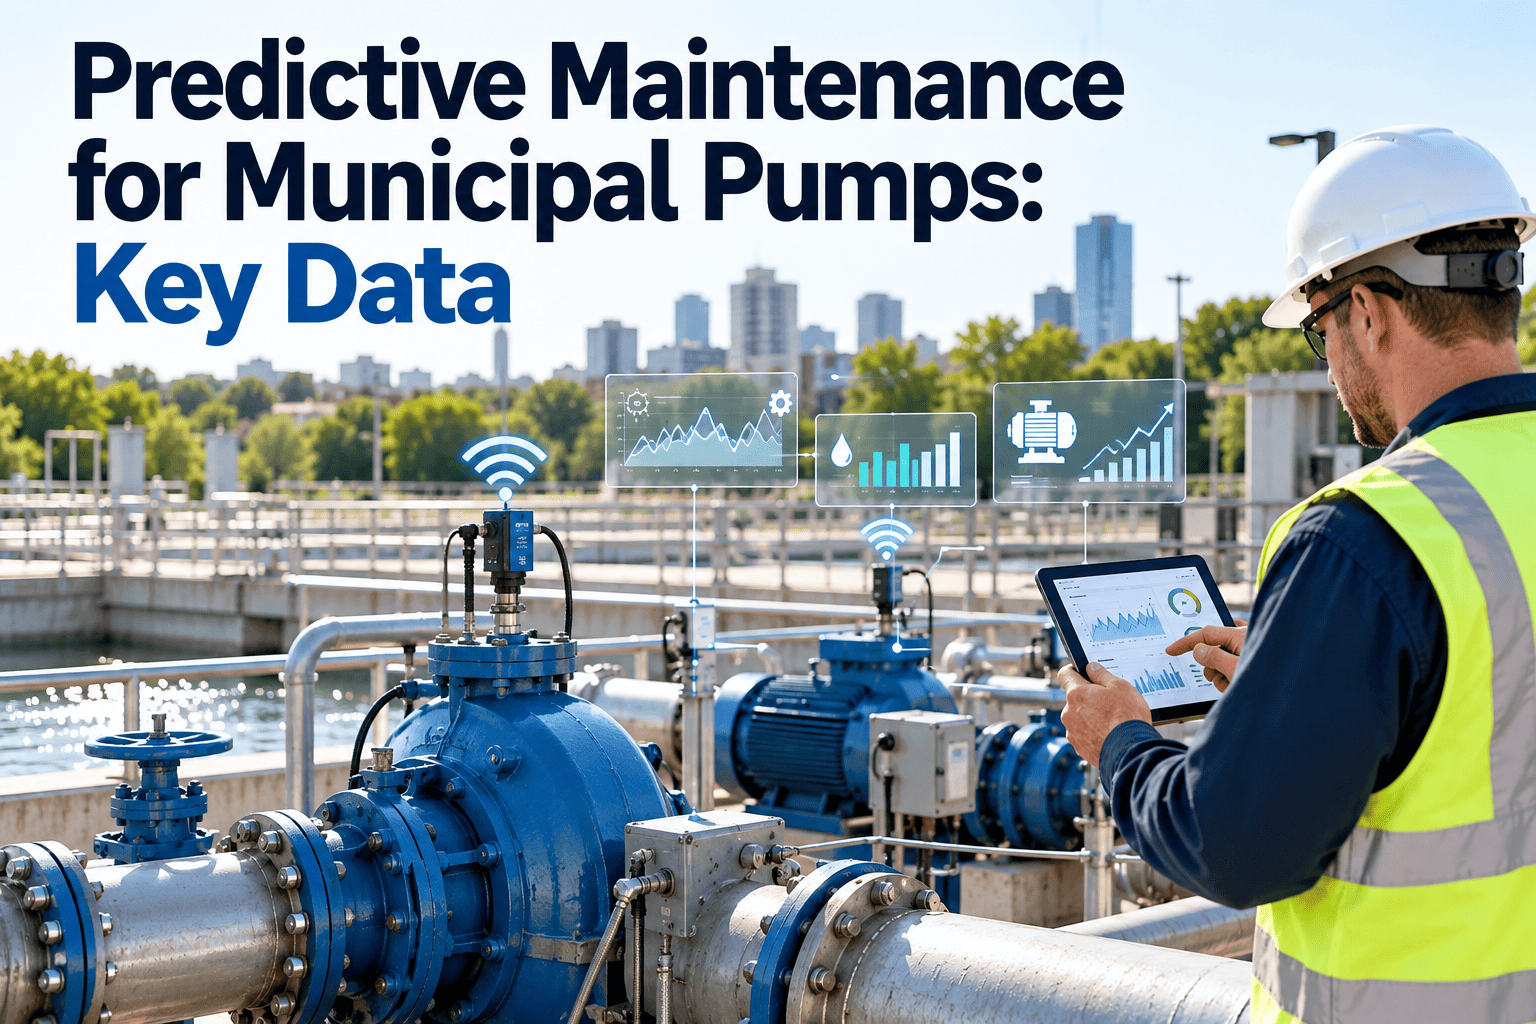
A lift station pump rarely fails without warning. Vibration climbs, bearings run hotter, amperage drifts and flow falls off, but the signals sit in different logs or in nobody's view at all. Predictive maintenance for pumps works by collecting those signals, comparing them with a healthy baseline and acting while the repair is still planned work. This guide covers the key data municipal water and wastewater teams should capture and how to turn it into thresholds and work orders. To see how condition readings can trigger maintenance tasks, book a short walkthrough.
Predictive maintenance for municipal pumps: the data that warns you before an outage
Learn which readings matter, how to set thresholds from your own baseline and how to convert early warnings into scheduled work.
Common pump failure modes and the signals that precede them
Predictive work starts by knowing what you are trying to catch. Each failure mode tends to leave a different early trail.
| Failure mode | Typical causes | Early signals | Data to watch |
|---|---|---|---|
| Bearing wear | Lubrication problems, misalignment, contamination | Rising vibration and temperature | Vibration, bearing temperature, oil condition |
| Seal leakage | Dry running, shaft movement, abrasive solids | Leakage, seal water changes, moisture alarms | Inspection notes, seal chamber sensors |
| Cavitation | Low suction head, blocked inlet, off-curve operation | Noise, pressure fluctuation, vibration | Suction and discharge pressure, vibration |
| Impeller wear or clogging | Rags, grit, corrosion, abrasion | Lower flow, higher amperage, longer run times | Flow, motor current, run hours |
| Motor winding problems | Overheating, moisture, voltage imbalance | Rising winding temperature, current imbalance | Winding temperature, current, insulation tests |
| Misalignment or looseness | Settling, thermal growth, poor installation | Elevated vibration at specific frequencies | Vibration spectra, alignment checks |
Where your pump program sits on the maintenance ladder
Predictive maintenance is the top step of a climb. Most utilities do not need to jump there overnight and can move one step at a time.
The data to capture for pump condition monitoring
You do not need every sensor on every pump. Start with the readings that match your most common failures and your most critical stations.
Mechanical
- Vibration level and frequency content
- Bearing temperature
- Lubricant condition and level
- Shaft alignment and seal condition
Electrical
- Motor current and current balance
- Voltage and power factor
- Winding temperature
- Starts per hour and insulation test results
Hydraulic
- Flow rate
- Suction and discharge pressure
- Wet well level
- Position on the pump curve
Operational
- Run hours and cycle counts
- Energy use per volume pumped
- Alarms and trips
- Manual rounds and operator notes
How to set pump alert thresholds that crews will trust
Generic limits create false alarms. Use manufacturer guidance, applicable standards and your own baseline, then refine with experience.
- 1
Capture a baseline
Record readings when the pump is newly overhauled or known to be healthy, at normal operating conditions.
- 2
Start from published limits
Use the manufacturer's limits and vibration severity guidance such as ISO 20816 zones as a reference point.
- 3
Define watch, warning and action levels
Use three tiers so a small drift prompts a check, while a larger change triggers a work order.
- 4
Trend, do not just alarm
A steady climb below the limit often matters more than a one-time spike during a transient.
- 5
Review after every event
Compare each failure or false alarm with the data and adjust thresholds.
From sensor reading to completed work order
Collecting data does not prevent failures. The value comes from the response path that follows it.
Link pump condition readings to the work orders that prevent failures
See how thresholds, inspections and corrective tasks can work together for your lift stations and plants.
Which pumps deserve monitoring first
Different pump types carry different consequences when they stop. Spend monitoring effort where failure costs the most.
| Pump type | Consequence of failure | Monitoring focus |
|---|---|---|
| Sewage lift stations | Overflows, environmental violations, public complaints | Run time, current, wet well level, alarms, vibration where practical |
| Raw and finished water pumps | Loss of supply, pressure problems, treatment disruption | Flow, pressure, vibration and motor condition |
| Booster stations | Low pressure in parts of the system | Pressure, current, start counts |
| Treatment process pumps | Process upset, quality exceedances | Flow, vibration, seal and bearing condition |
| Standby and backup units | Failure on demand when the duty pump trips | Test run records and readiness checks |
A practical pilot plan for predictive pump maintenance
A narrow pilot builds credibility faster than a utility-wide sensor rollout.
Mistakes that undermine pump predictive programs
- Buying sensors before defining response: alerts that nobody owns are ignored within weeks.
- Ignoring operating conditions: a pump running far from its best efficiency point can look unhealthy for hydraulic reasons.
- Keeping data in separate systems: SCADA, spreadsheets and maintenance records should connect to the same asset.
- Setting one limit for all pumps: size, speed and installation change what normal looks like.
- Skipping failure analysis: without cause codes, thresholds and models cannot improve.
KPIs for a municipal pump maintenance program
Comparing condition monitoring technologies for pumps
No single technique catches every failure. Pick the technology that matches the pump's criticality, accessibility and the failure modes you worry about most.
| Technology | What it measures | Strengths | Limits |
|---|---|---|---|
| Handheld vibration routes | Vibration at bearings during scheduled rounds | Low entry cost and easy to start on many pumps | Only a snapshot, so fast-developing faults can be missed |
| Permanently installed vibration sensors | Continuous vibration and sometimes temperature | Catches trends and sudden changes without a site visit | Higher cost, so best kept for critical pumps |
| Motor current monitoring | Current draw, balance and load patterns | Often available from existing drives and starters | Indirect for mechanical faults, so needs interpretation |
| Thermal imaging | Surface temperature of motors, bearings and electrical connections | Fast, non-contact and good for spotting hot connections | Reads surface only and needs consistent conditions |
| Oil and lubricant analysis | Wear particles, contamination and lubricant condition | Shows internal wear before it is audible | Applies only to oil-lubricated equipment and has lab lead time |
| SCADA process data | Flow, pressure, level, run status and alarms | Already in place at many stations | Detects performance changes, not always their cause |
How an early warning plays out at a lift station
The scenario below is a hypothetical example to show how the pieces connect. It is not a case study.
- 1
A trend appears
Weekly rounds show bearing vibration on a duty pump creeping upward compared with its baseline, while still under the alarm level.
- 2
The watch tier opens an inspection
The reading crosses the watch level and a short inspection task is created for the next visit, covering lubrication and alignment.
- 3
The crew confirms a cause
The technician finds low lubricant and early looseness at the coupling, records photos and creates a corrective work order.
- 4
Repair is planned
Parts are reserved from inventory, the standby pump is confirmed ready and the repair is scheduled during low flow.
- 5
Results update the plan
Post-repair readings are logged as the new baseline and the lubrication interval is reviewed for similar pumps.
Getting pump data clean enough to trust
Predictive programs depend on consistent data. A few housekeeping practices make the difference between useful trends and noise.
- One asset ID everywhere: the pump named in SCADA, the maintenance system and the field tag should match so readings land on the right record.
- Consistent measurement points: always take vibration and temperature at the same locations and under similar load.
- Record operating context: note flow, speed and whether the pump was starting, running or stopping when a reading was taken.
- Calibrate and check instruments: a drifting sensor can look like a failing pump.
- Use standard failure codes: consistent cause and action codes make later analysis possible.
- Clean up history: merge duplicate assets and correct dates before trying to estimate failure patterns.
Using pump data to decide between repair and replacement
Condition history also helps with capital planning, not just day-to-day maintenance.
Who does what in a predictive pump program
Predictive maintenance crosses departments. Clear ownership keeps alerts from falling between operations, maintenance and engineering.
| Role | Main responsibility | Records they own |
|---|---|---|
| Plant or station operator | Daily rounds, noting unusual noise, leaks and alarms | Round sheets, operator notes, run status |
| Maintenance technician | Takes readings, performs repairs and records findings | Work orders, readings, parts used, cause codes |
| Maintenance planner | Reviews alerts, schedules work and reserves parts | Schedules, backlog and preventive plans |
| Reliability or process engineer | Sets thresholds, analyzes failures and recommends changes | Baselines, threshold settings and failure analysis |
| SCADA or instrumentation staff | Maintains sensors, tags and data connections | Instrument calibration and tag lists |
| Utility manager | Sets priorities, approves budgets and reviews results | KPI reports and capital plans |
Justifying a predictive maintenance program to decision makers
Budget approval is easier when the benefits are tied to outcomes your board or council already cares about.
- Service reliability: fewer unplanned pump outages reduce the chance of overflows, pressure loss and customer complaints.
- Regulatory exposure: sewage overflows and quality exceedances carry compliance consequences, so avoiding them has real value.
- Emergency cost: after-hours callouts, rental pumps and rushed parts typically cost more than planned repairs.
- Asset life: catching problems early can prevent secondary damage to shafts, motors and casings.
- Energy use: trending efficiency helps identify worn pumps that draw more power than they should.
- Workforce planning: planned repairs make it easier to schedule crews and reduce overtime.
Start with your own history
- List the pump failures of the last few years and the cost and impact of each.
- Note which ones showed warning signs that nobody acted on.
- Use that list as the baseline for the pilot and the proof of progress.
How Oxmaint supports condition-based pump maintenance
Oxmaint maintenance management software provides the work management layer around your monitoring data.
- Asset management: store nameplate data, manuals, history and readings for each pump.
- Preventive maintenance: schedule lubrication, inspections and seal checks by run hours or calendar.
- Condition-based workflows: create inspections or work orders when readings pass defined limits.
- Mobile inspections: capture rounds, readings and photos at the station.
- Inventory: track spare seals, bearings and impellers so repairs are not delayed.
- Dashboards: follow downtime, backlog and repeat failures across stations.
Predictive maintenance for pumps: common questions
What is predictive maintenance for pumps?
It uses condition data and trends to estimate when a pump needs service, so repairs are planned before failure.
Which sensors matter most?
Vibration, temperature, motor current, flow and pressure cover the most common failure modes for municipal pumps.
Do we need new sensors to start?
Not always. Existing SCADA data and handheld routes help. You can book a demo to plan a pilot.
How are thresholds chosen?
Combine manufacturer limits, standards and each pump's baseline, then refine after real events.
How does a CMMS help?
It turns alerts into assigned work orders. You can start with Oxmaint to set this up.
Give every critical pump a baseline, a threshold and a response
Start a pilot on your highest-risk stations and connect condition data to preventive and corrective work.