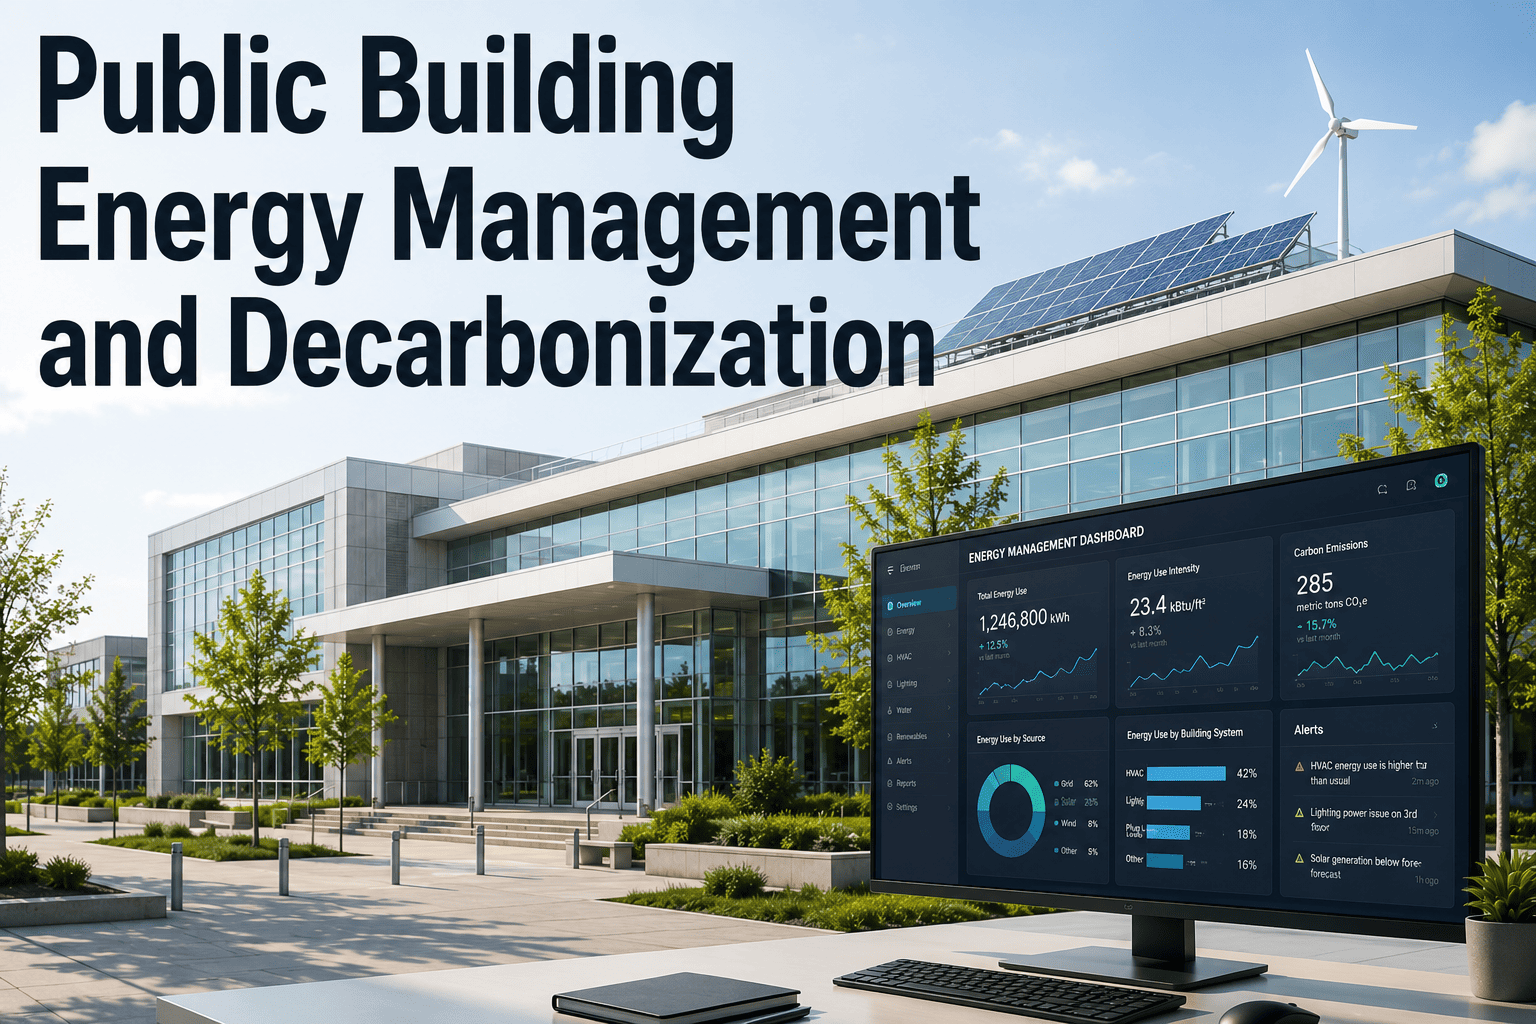
Public buildings quietly account for a large share of municipal emissions and operating cost — often 40–60% of a city government's energy bill and a comparable slice of its carbon footprint. With Executive Order 14057, state climate action plans, and local net-zero ordinances now codifying decarbonization deadlines, the question is no longer whether to act, but how to translate commitments into funded, documented progress across hundreds of facilities. The path that consistently works is efficiency-first, electrification-second, renewables-third, all anchored by a CMMS that gives portfolio managers real visibility into asset condition, energy use, and project payback. Start Free Trial to see how OxMaint turns building-level data into portfolio-wide decarbonization plans.
Can your municipal portfolio hit net-zero deadlines without a documented, asset-level plan?
Federal Executive Order 14057 and 400+ city climate plans now bind public agencies to cut building emissions 50% by 2032 and reach net-zero by 2050. Most portfolios are missing the energy data, asset records, and project tracking to prove compliance — or to compete for the $50B+ in federal clean-energy grants now open.
Why portfolios stall without energy visibility
A typical mid-sized city operates 80–300 public buildings — libraries, fire stations, city halls, recreation centers, schools — generating $4M–$18M in annual energy spend and 15,000–60,000 metric tons of CO₂e. Without a CMMS tied to meter and asset data, three failures compound quietly until a climate-plan audit exposes them.
A 120-building municipal portfolio loses an average of 20–30% of energy spend to undetected HVAC faults, simultaneous heating/cooling, and skipped filter changes that no work-order system currently flags.
Public buildings emit 38% more CO₂e per square foot than ASHRAE 90.1 benchmarks when retro-commissioning is deferred past a 5-year cycle — the single largest controllable contributor to portfolio footprint.
Most municipal climate plans mandate 50% emissions reduction by 2030–2032. A full efficiency-plus-electrification retrofit cycle takes 4–6 years end-to-end — leaving little margin for delay.
The four streams that fund decarbonization
Pursuing electrification before efficiency is the most expensive mistake in public-sector decarbonization: oversized heat pumps, larger electrical service, and inflated renewable capacity all price the project out of a grant cycle. The proven sequence runs in four funded streams.
Audit, benchmark, and retro-commission
ENERGY STAR Portfolio Manager benchmarking for every building over 25,000 sq ft (required by 40+ local ordinances), followed by ASHRAE Level 2 audits on the top 20% of energy consumers. Retro-commissioning alone typically yields 8–15% energy savings with a 1.5-year payback — no capital project required.
Deep efficiency retrofits on the worst offenders
LED with networked controls, VFDs on pumps and fans, envelope air-sealing, and BMS upgrades targeting the 30% of buildings responsible for 70% of emissions. These projects — averaging 20–35% kBtu/sq-ft reduction — are the "negawatts" that right-size everything downstream and qualify for utility incentives covering 25–50% of cost.
Electrify heating and domestic hot water
After the load shrinks, replace fossil-fuel boilers with cold-climate air-source heat pumps, ground-source loops where site allows, and heat-pump water heaters. A right-sized electrification package on a tightened envelope typically lands at $18–$32 per square foot — 40% less than electrifying an unoptimized building.
On-site renewables and storage
Rooftop and canopy solar sized to the post-retrofit load, paired with battery storage where demand-charge savings or resilience (critical facilities, shelters) justify it. Power-purchase agreements and the federal direct-pay provision of the Inflation Reduction Act can fund 40–70% of installed cost for tax-exempt public entities.
What a 120-building portfolio actually saves
Below is a worked scenario for a mid-sized municipal portfolio of 120 buildings totaling 2.4 million sq ft, spending $4.8M/yr on energy and emitting 28,000 metric tons CO₂e. Numbers reflect typical results when the four-stream sequence is executed with CMMS-tracked project data.
28% kBtu reduction is the median outcome across 40+ municipal retrofits tracked to ASHRAE Level 2 scope, before electrification.
65% total reduction — clears the 2032 milestone with margin. Net-zero reached by 2045 with continued grid decarbonization and on-site solar.
| Decarbonization measure | Capital cost | Annual savings | tCO₂e avoided | Payback |
|---|---|---|---|---|
| Retro-commissioning + BMS tuning | $340K | $410K | 2,400 | 0.8 yr |
| LED + networked controls (full portfolio) | $1.1M | $520K | 3,100 | 2.1 yr |
| HVAC upgrades (VFDs, chillers, RTUs) | $3.8M | $680K | 4,200 | 5.6 yr |
| Boiler electrification — heat pumps | $6.4M | $310K | 6,800 | 10.2 yr* |
| Rooftop solar (4.2 MW DC) | $7.9M | $640K | 2,900 | 8.1 yr** |
| Portfolio total | $19.5M | $2.56M | 19,400 | 5.4 yr |
* Before federal direct-pay and utility incentives, which typically reduce net cost 30–45%. ** Includes IRA direct-pay at face value; with accelerated depreciation the payback drops to ~6 years.
From commitments to documented, audit-ready progress
Climate plans and executive orders require proof, not promises. A CMMS purpose-built for public-facility portfolios becomes the system of record that connects every asset, work order, meter reading, and retrofit project to the emissions line in your annual climate report.
Asset-level energy intensity
Tag every asset — boiler, RTU, chiller, lighting circuit — to its meter and square footage. The CMMS calculates kBtu/sq-ft and kgCO₂e per asset automatically, so you can see which 20% of equipment drives 80% of emissions before you scope a retrofit.
Project tracking against climate milestones
Every retrofit project rolls up to the portfolio's 2030 and 2050 targets. Dashboards show emissions reduced vs. planned, capital deployed vs. budgeted, and buildings on-track vs. at-risk — the exact view auditors and city councils request.
Grant documentation on autopilot
Federal grants (IRA direct-pay, EPA GGRF, DOE Renew America's Schools) and state programs require measurement-and-verification reports tying spend to kWh and tCO₂e. The CMMS auto-generates M&V reports from the same work orders your team already logs.
Deferred-maintenance backlog, prioritized
A 120-building portfolio typically carries $8M–$15M in deferred maintenance. The CMMS ranks backlog by energy impact and emissions — so the boiler replacement that cuts 400 tCO₂e/yr wins budget over the cosmetic lobby renovation every time.
A 180-facility city portfolio, three years in
One West Coast municipality of 180 public facilities used OxMaint to sequence efficiency, electrification, and solar across a 3.2M sq-ft portfolio. The result after 36 months, tracked in the CMMS and verified against their climate action plan:
Benchmark + retro-commission
All 180 buildings benchmarked in ENERGY STAR Portfolio Manager. ASHRAE Level 2 audits on 36 highest-consuming facilities. Retro-commissioning delivered $620K in year-one savings with zero capital spend.
Deep retrofits + first electrification
LED + controls across 142 buildings, HVAC upgrades in 28. Three pilot boiler-to-heat-pump conversions at fire stations. Portfolio kBtu/sq-ft dropped 22%; emissions down 5,800 tCO₂e.
Scale electrification + solar PPAs
34 more boiler conversions, 3.8 MW of rooftop solar via PPA (zero upfront). Cumulative savings reached $2.1M/yr with emissions cut 34% from baseline — on track for the 2030 target.
"Before OxMaint we had 180 buildings and 180 spreadsheets. Now every work order, meter reading, and retrofit dollar rolls up to one emissions number we can hand to council — and to grant reviewers."
— Facilities Director, 180-building municipal portfolio
Stop tracking decarbonization in spreadsheets.
Connect every asset, work order, and meter to one audit-ready emissions ledger your city council and grant reviewers will actually trust.
Public building decarbonization, answered
What does Executive Order 14057 require of public building portfolios?
EO 14057 directs federal agencies to cut Scope 1 and 2 emissions 50% by 2032 and reach net-zero by 2050, with net-zero buildings defined as those producing no on-site emissions and offsetting all grid electricity. State and municipal climate plans increasingly mirror these targets. Compliance requires documented, year-over-year reductions — not just a pledge — which is why a CMMS tied to meter and asset data is now essential for audit readiness.
Should we electrify before or after efficiency retrofits?
Always after. Efficiency-first shrinks the heating load 20–35%, which lets you specify smaller, cheaper heat pumps, avoid electrical-service upgrades, and reduce solar capacity. Electrifying an unoptimized building typically inflates project cost by 40% or more and extends payback past 12 years. The four-stream sequence — audit, efficiency, electrification, renewables — is the consistently funded path.
How does a CMMS help win federal clean-energy grants?
Programs like EPA's Greenhouse Gas Reduction Fund, DOE Renew America's Schools, and IRA direct-pay all require measurement-and-verification reports tying capital spend to verified kWh and tCO₂e reductions. A CMMS like OxMaint auto-generates those reports from work orders and meter data you already log, so grant applications and post-award reporting take hours instead of weeks. Book a Demo to see the grant-reporting workflow.
What payback period should we expect across a full portfolio retrofit?
A blended portfolio typically lands at 5–7 year simple payback when sequenced correctly. Retro-commissioning pays back in under a year, LED in 2–3 years, and HVAC upgrades in 5–6 years. Electrification and solar extend the blend to 6–8 years before incentives, but IRA direct-pay, utility rebates, and accelerated depreciation routinely bring net payback back to 4–5 years for tax-exempt public entities.
Can we manage this with our existing BMS or energy dashboard?
A building management system controls equipment in real time; an energy dashboard shows consumption trends. Neither tracks work orders, asset condition, retrofit projects, or emissions against climate milestones — the layer grant reviewers and auditors actually need. A CMMS sits above both, ingesting their data and connecting it to maintenance, capital planning, and compliance reporting in one system. Start Free Trial to connect your BMS in under a week.
Turn your climate plan into documented progress.
Join public-facility teams using OxMaint to manage energy, track emissions, and prove decarbonization progress across every building in the portfolio.
Free 14-day trial · No credit card