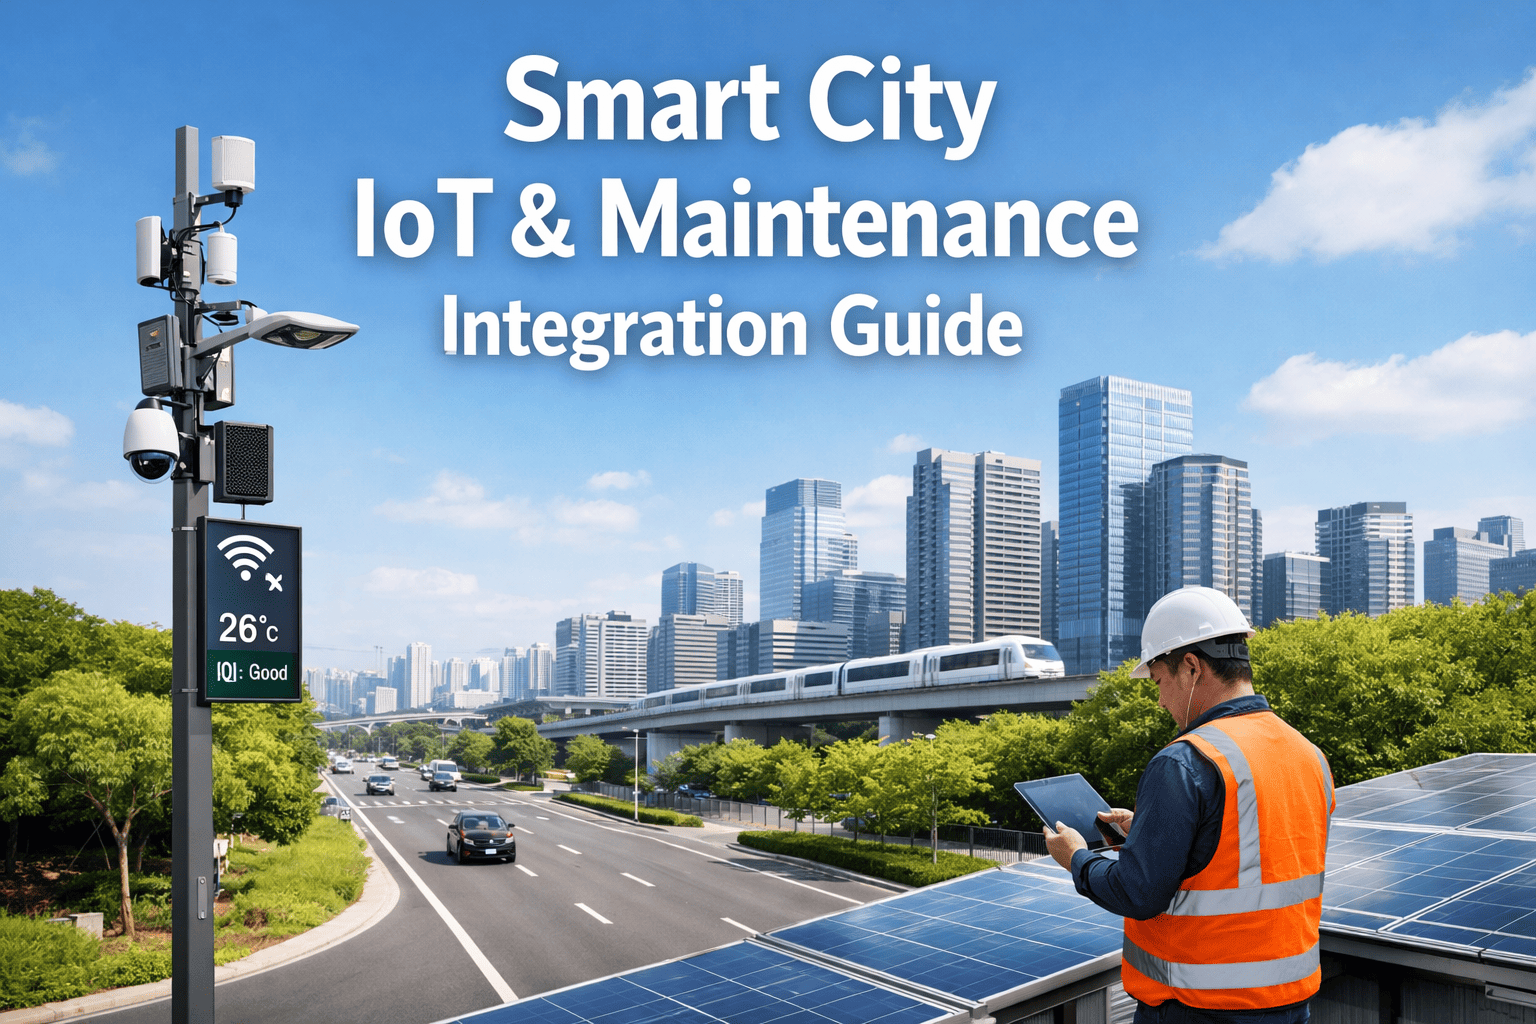
The alert triggers on the Public Works dashboard at 3:14 AM on a Tuesday. A vibration sensor on the main lift station pump has detected an anomaly—a specific frequency shift indicating a bearing is about to fail. Instead of a catastrophic sewage backup occurring during the morning rush hour, a work order is automatically generated. The maintenance crew replaces the part by 7:00 AM. No service interruption. No emergency overtime. Welcome to the era of Real-Time Infrastructure Diagnostics.
Municipalities manage complex, aging infrastructure networks—from water treatment plants and bridges to streetlights and HVAC systems. Traditionally, these assets are maintained on rigid schedules or, worse, fixed only after they break. This reactive approach bleeds budgets and endangers public safety. The shift to the Internet of Things (IoT) changes the game: providing live monitoring and predictive alerts.
This guide examines how smart cities are utilizing remote diagnostics integrated with CMMS platforms to transform infrastructure management. Municipalities implementing these strategies report a 40% reduction in unexpected breakdowns and a 25% extension in asset lifecycle. Ready to modernize your city's grid? Start your free trial with Oxmaint CMMS.
What if your infrastructure could tell you it needs repair before it breaks?
Real-Time Infrastructure Diagnostics: Municipal IoT Guide
From Reactive Repair to Predictive Intelligence
Smart infrastructure isn't just about collecting data; it's about actionable insights. When municipal assets are connected via IoT sensors, performance analytics flow directly into your maintenance software, creating a proactive ecosystem that solves problems before citizens even notice them.
IoT sensors continuously measure critical variables (vibration, temperature, flow rate, voltage) on key infrastructure assets 24/7.
Edge computing algorithms analyze the data stream, instantly flagging deviations from the "normal" operating baseline.
The system triggers an alert to the CMMS, automatically creating a high-priority work order with diagnostic codes attached.
Technicians arrive on-site with the correct parts and data history, resolving the issue before a service failure occurs.
| Operational Factor | Traditional Approach | IoT/Smart Approach | Outcome |
|---|---|---|---|
| Maintenance Trigger | Asset Failure or Calendar | Real-time Condition Data | Zero downtime |
| Inspection Method | Manual "Clipboards" | Remote Sensors | 90% less labor cost |
| Response Time | Hours or Days (Post-failure) | Immediate (Pre-failure) | Higher public safety |
| Budgeting | Unpredictable Emergency Funds | Planned Capital Expenditure | Fiscal stability |
| Asset Lifespan | Shortened by catastrophic failures | Maximized via optimal care | Delayed replacement costs |
Key Layers of Municipal IoT Stack
Building a smart city requires a holistic view of the technology stack. It is not just about the hardware; it's about connectivity and the software that translates noise into clear maintenance directives.
Vibration monitors on pumps, tilt sensors on telephone poles, and ultrasonic leak detectors on water pipes. These devices are the nervous system of the city.
Low-power, wide-area networks (like LoRaWAN or 5G) transmit small packets of data over long distances without draining sensor batteries.
Software that ingests raw data, visualizes trends, and integrates with maintenance platforms to dispatch crews automatically.
Deploying Diagnostics Across Asset Classes
Proactive infrastructure management applies to almost every department in a municipality. Integrating these disparate systems into a single dashboard provides a "Single Pane of Glass" for city management.
| Asset Class | Diagnostic Metric | Predictive Insight | Benefit |
|---|---|---|---|
| Water Utilities | Acoustic/Flow monitoring | Detects micro-leaks before pipe burst | Prevents water loss & damage |
| Bridges | Strain gauges & tilt sensors | Identifies structural stress loads | Ensures commuter safety |
| Streetlights | Current & voltage usage | Predicts bulb/driver failure | Reduces energy waste |
| Waste Bins | Fill-level sensors | Predicts optimal pickup time | Optimizes truck routing |
| Public Buildings | Air quality & HVAC performance | Filter status & motor health | Healthy indoor environments |
| Stormwater | Water level sensors | Predicts overflow risk | Mitigates flood liability |
Case Study: Smart City Transformation
A mid-sized municipality with aging water infrastructure faced increasing pipe bursts and energy costs. By implementing Oxmaint integrated with IoT flow sensors, they revolutionized their utility management.
- Reliance on citizen phone calls to report leaks
- Reactive repairs led to road closures
- High energy bills from inefficient pumps
- Manual daily rounds to check gauges
- Inaccurate data for capital planning
- Frequent overtime for emergency crews
- Leaks detected 2 weeks before surfacing
- 35% reduction in non-revenue water loss
- Energy consumption dropped by 18%
- Staff reallocated to preventative tasks
- Data-driven budget requests approved
- Asset uptime increased to 99.8%
Data Flow & Integration Architecture
The power of diagnostics lies in the integration. A sensor beeping in a void is useless. The data must travel securely from the edge to the cloud, be processed by analytics, and result in a tangible work order for a human to execute.
IoT device reads physical data (temp, vibration) at the asset source
Gateway aggregates data and sends it securely via cellular/LoRaWAN to cloud
Platform checks data against thresholds (e.g., "If Temp > 80°C")
Oxmaint generates Work Order #1024 assigned to the electrical team
Sensors automatically log regulatory data (e.g., water turbidity), removing human error from compliance reporting.
Real-time monitoring identifies "energy vampires" and inefficient cycles, allowing for immediate optimization.
Diagnostic codes can automatically reserve the required spare parts in the warehouse before the technician leaves.
Every data point and resulting action is timestamped, providing an irrefutable record of infrastructure management.
Don't wait for a critical failure to modernize your maintenance.
Implementation: Strategies for IoT Adoption
Transitioning to a smart city model doesn't happen overnight. It requires a phased approach, starting with the most critical assets to prove ROI before scaling.
- Identify top 10 critical assets with high failure history
- Install non-invasive sensors (vibration/temperature)
- Establish baseline performance data ("What is normal?")
- Configure alert thresholds to avoid "notification fatigue"
- Connect sensor API outputs to Oxmaint Work Order system
- Map diagnostic codes to specific "Task Lists" for crews
- Train staff on responding to sensor-generated orders
- Test end-to-end response times
- Deploy LoRaWAN gateways to cover wider municipal zones
- Expand sensor deployment to secondary asset classes (Lighting/Parks)
- Implement predictive analytics for long-term trending
- Integrate mobile app for field technicians
- Use historical data to refine predictive algorithms
- Shift procurement strategy based on asset lifecycle data
- Automate energy load balancing
- Publish "Smart City" transparency dashboards for public
Prioritizing Assets for Diagnostics
Not every asset needs a sensor. Use this matrix to determine where real-time diagnostics provide the highest value versus cost.
| Priority Level | Asset Types | Risk Exposure | Diagnostic Need |
|---|---|---|---|
| Critical (P1) | Lift Stations, Substations, Bridges | Catastrophic failure; public health risk. | Continuous multi-variable monitoring |
| High (P2) | HVAC Chillers, Traffic Signals | High operational cost; service disruption. | Performance & energy tracking |
| Medium (P3) | Street Lighting, Irrigation | Quality of life impact; energy waste. | Usage-based monitoring |
| Low (P4) | Park Benches, Signage | Low impact; cosmetic issues. | Manual inspection (QR Codes) |
| Compliance | Water Quality, Air Monitors | Regulatory fines and legal mandates. | Strict data logging & reporting |
Best Practices for Remote Diagnostics
To ensure your digital infrastructure yields accurate data and defensible records, follow these technical best practices.
Ensure end-to-end encryption from the sensor to the cloud. Municipal infrastructure is a prime target for cyber threats.
Choose open-protocol devices (like MQTT) that can communicate with any CMMS, avoiding vendor lock-in for hardware.
Start with loose alert parameters and tighten them over time. Too many false alarms will cause crews to ignore the system.
Ensure alerts include context. "Pump 4 Vibration High" is good; "Pump 4 Vibration High - Possible Impeller Damage" is better.
For remote assets, monitor sensor battery life as a metric itself to prevent diagnostic blackouts.
Technicians should validate the diagnostic alert after the repair ("Was the sensor right?"), helping to train the AI model.
The Financial Impact of Predictive IoT
Investing in diagnostics hardware and software pays dividends by shifting spending from "emergency repairs" to "planned maintenance."
Expert Review
- Start small: Instrument one lift station or one park before doing the whole city
- Involve the field crews in the software selection; if they don't use it, the data dies
- Ensure your network provider has robust coverage in basements and remote areas
- Celebrate the "silence"—the emergencies that didn't happen because of a sensor
Conclusion
Municipal infrastructure management is at a crossroads. Aging assets and tightening budgets make the traditional "run-to-failure" model unsustainable. Real-time infrastructure diagnostics offer a proven path forward. By giving your assets a voice through IoT sensors, you gain the ability to listen, predict, and act before disaster strikes.
Integrating these insights into a digital workflow like Oxmaint ensures that data leads to action. You protect the taxpayer investment, ensure public safety, and streamline operations. The technology is ready. The question is, is your city ready to listen?
Don't wait for the next breakdown to upgrade your strategy. Secure your infrastructure's future today.