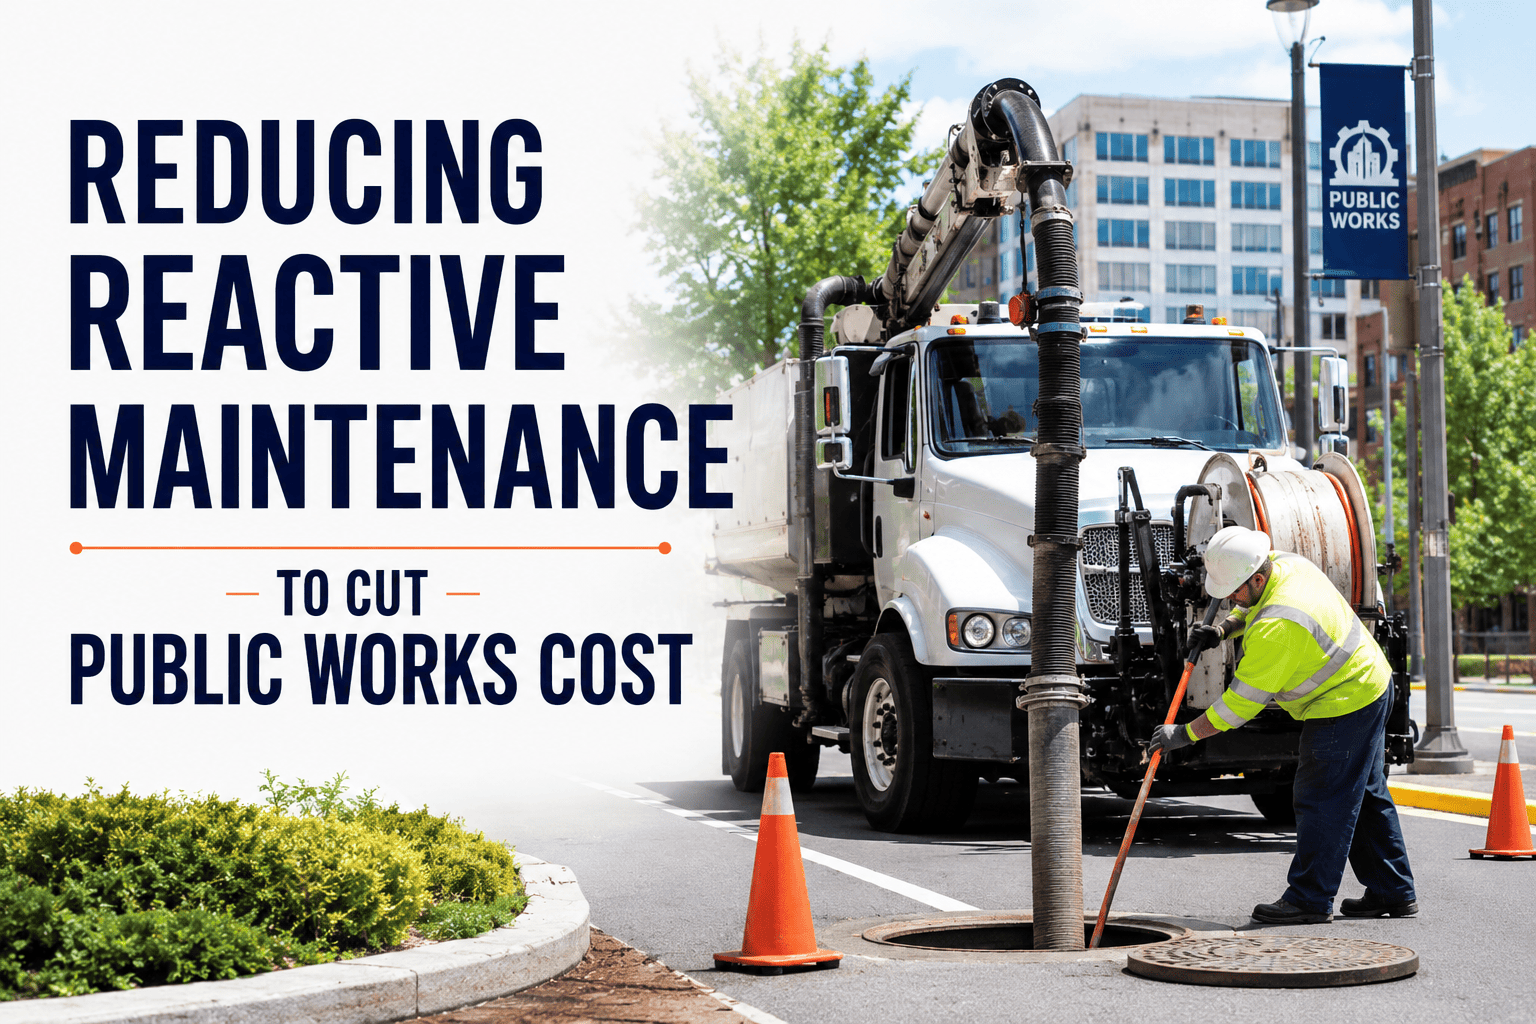
Reactive maintenance in public works typically costs 3–5 times more than planned maintenance, consuming an estimated 38% of municipal maintenance budgets through emergency callouts, overtime, and premature asset replacement. Agencies that systematically reduce reactive maintenance and shift toward planned, preventive workflows consistently recover real budget dollars while improving service reliability. This guide breaks down the cost math, the preventive maintenance investment strategy, and the CMMS-driven transformation that moves public works operations from reactive firefighting to planned-work-dominant success — and you can Start Free Trial to see the platform in action today.
Every reactive repair costs your agency 3–5× more than planned work.
When 38% of municipal maintenance spend flows to emergency breakdowns, overtime, and expedited parts, budgets collapse. Shifting public works from reactive to planned maintenance recovers dollars, extends asset life, and restores service reliability — here is the blueprint.
Why reactive maintenance costs government agencies 3–5× more
The cost gap between reactive and planned maintenance is not theoretical — it is driven by compounding operational penalties that hit public works budgets on every emergency repair.
Labor Overtime & After-Hours
Emergency callouts trigger 1.5×–2× overtime rates. A pump failure at 11 PM costs double the labor of the same repair scheduled at 9 AM — and pulls crew from scheduled route work.
Expedited Parts & Freight
Reactive repairs need parts now, not in 5 business days. Overnight freight, premium sourcing, and single-bid emergency purchases inflate parts costs 20–40% over stocked or planned procurement.
Collateral Asset Damage
A bearing that fails under load takes the shaft, seals, and housing with it. Planned replacement of a $120 bearing prevents $3,400 in cascading damage — a 28× cost avoidance.
Downtime & Service Disruption
A downed lift station, a broken water main, or a failed traffic signal disrupts public service and generates complaint volume, regulatory risk, and reputational damage that no line item captures.
Planned vs. reactive maintenance in public works: the savings math
A mid-sized municipal public works department maintaining 450 assets — fleet vehicles, pumps, generators, HVAC units, and traffic systems — spends an average of $612K/year on maintenance. When 65% of work is reactive, the premium is enormous.
How to measure and track your reactive-to-planned maintenance ratio
You cannot reduce what you do not measure. The reactive maintenance ratio is the single most important KPI for public works teams shifting to planned operations — and it is the baseline OxMaint tracks automatically.
World-class public works operations target an RMR below 20%. Most agencies start at 55–70%.
| Maintenance Maturity | RMR Range | Typical Public Works Profile | Cost Impact |
|---|---|---|---|
| Reactive (Firefighting) | 65–80% | Spreadsheet or paper-based; no PM schedule | Baseline (highest cost) |
| Transitional | 40–55% | Basic CMMS; inconsistent PM compliance | 15–25% savings |
| Planned-Dominant | 20–35% | CMMS-driven PMs; asset tracking active | 30–45% savings |
| Optimized / Predictive | Below 15% | Predictive analytics; condition-based triggers | 40–55% savings |
How OxMaint shifts public works from reactive to planned maintenance
OxMaint is an AI-powered CMMS and EAM platform purpose-built for maintenance and reliability teams. For public works agencies, it replaces spreadsheets, paper work orders, and tribal knowledge with a planned-work engine that drives down reactive maintenance cost.
Automated PM Scheduling
OxMaint auto-generates preventive work orders based on meter readings, calendar intervals, or condition triggers — ensuring PM compliance above 90% and cutting unplanned breakdowns 30–50%.
Outcome: RMR drops from 65% to under 25%Predictive Failure Alerts
AI-driven analytics on vibration, temperature, and runtime data predict asset failures 7–21 days before they occur — converting emergency repairs into scheduled interventions at 1/4 the cost.
Outcome: 40–60% fewer emergency calloutsAsset & Inventory Tracking
Full asset lifecycle visibility with spare-parts min/max automation ensures the right parts are stocked — eliminating the expedited freight premium that inflates reactive repair costs 20–40%.
Outcome: Parts spend reduced 18–30%Maintenance Analytics & KPIs
Real-time dashboards track RMR, MTBF, MTTR, PM compliance, and cost-per-asset — giving public works directors the data to justify budgets, prove savings, and stay audit-ready.
Outcome: Full visibility for compliance & ROIStop paying the 3–5× reactive premium on every breakdown.
See how OxMaint automates preventive scheduling, predicts failures, and tracks every asset — so your agency hits 80% planned work. Book a 30-minute demo on your assets today.
Timeline: from reactive firefighting to 80% planned work in 90 days
A structured CMMS rollout moves public works agencies from reactive chaos to planned-work dominance in one quarter. Here is the typical implementation timeline with OxMaint.
Asset register & data migration
Import all assets, equipment hierarchies, and maintenance history into OxMaint. Replace spreadsheets and paper with digital work orders. Establish baseline RMR and cost-per-asset.
Preventive schedules go live
Build and activate PM schedules for critical assets — oil changes, filter replacements, inspections, calibrations. Technicians receive automated work orders on mobile devices. PM compliance climbs to 85%+.
Predictive triggers & analytics
Activate condition-based monitoring on high-value assets. Dashboards reveal RMR trending toward 25%. Directors see cost-per-asset dropping. Inventory min/max automation eliminates stockouts.
Reactive maintenance in public works: common questions
What is reactive maintenance in public works?
Reactive maintenance is repair work performed only after an asset has failed or broken down — a pump stops, a generator won't start, a vehicle breaks down on route. In public works, it typically costs 3–5× more than planned maintenance because of overtime labor, expedited parts, collateral damage, and service disruption. Agencies with high reactive ratios (above 50%) consistently overspend their maintenance budgets.
How much can a municipality save by reducing reactive maintenance?
A public works agency spending $600K annually on maintenance at a 65% reactive ratio can save $200K–$250K per year by shifting to 80% planned work. Savings come from eliminated overtime premiums, bulk parts procurement, prevented collateral damage, and reduced downtime. Most agencies see 9–14 month payback on their CMMS investment. Book a demo to see the math on your asset base.
What is a good reactive-to-planned maintenance ratio for government agencies?
Industry benchmarks target a reactive maintenance ratio below 20% for world-class operations. Most public works agencies start at 55–70% reactive. Reaching 35% reactive (65% planned) within 6 months of CMMS implementation is realistic; hitting 20% reactive within 12–18 months with predictive maintenance is achievable for committed teams.
How does a CMMS reduce reactive maintenance in municipal operations?
A CMMS like OxMaint reduces reactive maintenance by automating preventive work order generation based on calendar or meter triggers, tracking asset condition data for predictive alerts, maintaining spare-parts inventory at min/max levels to prevent stockouts, and giving directors real-time KPI dashboards. This combination pushes PM compliance above 90% and cuts unplanned breakdowns 30–50%.
How long does it take to switch from spreadsheets to a CMMS for public works?
With OxMaint, most public works agencies complete asset data migration, PM schedule build-out, and team onboarding within 30–60 days. The platform is designed for easy switching from spreadsheets and paper — technicians use a mobile app with no learning curve, and directors see dashboards on day one. You can Start Free Trial and begin importing assets immediately.
Shift your public works agency to 80% planned maintenance.
Join the agencies cutting maintenance costs 30–45% with OxMaint — AI-powered preventive scheduling, predictive failure alerts, and full asset tracking in one platform.
Free 14-day trial · No credit card