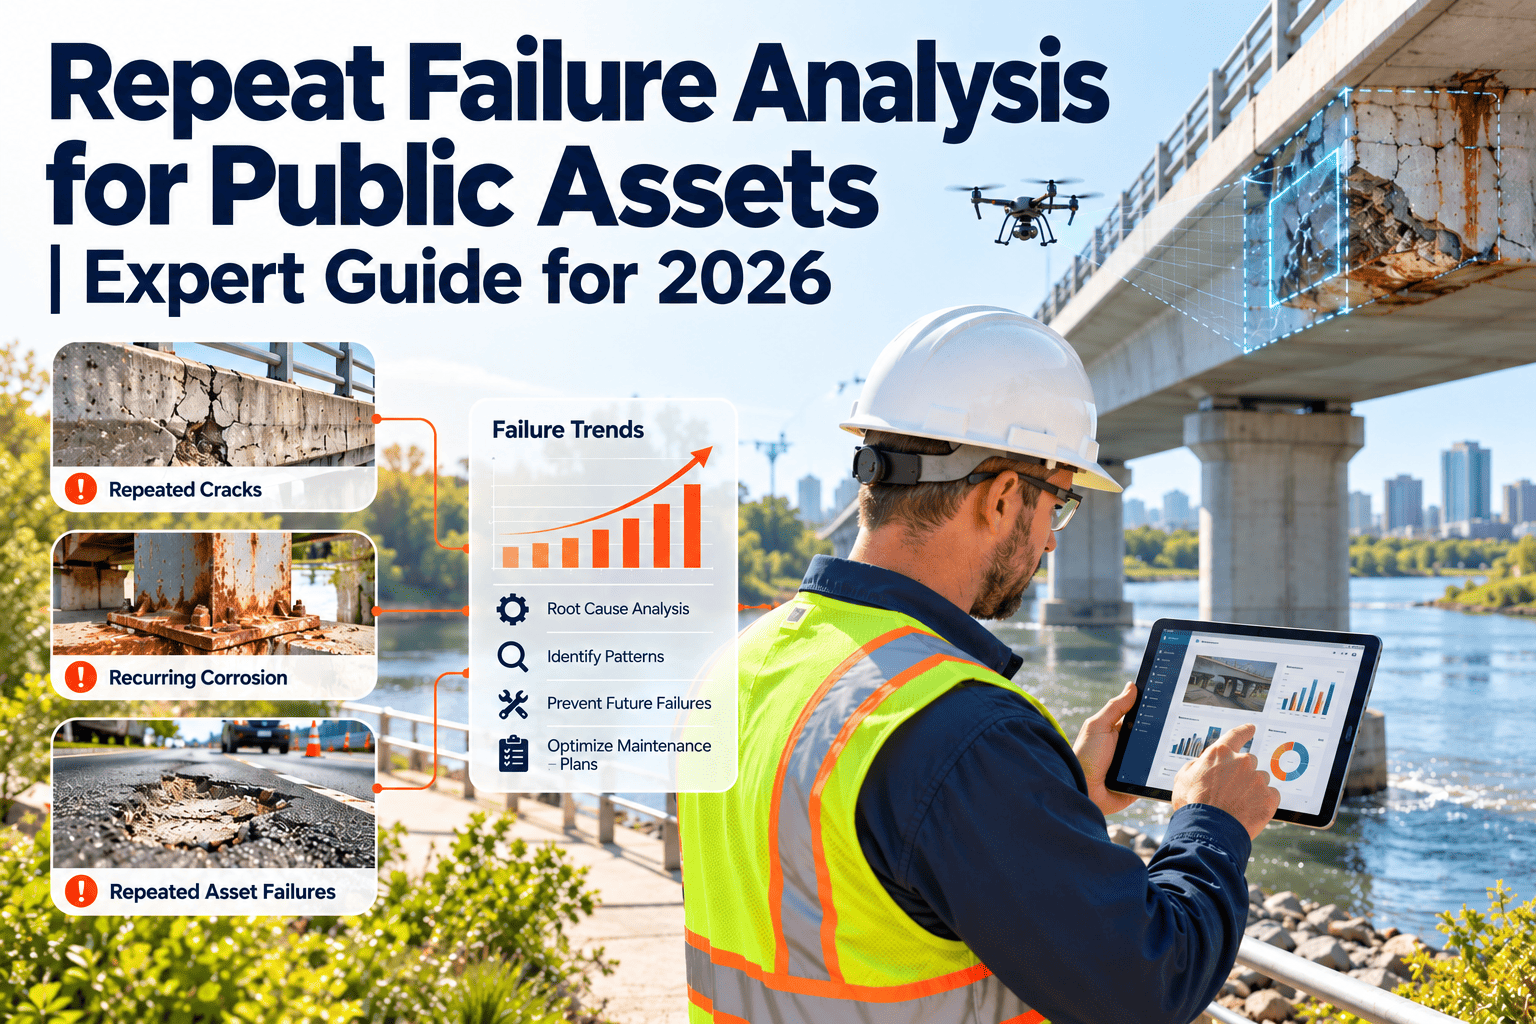
A pothole filled three times at the same intersection, a lift station pump that trips every spring, a boiler that gets a new part each winter. Public works crews close these work orders every time, and the reports show completed work, yet the fault keeps coming back. Repeat failures consume labor and budget without improving service, and they rarely show up as a line item. This guide explains how to find them in your maintenance records, run a proper root cause analysis and fund the permanent fix, using history held in a CMMS such as Oxmaint.
Repeat Failure Analysis for Public Assets
Stop paying for the same repair twice. Use work order history to spot recurring faults, find the cause behind them and replace the patch cycle with a fix that lasts.
What counts as a repeat failure
A working definition
- The same asset fails with the same failure mode within a set review window.
- The earlier work order was closed as complete, so the fix did not hold.
- The window is set by you: shorter for pumps and signals, longer for pavement and roofs.
Why the definition matters
- Without a fixed rule, each supervisor decides what looks like a repeat.
- A shared rule makes the repeat rate comparable across departments.
- It lets you separate normal wear from a problem that has not been solved.
| Repeat pattern | Example | What it usually points to |
|---|---|---|
| Same asset, same fault | A pump seal replaced several times in one season | Misalignment, wrong part or an operating condition nobody has checked |
| Same location, different assets | Repeated pavement repairs at one low point | Drainage or subgrade problem outside the repaired layer |
| Same component type across sites | One model of controller failing in several cabinets | Product, installation or environmental weakness |
| Same technician fix, different outcome | Repairs that hold for one crew but not another | Unwritten procedure or training gap |
What recurring repairs really cost
Why repeats stay invisible in the records
Most repeat failures are not hidden on purpose. They are hidden by how the work was recorded. Compare typical entries with entries that make repeats searchable.
Entries that hide repeats
- Asset recorded as a street name or building only
- Free-text such as "fixed it" or "cleared"
- A different failure description each time
- Parts used not recorded
- Cause left blank at closure
Entries that expose repeats
- Every work order linked to a specific asset ID
- Standard problem, cause and remedy codes
- Findings and photos attached at closure
- Parts, hours and cost recorded per job
- A required cause field before closing corrective work
Find repeats in six moves
Pull corrective history
Export closed corrective work orders for the last twelve to twenty-four months, with asset, date, code, hours and cost.
Group by asset and failure code
Sort so that any asset with more than one entry for the same code rises to the top.
Apply your repeat window
Mark entries that recur within the agreed window and count them per asset.
Total the cost of each repeat group
Add labor, parts, contractor and overtime so the group has a dollar value.
Rank and select
Choose the groups with the highest cost, highest safety exposure or widest service impact.
Open a root cause review
Create a dedicated work order or investigation record so the analysis is tracked, not just discussed.
Where the repeats usually cluster
Repeat failures follow a Pareto pattern in most organizations: a small share of assets generates a large share of returns. The bars show the shape to look for, not real data.
Pick the right root cause method
| Method | Best for | Watch out for |
|---|---|---|
| 5 Whys | Single-cause faults with a clear chain, such as a recurring blockage | Stopping at the first answer that blames a person |
| Cause and effect diagram | Faults with several possible causes across people, method, material, machine and environment | Listing causes without testing them |
| Pareto analysis | Deciding which repeat groups deserve analysis first | Relying on poor failure codes |
| Fault tree analysis | Critical systems where several events must combine to cause failure | Time cost; reserve for high consequence assets |
A 5 Whys example on a repeated road repair
Repair again, redesign or replace
Repair again
Fits when the cause is understood, the fix is cheap and the asset has plenty of life left. Add a preventive task so it does not recur.
Redesign the fix
Fits when the cause sits in the surroundings, such as drainage, loading, alignment or the operating setup. Replacing the part alone will fail again.
Replace the asset
Fits when repeat cost, downtime or safety exposure outweighs the remaining life. Use the repeat history as evidence in the capital request.
Give every repeat failure a traceable history
Oxmaint links work orders to assets, failure codes, parts and costs, so recurring repairs can be found and ranked without manual spreadsheet work.
Metrics that show whether repeats are falling
| Metric | How to calculate | What to do with it |
|---|---|---|
| Repeat failure rate | Repeat corrective work orders divided by all corrective work orders for the same asset class | Track monthly and compare departments |
| Time between failures | Average days between the same failure code on the same asset | A shrinking gap means the fix is wearing out faster |
| Cost of repeats | Total cost of work orders flagged as repeats | Use as the savings case for permanent fixes |
| Root cause completion | Repeat groups with a completed analysis divided by groups flagged | Shows whether review is actually happening |
| Permanent fix closure | Corrective actions completed and verified, divided by actions opened | Exposes analyses that never lead to work |
How the CMMS workflow supports the analysis
Data habits that make this work
- Require an asset on every corrective work order.
- Use a short, controlled list of failure codes.
- Close work on the day it finishes, with cause and remedy filled in.
- Review flagged repeats at a regular monthly meeting.
Making the case for the permanent fix
Typical repeat patterns by department
| Department | Common repeat | Questions to ask |
|---|---|---|
| Streets and roads | Potholes and edge failures returning at the same locations | Is there standing water, a utility cut or a weak base under the patch? |
| Water and sewer | Repeated main breaks on one segment, recurring sewer blockages | Is it pipe age, soil, pressure changes, roots or a grease source upstream? |
| Facilities | Roof leaks, HVAC trips, door hardware and lighting failures | Is the cause the part, the installation or the room conditions around it? |
| Fleet | Brake, hydraulic and electrical faults on the same unit or model | Is the repair quality, the duty cycle or a model-wide weakness? |
| Parks and grounds | Irrigation breaks, damaged equipment and drainage problems | Is it vandalism, wear or a design issue at the location? |
| Traffic and signals | Detector, controller and cabinet faults at the same intersections | Is it power quality, moisture, or a component batch? |
Three families of root cause to test
Design and selection
The part, material or equipment is wrong for the duty. Examples include undersized pumps, coatings unsuited to the environment and components with a poor service record. Check specifications, supplier history and operating conditions.
Installation and repair quality
The right part was fitted poorly. Misalignment, wrong torque, poor compaction or skipped steps all create early failure. Check written procedures, training records and whether the same crew or contractor appears in repeats.
Operation and maintenance
The asset is run or maintained in a way that shortens its life. Missing preventive tasks, overloading and delayed cleaning are common. Check preventive schedules, compliance and operating logs.
Run a monthly repeat failure review
Present the flagged list
Show the assets that crossed the repeat threshold since the last meeting, with count, cost and last repair date.
Assign each item an owner
One person leads the analysis and reports back at the next meeting. Shared ownership usually means none.
Review open analyses
Check findings, proposed actions, cost and timing. Close the analysis only when an action is approved or consciously declined.
Check earlier fixes
Look at assets fixed in previous months and confirm whether the fault has stayed away.
Making the permanent fix stick
Signs a fix will not last
- The cause field says "worn" or "failed" with nothing more
- The same part is simply replaced again
- No preventive task was added or changed
- Nobody is assigned to check the result
- The change is not written into any procedure
Signs a fix is built to last
- The cause is documented with evidence and photos
- The correction addresses the cause, not only the symptom
- A preventive task or inspection is added or revised
- A follow-up date is set to verify the result
- The procedure, training or specification is updated
Standardize the fields that make repeats searchable
| Field | Good practice | Example of a weak entry |
|---|---|---|
| Asset | Pick from the asset list; never type a free-text name | "Pump at the station" |
| Problem code | A short controlled list of observed symptoms | "Not working" |
| Cause code | Required before a corrective order can be closed | Blank |
| Remedy code | States what was done: replaced, adjusted, cleaned, temporary repair | "Fixed" |
| Temporary flag | Marks a stopgap so a permanent order follows | Not recorded |
| Parts used | Part number and quantity from stock or purchase | "Seal kit" |
Keep the code list short
Twenty well-chosen codes used consistently beat two hundred that nobody remembers. Review the list every year and merge codes that technicians confuse. The goal is a list that crews will actually use at closure on a phone, in the field.
Where a CMMS helps most, and where people still decide
The software handles
- Storing every repair against the right asset
- Listing assets that match your repeat rule
- Totaling labor, parts and contractor cost for each group
- Reminding owners when analyses and actions are due
People still decide
- Whether a fault is truly the same as an earlier one
- What the real cause is, using field knowledge
- Whether to repair, redesign or replace
- How to fund and sequence the permanent fix
Frequently asked questions
What is repeat failure analysis?
It is the process of finding assets that fail with the same fault more than once, then investigating the cause so a permanent fix replaces the repeated patch.
How long should the repeat window be?
There is no universal value. Use a short window for fast-cycle assets such as pumps and a longer one for pavement or roofs, and test it against your own history.
Do we need perfect data to start?
No. Start with asset-linked work orders and a short list of failure codes. A CMMS improves the data as crews use it daily.
Which root cause method should we use first?
Use Pareto analysis to choose targets, then 5 Whys for simple faults. Move to cause and effect diagrams for faults with several possible causes.
Can Oxmaint show repeat failures automatically?
Oxmaint records work order history by asset, which supports repeat reviews and dashboards. You can book a demo to see it on your own asset types.
End the patch cycle on your worst assets
Flag the repeats, find the cause and fund the fix that lasts. Oxmaint gives public works teams the asset history to prove it.