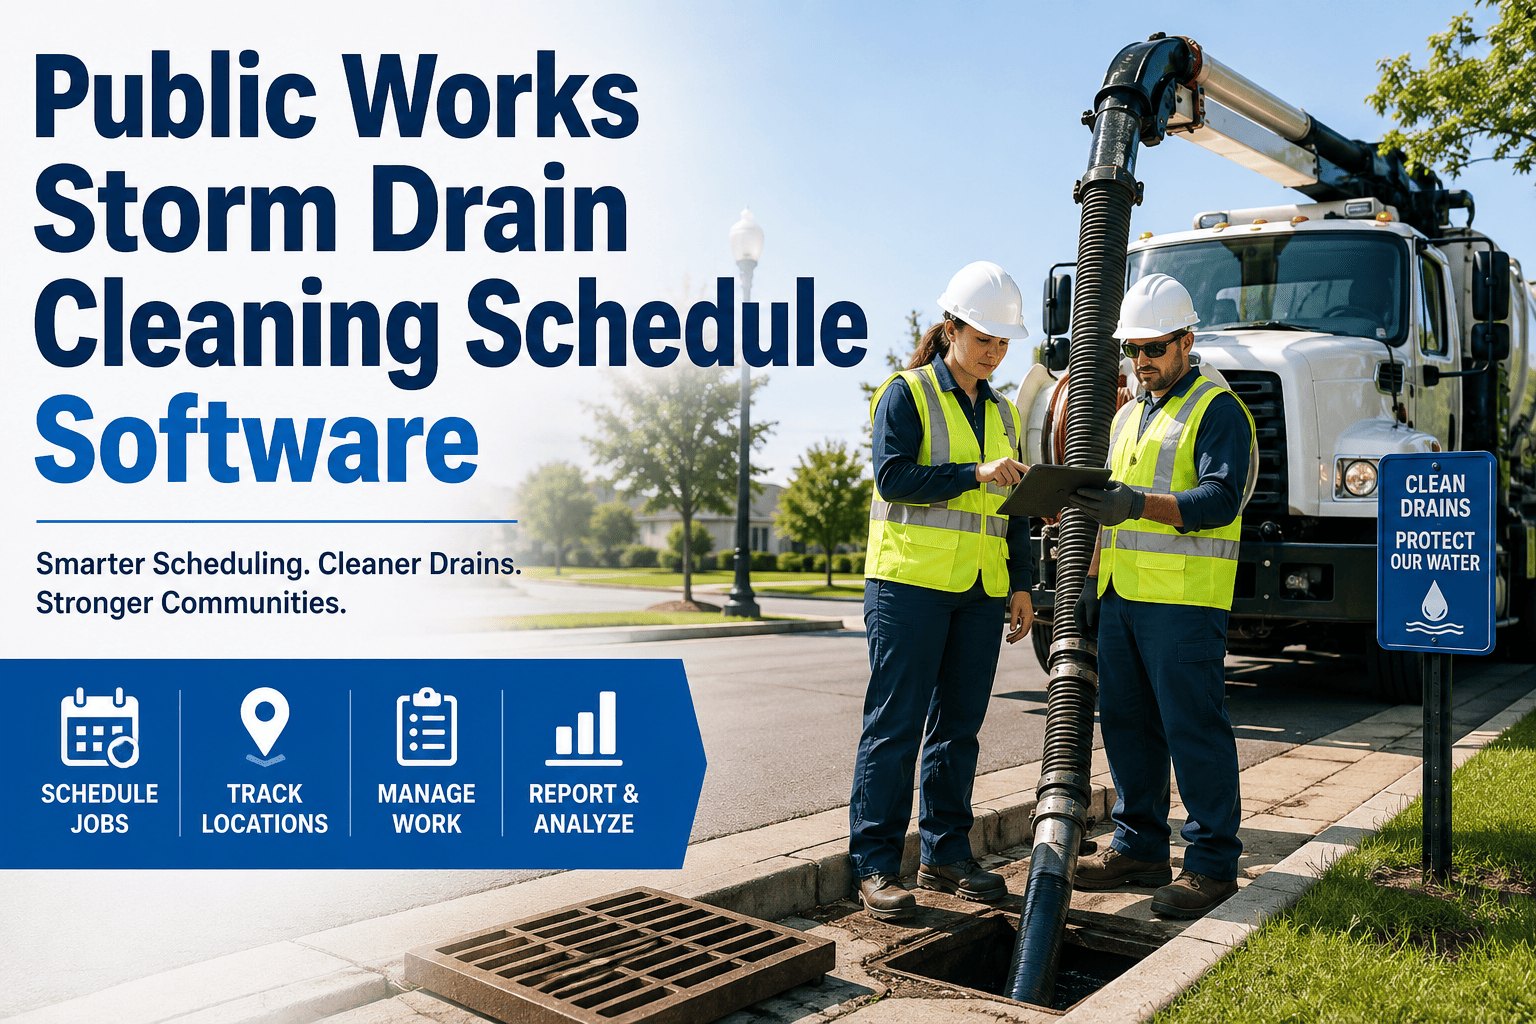
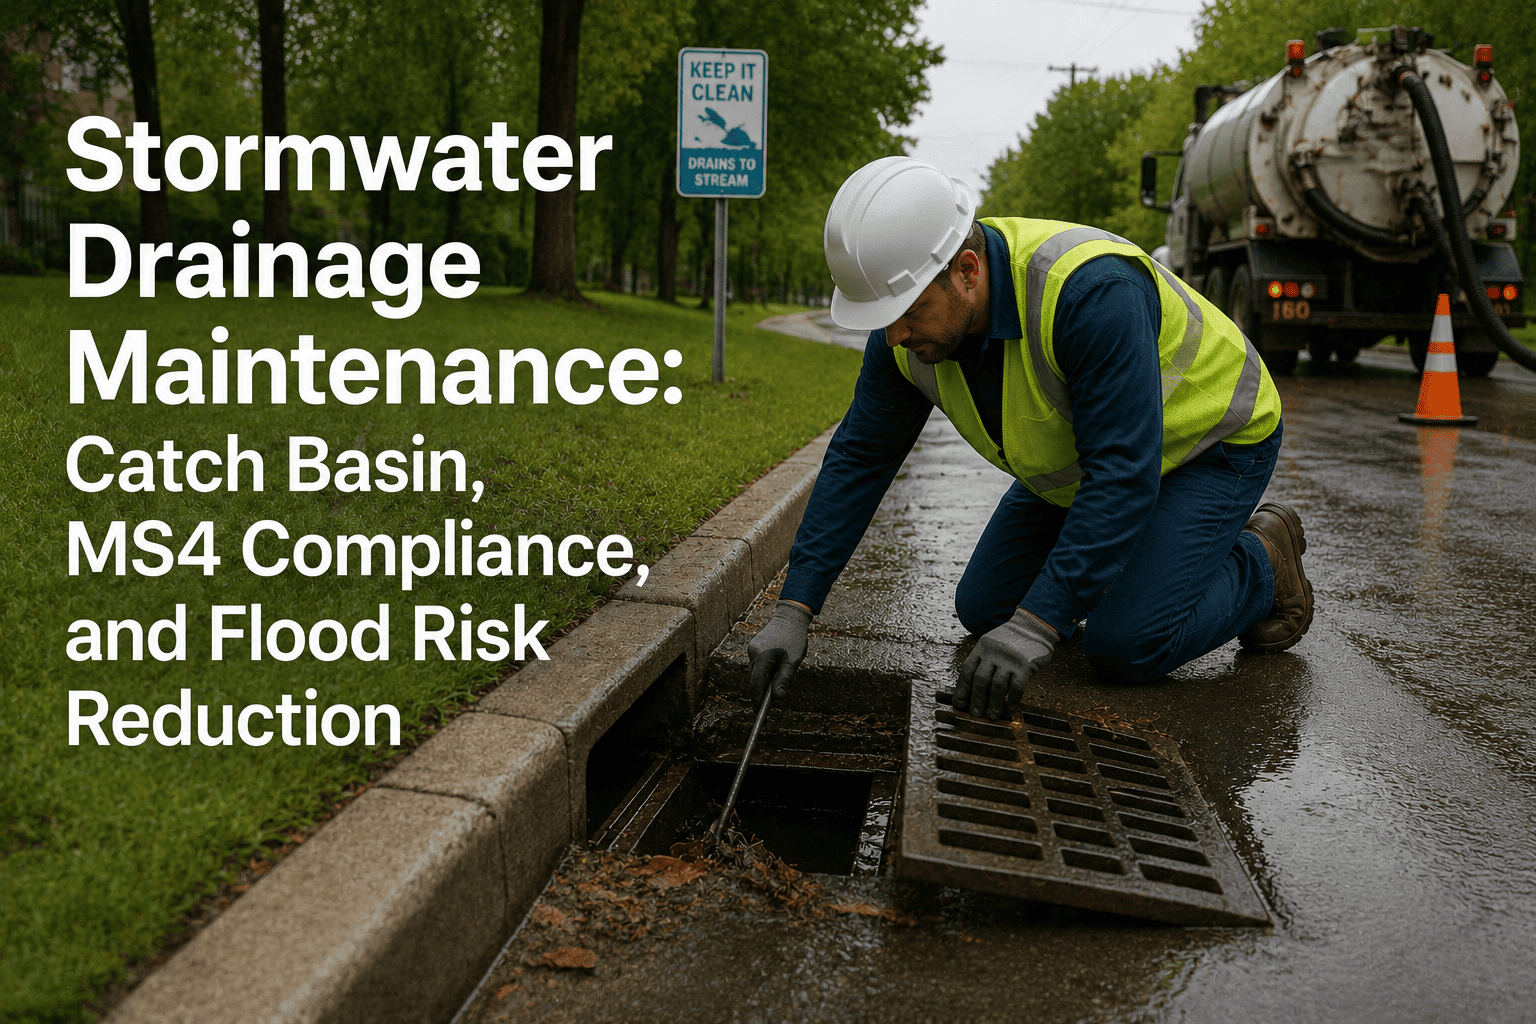
Flooding costs the United States between $179.8 billion and $496.0 billion every year in 2023 dollars — roughly 1-2% of national GDP — and the Congressional Budget Office expects that number to grow by 25-33% by 2050. The largest controllable variable in that damage number is not upstream — it is the last-mile capacity of the municipal storm drain system to actually accept water when the rain arrives. A clogged catch basin at the top of a downtown block turns a 2-inch rainfall into 4 inches of standing water; a debris-blocked culvert on a low-lying arterial turns the same event into a road closure, a stalled ambulance, and a $2.3 million insurance claim from the ground-floor retail tenant. The reason 99% of US counties have experienced a flood since 1998 is not that the rain is unprecedented — it is that the drain system that was designed for the rain is not being cleaned on the cadence the design assumes. EPA's revised Florida DEP MS4 permit dropped minimum catch basin inspection from every 10 years to every 5 — and every state DEP is following the trend, because the correlation between inspection cadence and flooding severity is measurable at the census-tract level. A properly maintained storm drain network is not a static asset; it is an operating system with a maintenance schedule that has to survive turnover, weather, growth, and 6,000+ separate inlets across a typical mid-sized city. OxMaint's Storm Drain Cleaning Schedule module creates recurring cleaning schedules with location history, GPS-optimised crew routes, blockage photo evidence, and flood-risk alerting — turning a 6,000-drain city network into a district-prioritised, weather-driven, audit-defensible maintenance program. This guide walks the priority-zoning method, the drain-type-by-risk-zone frequency matrix, the pre-storm/post-storm response timeline, the six most common blockage types and their cleaning methods, and the district-level checklist system that public works crews actually run — including how a municipal stormwater CMMS for catch basin scheduling converts NPDES MS4 permit obligations into recurring digital work orders that survive an EPA program evaluation.
Stormwater & Drainage · Preventive Maintenance · Flood-Prone Municipalities
Storm Drain Cleaning Schedule for Flood-Prone Cities
Every catch basin, curb inlet, culvert, and drainage ditch on a recurring cleaning cadence keyed to district flood risk — with location history, geo-optimised crew routes, blockage photo evidence, and pre-storm flood-risk alerting. The maintenance program that stands between design capacity and actual capacity.
$179.8B
Annual US flood damage — lower-bound estimate · Joint Economic Committee 2024
$5-8
Return per $1 invested in flood protection — up to $31 for water treatment plant protection
99%
Of US counties have experienced a flood since 1998 · NFIP data through 2024
5 years
EPA-revised minimum catch basin inspection cadence — down from 10 years
4%
Annual exceedance probability that most urban street drainage is designed to contain — assumes drains are actually clean at design capacity
$25K
Damage to a typical home from just 1 inch of standing water — the difference a working drain often prevents entirely
100,000+
Storm drain inlets across a single metro region like Los Angeles County — the scale that mandates route optimisation
40 CFR 122.26(b)(8)
Federal definition of MS4 — the regulation that anchors every catch basin cleaning program in the country
Step 1 — District Priority Zoning: Not Every Drain Cleans on the Same Schedule
A uniform "every 5 years" cadence across an entire city is regulatory-minimum compliance, not operational best practice. The map below is how OxMaint's Storm Drain Cleaning Schedule module classifies district risk — combining historic flood incident data, elevation, drainage-area coverage, and downstream impact class — and how that classification drives the frequency multiplier applied to each drain in the district.
City-Wide Flood Risk District Map · Priority Zoning
District 1 · Downtown Core
847 drains
Cadence: 8 wks
CRITICAL · impervious surface 92%
District 2 · Historic Flood Basin
612 drains
Cadence: 8 wks
CRITICAL · 4 major floods since 2015
District 3 · Riverfront Industrial
964 drains
Cadence: 12 wks
HIGH · adjacent to NPDES receiving water
District 4 · Mixed Commercial
1,247 drains
Cadence: 12 wks
HIGH · high floatable/trash load
District 5 · Older Residential
1,563 drains
Cadence: 26 wks
MEDIUM · heavy tree canopy · fall leaves
District 6 · Newer Suburban
982 drains
Cadence: 26 wks
MEDIUM · newer drainage · lower failure rate
District 7 · Elevated Zones
468 drains
Cadence: 52 wks
LOW · high elevation · minimal ponding history
District 8 · Parkland Buffer
217 drains
Cadence: 52 wks
LOW · natural infiltration buffers
District 9 · Underpasses
CRITICAL · life-safety chokepoints
7,020 total drains across the city network
Weighted mean cadence: 21.4 weeks
86% of drains covered on priority-driven cadence · 14% baseline
Step 2 — The Drain-Type × Risk-Zone Frequency Matrix
District priority is one axis of the schedule; the physical drain type is the other. A large culvert at the base of a critical-district hill has different failure modes and cleaning needs than a curb inlet on a low-risk residential street. The 5×4 matrix below is the intersection logic OxMaint applies to every asset in the storm drain inventory to derive its recurring cleaning cadence.
Drain Type ▼ · Risk Zone ►
Critical
High
Medium
Low
Catch Basin
4-8 wks
12 wks
26 wks
52 wks
Curb Inlet
6 wks
13 wks
26 wks
52 wks
Culvert & Cross Pipe
Semi-annual + pre-storm
Semi-annual
Annual
Annual
Drainage Ditch / Swale
Quarterly
Semi-annual
Annual
Annual
Detention / Retention Basin
Quarterly + post-storm
Semi-annual + post-storm
Annual + post-storm
Annual
From 6,000 drains to a district-driven schedule crews actually run
Build the Schedule Once · Run It Every Week
OxMaint imports your drain inventory (GIS shapefile, CSV, or manual entry), classifies each asset by district and drain type, applies the frequency matrix, generates GPS-optimised weekly crew routes, tracks blockage photos and cleaning duration on the mobile app, and produces the NPDES-compliant records your MS4 program manager needs to submit annually. No spreadsheets. No missed intervals.
Step 3 — The Storm Response Timeline: 72 Hours Before, 48 Hours After
Recurring cadence handles baseline load. Named storms and heavy rainfall events require a different response — and the difference between a well-run municipal drainage program and a reactive one shows up entirely in the pre-storm and post-storm windows. The timeline below is what OxMaint auto-triggers when the National Weather Service issues a watch or warning for the jurisdiction — the same trigger logic that anchors a flood risk alerting CMMS for public works program at the census-tract level.
T-72 hr
T-48 hr
T-24 hr
T-0 · Storm
T+6 hr
T+24 hr
T+48 hr
Pre-Storm
NWS watch triggers · District 1 & 9 sweep
Critical districts (downtown core, underpasses) auto-generate accelerated inspection work orders. Priority focused on known clog points, low-lying inlets, and life-safety chokepoints. Field verification of prior-cycle closures.
Pre-Storm
Culvert & cross-pipe verification
Cross-drainage assets checked for debris, upstream vegetation, and inlet grate clearance. Any Tier-1 blockages routed to jetting crew for same-day resolution. Detention basins level-verified.
Pre-Storm
Public notification & crew staging
Residents notified via 311 push of drain-adjacent parking restrictions. Response crews staged at strategic depots. On-call jetting contractors placed on standby. Emergency kit inspection completed.
Storm Event
Real-time monitoring · standing water alerts
Depth sensors at critical inlets stream depth data. Standing water >4 inches auto-creates emergency response work order. Public 311 reports auto-geolocated to nearest known drain asset. No routine cleaning during active event.
Post-Storm
Chokepoint clearance sweep · life-safety first
Underpasses, arterial low points, hospital-adjacent zones cleared within 6 hours of storm passage. Rapid photo evidence captured for post-event reporting. Damaged inlets or grates flagged for repair work order.
Post-Storm
Critical & high districts · rapid revisit
Districts 1-4 revisited within 24 hours. Debris load documented. Sediment removal from downstream detention basins. Any new failure patterns flagged for the next cleaning cycle. NPDES event report initiated.
Post-Storm
Full system recovery + capacity review
All medium and low districts inspected within 48 hours. Where standing water persists, upstream root cause identified and scheduled. Event debris volume totalled. Capital planning notes fed into next-quarter forecast.
Step 4 — Blockage Type Taxonomy: Six Failure Patterns, Six Cleaning Methods
Not every blockage responds to the same cleaning method. Sending a jetting truck for a tree root blockage wastes half a shift; sending a hand-crew for a sediment-packed catch basin means the crew leaves without actually resolving the failure. The taxonomy below is how OxMaint's mobile app pre-classifies the expected cleaning method for each work order, so the right crew shows up with the right equipment — matched against the operational playbook underpinning a public works blockage photo evidence CMMS workflow.
B1
Organic Debris · Leaves
Method:Hand raking + grate scraping
Equipment:Hand rake, grate hook, bagging
Duration:8-15 min per drain
Season:Autumn peak · post-leaf-drop
B2
Sediment & Silt Buildup
Method:Vacuum truck extraction
Equipment:Vac truck, dewatering setup
Duration:25-45 min per catch basin
Season:Year-round · post-storm heavy
Method:Manual retrieval + skimmer
Equipment:Extraction tools, contractor bags
Duration:10-20 min per drain
Season:Year-round · high-commercial districts
Method:Mechanical root cutting + jetting
Equipment:Root cutter, high-pressure jetter
Duration:60-120 min per section
Season:Older residential · spring/summer
B5
Oil, Grease & Illicit Discharge
Method:Absorbent booms + IDDE report
Equipment:Absorbents, spill kit, sampling
Duration:30-60 min + investigation
Season:Year-round · triggers NPDES IDDE
Method:Vac + violation notice to site operator
Equipment:Vac truck, chargeback documentation
Duration:45-90 min + enforcement handoff
Season:Any active construction zone
Step 5 — District-Based Inspection Checklists Crews Actually Complete
Every drain visit closes with a completed digital checklist — the record that lets the MS4 program manager demonstrate NPDES compliance on demand. The blocks below are the field checklists OxMaint pre-loads for each drain type, split into the three zones a crew moves through during a typical inspection.
Zone A · Inlet Approach & Surface Condition
Grate present, seated, and undamaged — no missing bars, no visible corrosion, no vehicle-impact damage
Photo required · Role: Field Crew
Approach curb and gutter clear of vegetation, sediment, and standing debris impeding flow to inlet
Photo required if action needed · Role: Field Crew
Pavement condition around inlet checked — no undermining, no differential settlement, no cracking
Referral to pavement WO if degraded · Role: Field Crew
Zone B · Sump & Sediment Chamber
Sump depth measured — sediment level below EPA-recommended 50% of sump depth trigger
Measurement recorded · Role: Field Crew
Blockage type classified (B1-B6 taxonomy) — cleaning method documented and applied
Classification required · Role: Field Crew
Extracted material disposed per NPDES-approved disposal pathway — no roadside dumping
Disposal manifest recorded · Role: Field Crew
Illicit discharge signatures checked — oil sheen, unusual color, odor, non-stormwater flow
IDDE report if positive · Role: Field Crew
Zone C · Outlet & Downstream Verification
Outlet pipe unobstructed — camera or physical verification that flow is unimpeded downstream
Sump camera imagery attached · Role: Field Crew
Post-cleaning photo captured — before-and-after evidence archived to work order
Mandatory closure photo · Role: Field Crew
Next-cycle cadence auto-scheduled based on district priority, drain type, and observed load
Auto-generated · Role: OxMaint scheduler
Operational KPIs Your MS4 Program Manager Needs Every Quarter
Target: above 95%
Scheduled Cleaning Completion Rate
Percentage of scheduled cleanings completed within their prescribed cadence window per district. The primary metric a state DEP will pull during an MS4 program evaluation. Below 85% typically triggers additional oversight.
Target: under 24 hr
Pre-Storm Sweep Latency
Elapsed time from NWS storm watch issuance to completion of critical-district sweep. Sub-24-hour compliance directly reduces post-storm flood claim volume in NFIP-mapped zones.
Target: 100%
Photo-Evidence Closure Rate
Percentage of closed cleaning work orders with before/after photo evidence attached. Insurance claim defense, tort claim response, and IDDE investigations all depend on this evidence chain being complete.
Target: above 88%
Route Compliance vs Plan
Percentage of daily route stops actually completed vs the geo-optimised plan. Below 75% indicates either overloaded routing or field workflow friction that will bottleneck the annual program.
Target: under 5%
Post-Storm Backlog Ratio
Percentage of post-storm work orders that remain open beyond the T+48 hour window. Elevated backlog signals under-resourced storm response capacity or over-optimistic pre-storm scheduling.
Target: under 10%
Repeat-Blockage Recurrence
Percentage of drains flagged for a repeat blockage of the same type within one cadence cycle. Elevated recurrence indicates upstream root causes (tree root growth, illicit dumping source, chronic litter zone) that require targeted remediation.
Expert Review
"
The most consistent operational pattern I see across mid-sized US public works departments is a storm drain program that runs at regulatory minimum — the once-every-5-years or once-every-3-years inspection cadence that satisfies the state DEP paperwork but does not actually keep the drains clean. Then a Hurricane Helene-scale event happens, the downtown floods, the council asks what happened, and the answer is that 60% of the catch basins in the affected district had not been touched in over two years. In 26 years designing municipal drainage programs, the single highest-leverage change any public works director can make is moving from a uniform cadence to a district-priority cadence keyed to actual flood risk history. It does not require more crews. It requires the CMMS to know which district each drain belongs to and to schedule accordingly. The second highest-leverage change is the pre-storm sweep — the 72-hour window during which the drains in the critical districts get one last inspection before the rain arrives. That single practice, applied consistently across a 5-year window, reduces post-storm flood-claim volume in NFIP zones by measurable double digits. OxMaint's storm drain module is one of the few implementations I have evaluated that treats these as first-class operational primitives rather than reporting checkboxes — which is why it works when the crews actually run it.
Dr. Elena Marchetti-Ashcroft, P.E., D.WRE, CFM
Water Resources Engineering Consultant · 26 years municipal stormwater program design across 40+ US cities · Diplomate Water Resources Engineer · Certified Floodplain Manager · Specialism in EPA MS4 permit compliance and NPDES program evaluation
Frequently Asked Questions
Q1
How do we import our existing storm drain inventory into OxMaint — GIS data, spreadsheets, paper records?
OxMaint supports all three inputs.
GIS shapefile ingestion is the fastest path — most mid-to-large cities already have their storm drain network mapped in a public works GIS system and can export ESRI shapefiles or GeoJSON for direct import. For departments running on spreadsheets,
CSV upload with GPS coordinates maps each drain to its physical location. For older departments still on paper inspection cards, the OxMaint mobile app supports field-based drain registration during the first cleaning cycle — technicians drop a GPS pin, photograph the inlet, and classify the drain type in under 90 seconds per asset. Most cities are fully migrated within 60-90 days of implementation start.
Book a demo to review your current inventory format.
Q2
How does OxMaint integrate with our NPDES MS4 annual reporting requirements?
OxMaint captures every data element the EPA MS4 Program Evaluation Guidance requires:
catch basin cleaning records (per-drain frequency, cleaning method, extracted material volume, disposal manifest),
SOP documentation for stormwater-related maintenance activities,
IDDE investigation records when illicit discharge signatures are logged, and
annual training records for field crew good-housekeeping compliance. The platform generates state-DEP-formatted annual report exports (Massachusetts May 1, Connecticut extended-permit cycles, PA PAG-13 requirements) that can be submitted directly to the state authority. When a state DEP program evaluator requests the "catch basin cleaning records for the month of X," the report generates in under 5 minutes.
Read more on MS4 reporting integration.
Q3
How does the platform handle route optimisation across a 6,000-drain network?
OxMaint applies geo-optimisation algorithms to the weekly workload after district cadence and drain-type frequency have been calculated. The routing engine minimises total drive distance, respects crew shift length, avoids one-way street conflicts and school-zone timing restrictions, and produces daily routes that a two-person crew can execute in a standard 8-hour shift. When a critical-district event breaks the plan (a flood-adjacent complaint, an IDDE report, a pavement collapse over a drain), the routing engine automatically reshuffles the affected day's stops rather than requiring the crew to run the full plan and defer the emergency. In practice, geo-optimised routes typically increase daily drain throughput by 30-45% vs manual dispatch — the equivalent of adding a full crew without hiring.
Q4
Can OxMaint auto-trigger pre-storm sweeps from National Weather Service watches and warnings?
Yes. OxMaint integrates with NWS weather.gov feeds for the jurisdiction's alerts and warnings, and applies configurable trigger logic: a Flood Watch or Flash Flood Watch auto-generates the T-72 hour critical-district sweep work orders; a Flood Warning escalates to T-24 hour crew staging; a Flash Flood Warning immediately routes crews to known chokepoint drains regardless of routine schedule. The trigger thresholds are per-jurisdiction configurable — coastal cities with tropical storm exposure typically set more aggressive thresholds than inland cities with primarily convective-storm exposure. All pre-storm actions are captured in the post-event report package that many jurisdictions submit to their state emergency management agency after named events.
Q5
What is the realistic ROI window for standing up a district-priority storm drain program?
The measurable ROI compounds across three distinct benefit streams. First,
avoided flood damage — the Joint Economic Committee's analysis and CBO reporting both put the return on flood-protection spending at $5-8 per $1 invested, with water treatment plant protection running up to $31 per $1. Second,
reduced NFIP claim volume — measurable at the census-tract level within 24-36 months of program maturity. Third,
crew productivity — geo-optimised routes with mobile-app field documentation typically raise daily drain throughput by 30-45%. Most cities see the CMMS subscription cost fully offset by crew productivity gains alone within 12 months, with the flood-damage-avoidance value realised on the first major storm event that would otherwise have overwhelmed clogged inlets.
Start an OxMaint free trial to model your city's specific ROI profile.
From uniform 5-year cadence to district-priority weekly programs
Rain Arrives on a Schedule Your Drains Don't Set — But Your Cleaning Program Does
OxMaint builds recurring storm drain cleaning schedules keyed to district flood risk, drain type, and NWS weather triggers — with geo-optimised crew routes, blockage photo evidence, mobile checklist completion, and NPDES-ready MS4 reporting. The maintenance program that stands between design capacity and actual capacity — for every one of the 6,000+ drains in a typical mid-sized city.