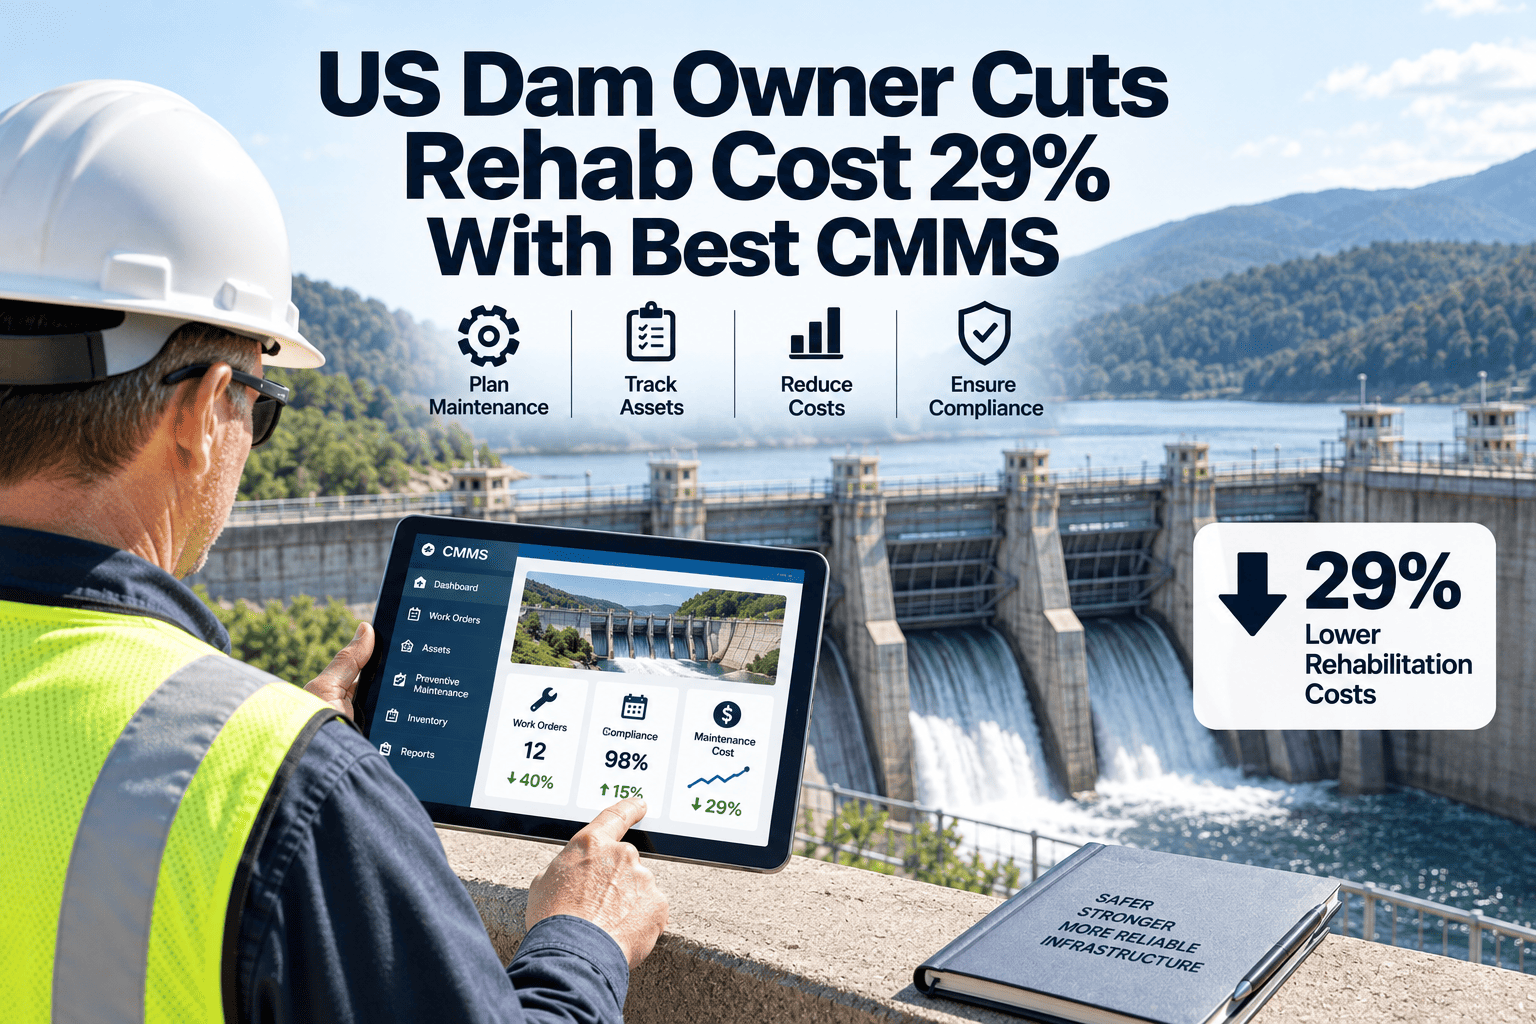
A multi-state dam owner operating 34 regulated dams was funding rehabilitation the way most portfolios do — one deficiency letter, one emergency repair, one squeaky-wheel project at a time — until a $31 million backlog of deferred spillway, embankment, and outlet works work made that approach impossible to sustain. This case study walks through how the owner rebuilt its capital planning process around risk-informed prioritization inside a CMMS built for infrastructure asset management, cut projected rehabilitation cost by 29%, and sequenced $18 million of capex across three fiscal years without a single high-hazard structure slipping further down the queue.
Case Study · Dam Safety & Capital Planning
How a 34-Dam Owner Cut Rehabilitation Cost 29% With Risk-Based Capital Sequencing
A composite account, built from patterns common across mid-sized U.S. dam portfolios, of how a state-regulated dam owner replaced ad hoc deficiency response with a risk-informed prioritization workflow — turning a $31 million rehabilitation backlog into a sequenced, board-approved capital plan.
29%
reduction in total projected rehabilitation cost through risk-based sequencing
$18M
capex committed and sequenced across a 3-year rolling capital plan
34
dams brought under one condition-rated, centrally tracked asset record
6
high-hazard potential structures moved off the state's deficiency watch list
The Portfolio Before: Deficiency Letters Driving the Budget
Before the rebuild, the owner's capital plan was effectively written by its state dam safety regulator. Periodic inspection reports flagged deficiencies, deficiency letters set informal deadlines, and whichever project had the most recent or most alarming letter attached got funded first — regardless of whether it was actually the highest-consequence structure in the portfolio.
Before
Prioritization basisMost recent deficiency letter
Condition dataScattered across paper inspection reports
Capital planning horizonSingle fiscal year, reactive
High-hazard visibilityNo portfolio-wide risk ranking
Rehab cost trendRising — deferred items compounding
VS
After
Prioritization basisScreening-level risk score per dam
Condition dataCentralized asset records with inspection history
Capital planning horizonRolling 3-year sequenced plan
High-hazard visibilityRanked dashboard across all 34 structures
Rehab cost trendDown 29% against original scope estimates
Why Deficiency-Driven Spending Was Getting More Expensive Every Year
This pattern is well documented in dam safety practice: every year a known deficiency goes unaddressed, the eventual repair scope tends to grow as deterioration compounds and secondary issues — seepage paths, spillway erosion, outlet works corrosion — develop around the original finding. The owner's engineering staff estimated that projects funded reactively, after a second or third deficiency letter, cost 30 to 60% more than the same scope would have cost if addressed at first identification.
No Portfolio-Wide Risk Score
Each dam's risk was assessed individually during its own inspection cycle, with no consistent scoring method to compare a spillway capacity deficiency at one dam against an embankment seepage concern at another.
Condition Data Trapped in PDFs
Inspection reports from consulting engineers arrived as static PDFs, filed by year and by dam, with no structured way to track how a specific defect had progressed across multiple inspection cycles.
No Link Between Findings and Budget
Engineering identified deficiencies; finance built the budget separately, using rough order-of-magnitude estimates that were rarely revisited once a project was funded.
The Risk-Informed Prioritization Framework
The owner adopted a screening-level risk analysis approach consistent with the methodology FEMA's National Dam Safety Program has promoted for Rehabilitation of High Hazard Potential Dams (HHPD) grant applicants — scoring each structure on probability of failure across the relevant failure modes and the downstream consequences if that failure occurred, then combining the two into a single relative risk ranking.
Risk Score Composition Applied Across the 34-Dam Portfolio
Downstream Consequence — 30%
Probability of Failure (Static/Hydrologic/Seismic) — 25%
Current Condition Rating — 20%
Cost-to-Risk-Reduction Ratio — 15%
Regulatory / EAP Urgency — 10%
From Score to Sequenced Capital Plan
Every one of the 34 dams received a risk score, an estimated rehabilitation cost, and a cost-to-risk-reduction ratio — the amount of risk retired per capital dollar spent. Structures were then sequenced into a three-year plan that funded the highest risk-reduction-per-dollar projects first, rather than the projects with the most recent regulatory correspondence.
See how a risk score gets built from your own inspection history.
Walk through condition rating, consequence classification, and capital sequencing in a live session.
What Changed Operationally
The risk scoring exercise was only half the project. The other half was giving engineering and finance a shared system of record so the ranking stayed current instead of decaying back into a static spreadsheet within a year.
01
Every dam became a tracked asset
Each structure's inspection history, condition ratings, prior repairs, and instrumentation readings were consolidated into a single asset record inside OxMaint, replacing the PDF archive.
02
Deficiencies became work orders, not letters
Every finding from a periodic inspection generated a work order tied to the specific dam and defect, carrying its own status, target date, and cost estimate instead of living in a filed letter.
03
The capital plan became a live dashboard
Finance and engineering worked from the same ranked view of risk score, estimated cost, and sequencing, updated as new inspection data arrived rather than rebuilt once a year.
04
EAP and compliance documentation stayed current
Emergency Action Plan references and state compliance deadlines were linked directly to each dam's record, so regulatory urgency fed into the risk score automatically rather than being tracked separately.
Why the Cost Reduction Held Up
The 29% figure did not come from cheaper contractors or reduced scope — it came from sequencing. Addressing the six highest-risk structures before their deficiencies compounded avoided the secondary repair scope that reactive projects typically absorb, and bundling adjacent minor findings into the same mobilization at each dam cut repeated engineering and mobilization costs across the portfolio.
We used to fund whatever the state's letter was most recent about. Now we fund whatever retires the most risk per dollar, and the state reviewers can see exactly how we made that call — which has made the regulatory conversation completely different.
— Composite account reflecting practices common to mid-sized U.S. dam safety programs
Frequently Asked Questions
What is a screening-level risk analysis for dams?
It is a structured comparison of failure probability across relevant failure modes and downstream consequence, producing a relative risk ranking that can be applied consistently across an entire dam portfolio.
How is this different from prioritizing by hazard classification alone?
Hazard classification only describes potential consequence if a dam fails; risk-based prioritization combines that with actual probability of failure and current condition, so two high-hazard dams can rank very differently.
Does this replace state dam safety inspection requirements?
No — periodic state-mandated inspections remain the source of condition data; the CMMS layer organizes that data into a comparable, trackable risk record rather than replacing the inspection itself.
Can a smaller dam owner use this approach with only a handful of structures?
Yes — the scoring framework scales down; even a five- or ten-dam portfolio benefits from a consistent, documented ranking when justifying capital requests to a board or regulator.
How do we get our own inspection history into a system like this?
Historical inspection reports and deficiency letters are imported as asset and work order records;
sign in to OxMaint or book a walkthrough to see the import and scoring process.
Turn Your Deficiency Backlog Into a Sequenced Capital Plan
Bring inspection history, condition ratings, and deficiency findings into one risk-ranked asset record — and give your board a capital plan they can actually defend.