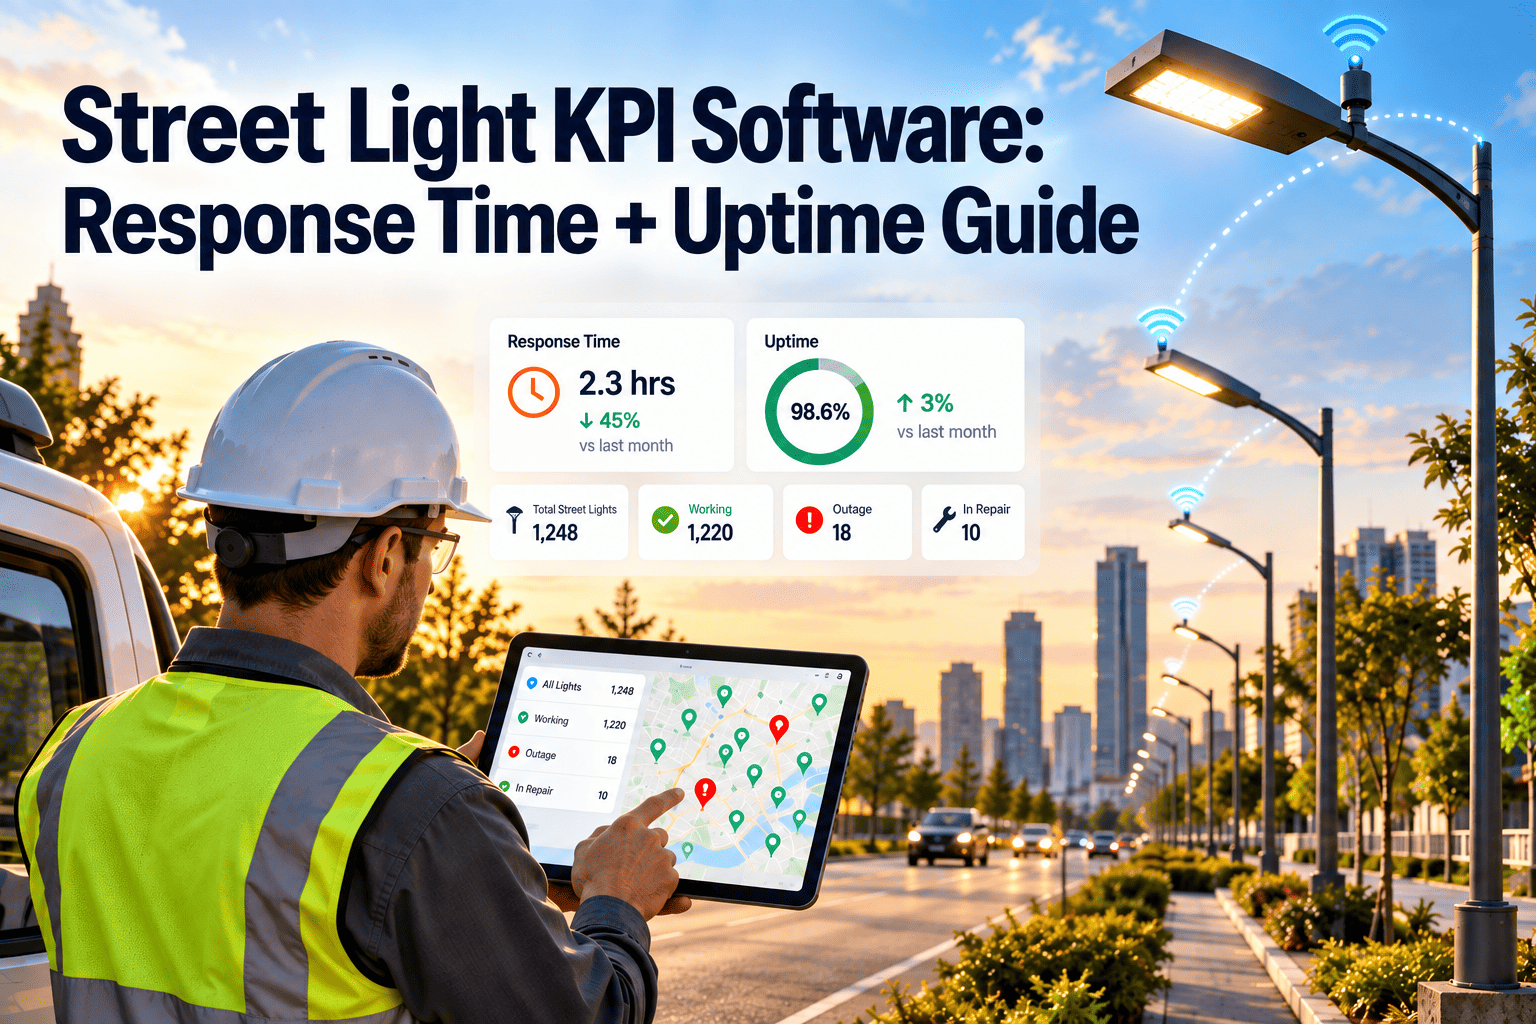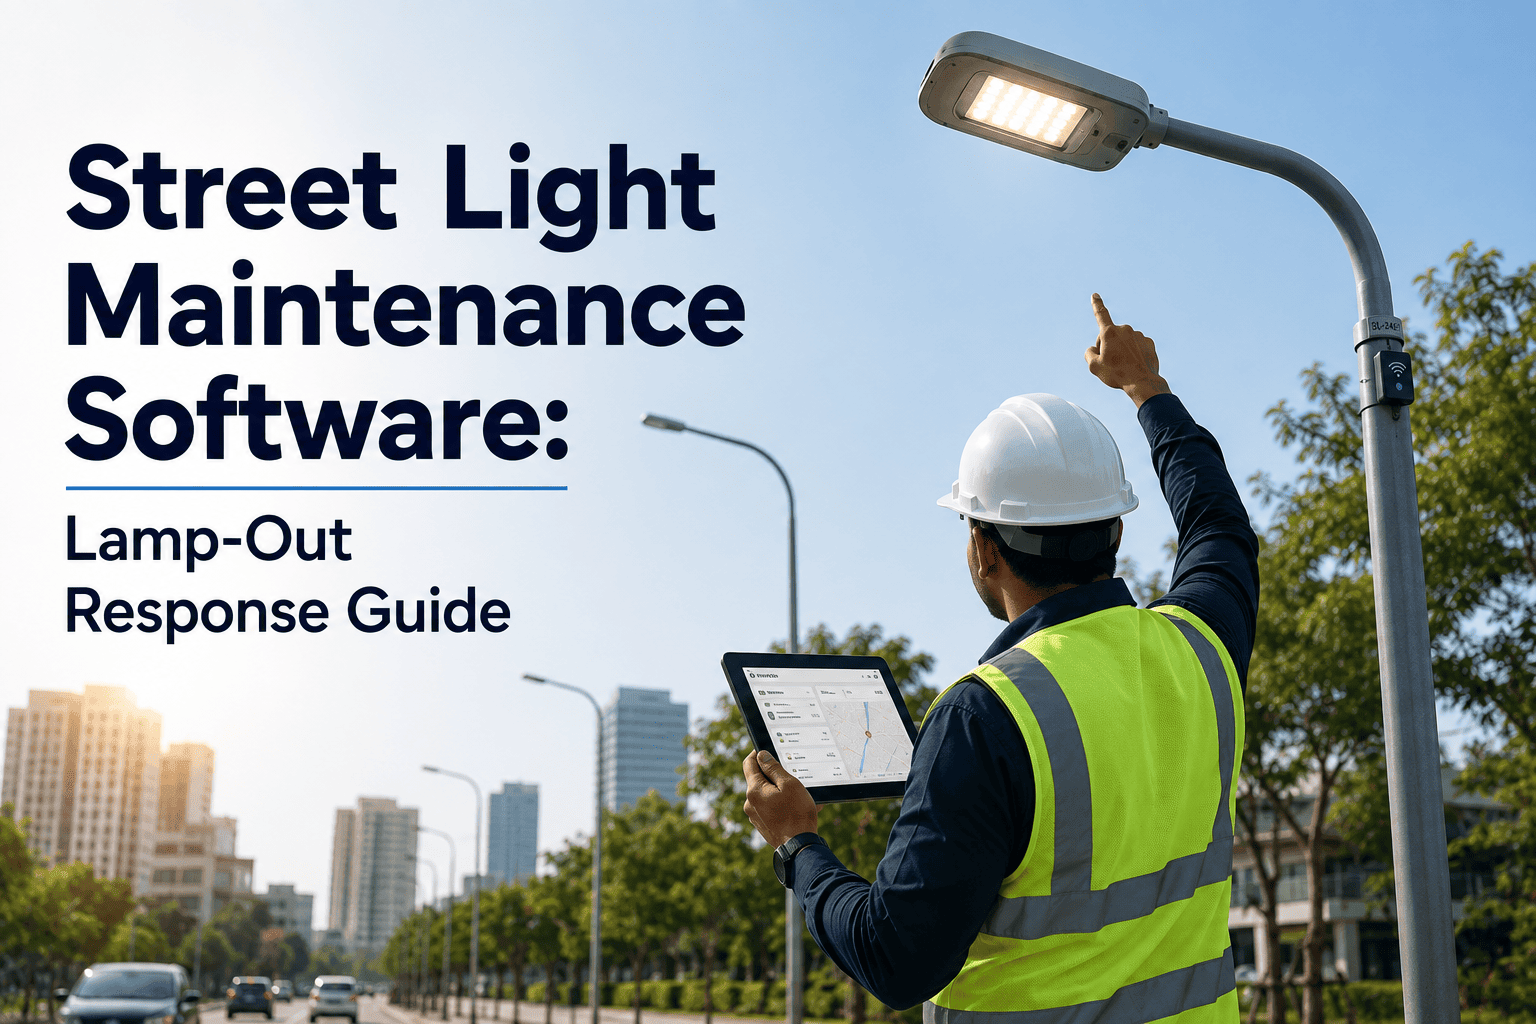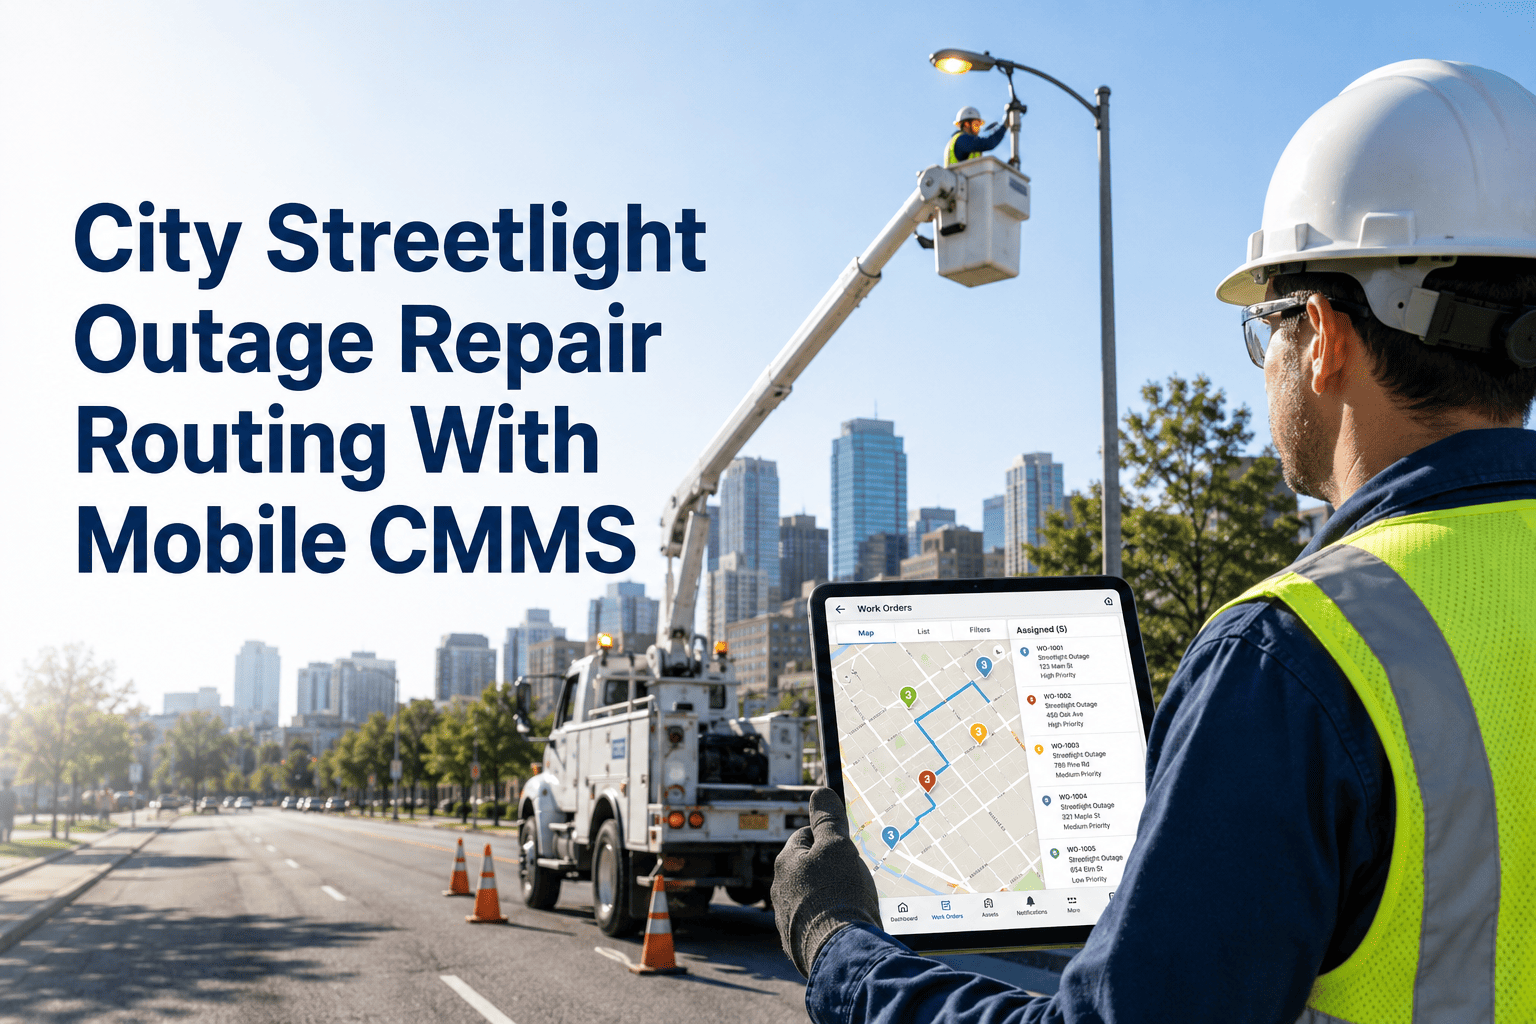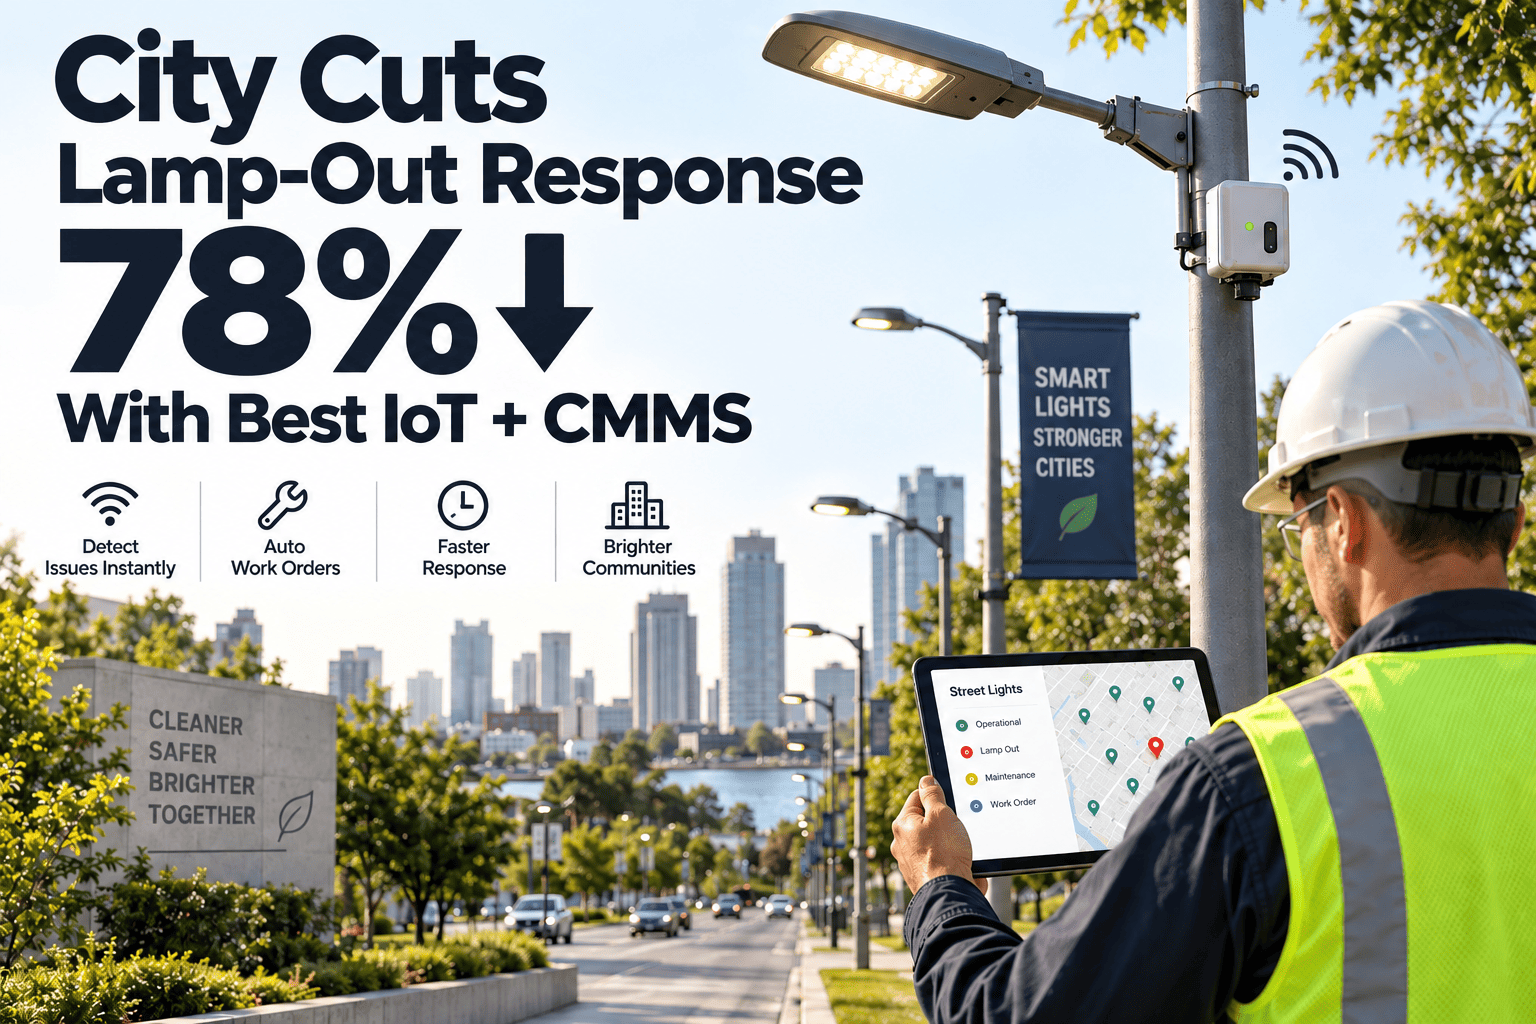
Streetlight outages are one of the few maintenance failures every resident notices and reports — which is exactly why lamp-out response time has become a public works KPI that city councils track as closely as pothole repair. The scenario below walks through what a typical mid-size lighting district experiences when it moves from a citizen-complaint-driven repair model to sensor-based outage detection tied to a connected CMMS — a pattern reflected across the smart-lighting rollouts public works departments have reported over the past several budget cycles.
What happens when a city stops driving around looking for dark streetlights
This is a representative, composite scenario built from the outcomes public works departments commonly report after pairing IoT lighting sensors with a connected CMMS — not a single named city's audited results. Treat the figures as realistic ranges, not guarantees.
Why this is framed as a scenario, not a case study
Every specific number below is written as an illustrative range rather than a precise, audited result from one identifiable city, because we have not published a verified, attributable case study for this workflow yet. We'd rather be upfront about that than dress up an invented result as a real one.
What follows reflects patterns that show up consistently across public reporting on municipal IoT lighting programs — faster fault detection, fewer citizen complaints, and lower energy spend — without attaching those patterns to a specific city's name or a quote from an official who did not actually say it. If your department has run this transition and wants a real case study built from your own numbers, we would rather write that one.
Where most lighting districts begin: reactive, complaint-driven repair
Before sensors are introduced, a typical mid-size lighting district — tens of thousands of fixtures spread across a metro area — discovers most outages the same way: someone calls it in.
- Outages typically surface 3 to 7 days after failure, once a resident notices and reports it
- Crews drive fixed routes at night looking for dark spots, independent of where failures actually are
- "Day-burners" — lights stuck on during daylight — often go unnoticed for weeks, wasting energy
- Repeat truck rolls are common when the root cause (ballast, wiring, photocell) isn't diagnosed on the first visit
- No documented response-time record to show a council or ADA reviewer on request
- Current, voltage, and photocell sensors detect a fault within minutes of it occurring
- A work order is auto-generated in the CMMS and routed to the nearest available crew
- Day-burners and slow-degrading drivers are flagged before a full failure, not after
- Every outage and repair is timestamped, giving public works a defensible response-time record
- Dimming and scheduling data reduce energy draw independent of outage response
The ranges public works departments commonly report
These are illustrative ranges drawn from the pattern of outcomes reported across municipal smart-lighting programs generally — not a single audited result. Any individual district's numbers will depend on fixture count, network coverage, and crew staffing.
Treat every figure in this section as a directional range, not a forecast for your specific district. Fixture age, network density, and crew capacity all change the outcome — which is exactly why a pilot phase matters before a city-wide commitment.
The structural reasons a complaint-based model can't move faster
It isn't that complaint-driven public works teams are slow to respond — it's that the model itself has a built-in detection lag no amount of crew effort can fix.
A resident has to notice a dark streetlight, decide it's worth reporting, and actually file the complaint — a process that can take days on its own, especially in lower-traffic residential areas where a single outage is easy to overlook. Once the complaint arrives, it still has to be logged, verified, and routed to a crew, often through a general-purpose 311 system that wasn't built for asset-specific dispatch. Night patrol routes, when departments run them, cover fixed geography rather than actual failure locations, so a crew can drive past working lights for hours while a real outage sits unreported three neighborhoods away.
Day-burning lights compound the problem in the opposite direction: because they're on, nobody complains, even though they're drawing full energy 24 hours a day. Without sensor telemetry, these failures are typically caught only during a scheduled visual audit — sometimes not for months.
Why some outages come back after they're "fixed"
A meaningful share of repeat lamp-out tickets in complaint-driven programs trace back to the same root causes going undiagnosed on the first visit.
Bulb swapped, ballast ignored
A failing ballast or driver can mimic a simple bulb failure. Replacing only the bulb resolves the symptom temporarily and generates a second ticket weeks later.
Wiring and connection faults
Intermittent wiring issues can cause a light to work during a daytime inspection visit and fail again after dark, closing the ticket without resolving it.
Photocell miscalibration
A misbehaving photocell can cause a light to switch on and off unpredictably, generating multiple separate complaints for what is really one underlying issue.
Tickets closed on incomplete data
Without sensor confirmation, a crew's field note is the only record of whether an issue was actually resolved — and that record isn't always accurate.
Sensor telemetry closes this gap by confirming, electronically, whether a fixture is actually drawing current correctly after a repair — rather than relying on a crew's visual check at the time of the visit — which is a large part of why programs that adopt it report fewer repeat truck rolls.
What to measure before your pilot starts
The single biggest reason departments can't later prove the impact of a sensor rollout is that they never captured a clean "before" baseline to compare against.
- Average days from outage occurrence to repair completion, across the last 12 months of closed tickets
- Total citizen lighting complaints per month, by district or corridor
- Estimated day-burner count, from the most recent visual audit or spot check
- Repeat-ticket rate — the share of "closed" outages that reopened within 90 days
- Current energy spend attributable to streetlighting, from the utility billing record
Capturing these five figures in the CMMS before a single sensor is installed is what turns a pilot into a defensible comparison later — the difference between telling a council "it feels faster" and showing them the actual before-and-after numbers from your own district.
See what this would look like for your fixture count
Bring your fixture count and current complaint volume — we'll walk through realistic expectations for a pilot rollout.
A phased path from pilot to city-wide coverage
Departments that succeed with this transition tend to follow a similar phased structure rather than attempting a full city-wide cutover at once.
Asset inventory and digital twin
Every fixture is logged as an asset in the CMMS with location, fixture type, and install date, establishing full visibility before any sensors go in.
Sensor pilot on priority corridors
IoT controllers are installed on a subset of fixtures — often high-complaint or high-crime corridors first — and integrated with the CMMS to auto-generate work orders.
Validate response time and cost impact
Pilot-corridor response times, complaint volume, and energy use are compared against the pre-pilot baseline before committing further budget.
City-wide rollout and dimming optimization
Sensors and CMMS integration scale to the full fixture inventory, with adaptive dimming schedules layered on once outage response is stable.
Why one city's results won't match another's exactly
The wide ranges in the stats above exist because a handful of variables materially change what a lighting district can expect from this transition.
Network coverage at rollout
Results scale with the share of fixtures actually carrying sensors — a partial pilot corridor will not show city-wide complaint reduction.
Baseline fixture condition
A district with a large backlog of degraded ballasts and wiring will see slower initial improvement than one starting from recently retrofitted LED fixtures.
Crew capacity and dispatch model
Faster fault detection only shortens response time if crew scheduling and dispatch logic in the CMMS are configured to act on the alerts promptly.
Data quality from day one
Districts that start with a clean, accurate fixture inventory see cleaner reporting sooner than those reconciling legacy asset records mid-rollout.
What the CMMS actually does in this workflow
Oxmaint's role in a rollout like this is to sit between the sensor network and the crew in the field — turning a fault signal into a tracked, closed work order.
IoT sensor integration
Connects to current, voltage, and photocell sensors on smart fixtures to detect faults and day-burners in real time.
Automatic work order creation
Fault signals generate a work order automatically, routed to the nearest crew without manual triage from a control room.
Mobile crew workflows
Field crews receive, update, and close work orders from a mobile device, capturing root cause and parts used on the first visit.
Response-time reporting
Every outage is timestamped from detection to closure, giving public works a defensible record for council and ADA reporting.
Asset lifecycle tracking
Fixture-level history — repairs, part replacements, degradation trends — supports predictive replacement planning over time.
Portfolio dashboards
Complaint volume, response time, and energy trends roll up into a single dashboard for budget and performance reporting.
The KPIs to track once the pilot is live
Once sensors and the CMMS are connected, four ongoing KPIs give public works a running picture of whether the rollout is delivering — not just a one-time before-and-after snapshot.
- Fault-to-work-order time — how quickly a detected fault becomes an assigned, trackable work order
- Work-order-to-repair time — how quickly an assigned crew actually closes the ticket in the field
- Repeat-ticket rate over the following 90 days, to confirm root-cause fixes rather than symptom fixes
- Monthly citizen complaint volume, tracked against the pre-pilot baseline corridor by corridor
Tracking these four numbers monthly, rather than reviewing them once a year, is what lets a department catch a stalled rollout early — a sensor network that isn't actually shortening fault-to-work-order time is a configuration problem worth fixing before it's scaled city-wide. Departments that build this habit early tend to have a much easier time defending the next phase of the rollout budget, because they can point to their own trend line instead of an industry average.
Smart lighting response time — five common questions
Questions public works teams raise most often when evaluating a sensor-based lighting maintenance program.
Are the response-time and complaint figures on this page from a real city?
No — they are illustrative ranges reflecting patterns reported across municipal IoT lighting programs generally, not an audited result from one named city. We've labeled them as a composite scenario for that reason.
How many fixtures need sensors before we see a measurable difference?
Most departments pilot on a few hundred to a thousand fixtures in a priority corridor first, which is enough to validate response-time improvement before committing to a full fixture count rollout.
Does this work with our existing LED retrofit, or do fixtures need to be replaced?
Smart controllers typically retrofit onto existing LED fixtures rather than requiring full fixture replacement, which is part of why pilot programs can move quickly.
Can this data support ADA or public safety SLA reporting?
Yes — because every outage and repair is timestamped from detection to closure, the same data used for internal dashboards can support external compliance and council reporting. Book a Demo to see the reporting fields.
How do we get a real case study instead of this illustrative scenario?
If your department runs a pilot and tracks results against your own baseline, we can build a verified case study from your actual numbers. Start a free trial to begin tracking your baseline today.
Stop discovering outages from citizen complaints
Import your fixture inventory, pilot sensor integration on one corridor, and track your own response-time baseline from day one.
Free 14-day trial · No credit card