For most municipalities, the water distribution system is the single most valuable asset on the balance sheet and the most expensive one to ignore. A cast-iron main installed in the 1960s is now operating decades past its design life, and every deferred valve exercise, unlogged repair, and skipped pressure assessment compounds into the next 3 a.m. break. This guide maps a defensible, CMMS-driven maintenance program, from pipe condition scoring to daily pressure management, to cut main breaks, reduce non-revenue water, and keep your community in compliance. If you want to put it into practice immediately, you can Start Free Trial and configure your asset register the same day.
MUNICIPAL WATER DISTRIBUTION
Every deferred valve is a main break waiting for a deadline.
Aging mains break at the worst possible time and the worst possible cost. Build a CMMS-driven distribution reliability program that turns reactive repairs into scheduled, compliant, auditable work.
ANNUAL COST OF MAIN BREAKS (U.S.)
$2.8B
in emergency repairs, property damage, and lost treated water every year.
THE COST OF INACTION
What deferring water main maintenance actually costs
The EPA estimates the U.S. needs $472B in drinking water infrastructure investment over 20 years. The utilities that delay feel it first in break frequency and boil-order risk.
240K
MAIN BREAKS PER YEAR
Roughly one every two minutes across U.S. systems, costing utilities an average of $10K per break in direct repair alone.
16%
NON-REVENUE WATER
Treated water lost before it reaches a meter. A 10,000-connection system losing 16% is shedding over $400K in unrealized revenue annually.
50 YR
AVERAGE MAIN AGE
Over 30% of U.S. distribution mains have exceeded their 75-year design life, pushing break rates up 27% in the last decade.
THE DISTRIBUTION RELIABILITY PROGRAM
Four pillars of defensible distribution maintenance
An ISO 55000-aligned program does not chase leaks. It manages asset condition, valve operability, pressure transients, and compliance records as a single closed loop.
Pipe condition assessment & risk scoring
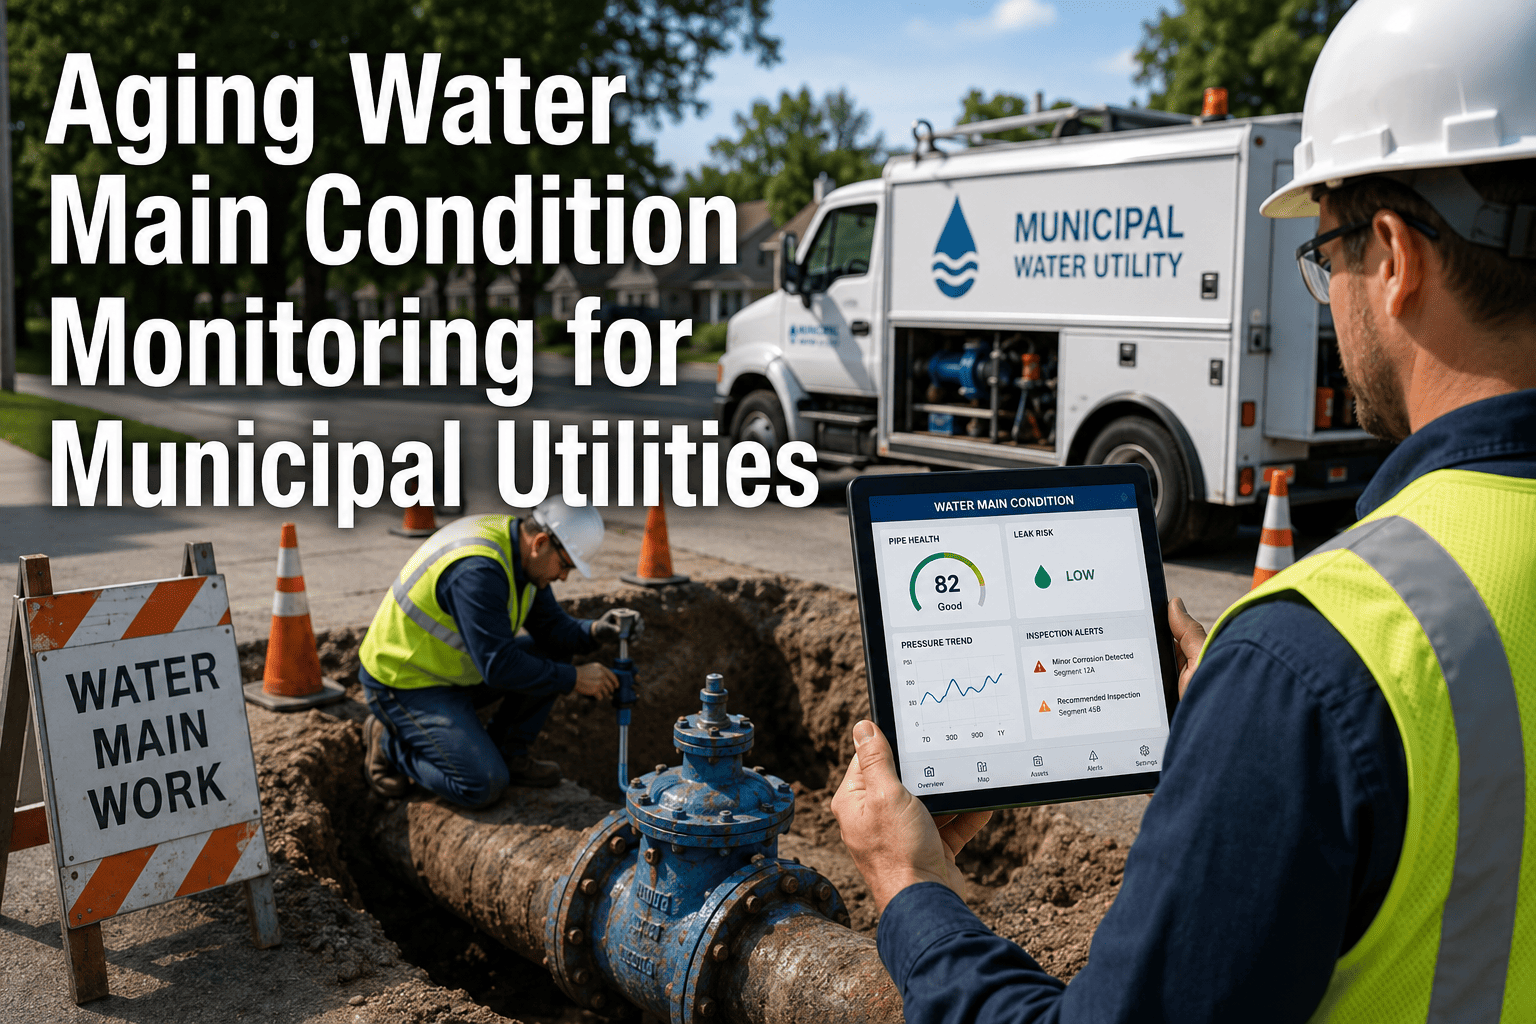
Rank every main by a composite risk index: material (cast iron, AC, PVC), age, soil corrosivity, break history, and criticality (hospital, school, arterial road). A weighted 1–5 score tells crews where to dig before the main tells them. A typical 50-mile system carrying 3,000 pipe segments can be fully scored inside a CMMS in under 30 days.
Valve & hydrant exercising on cycle
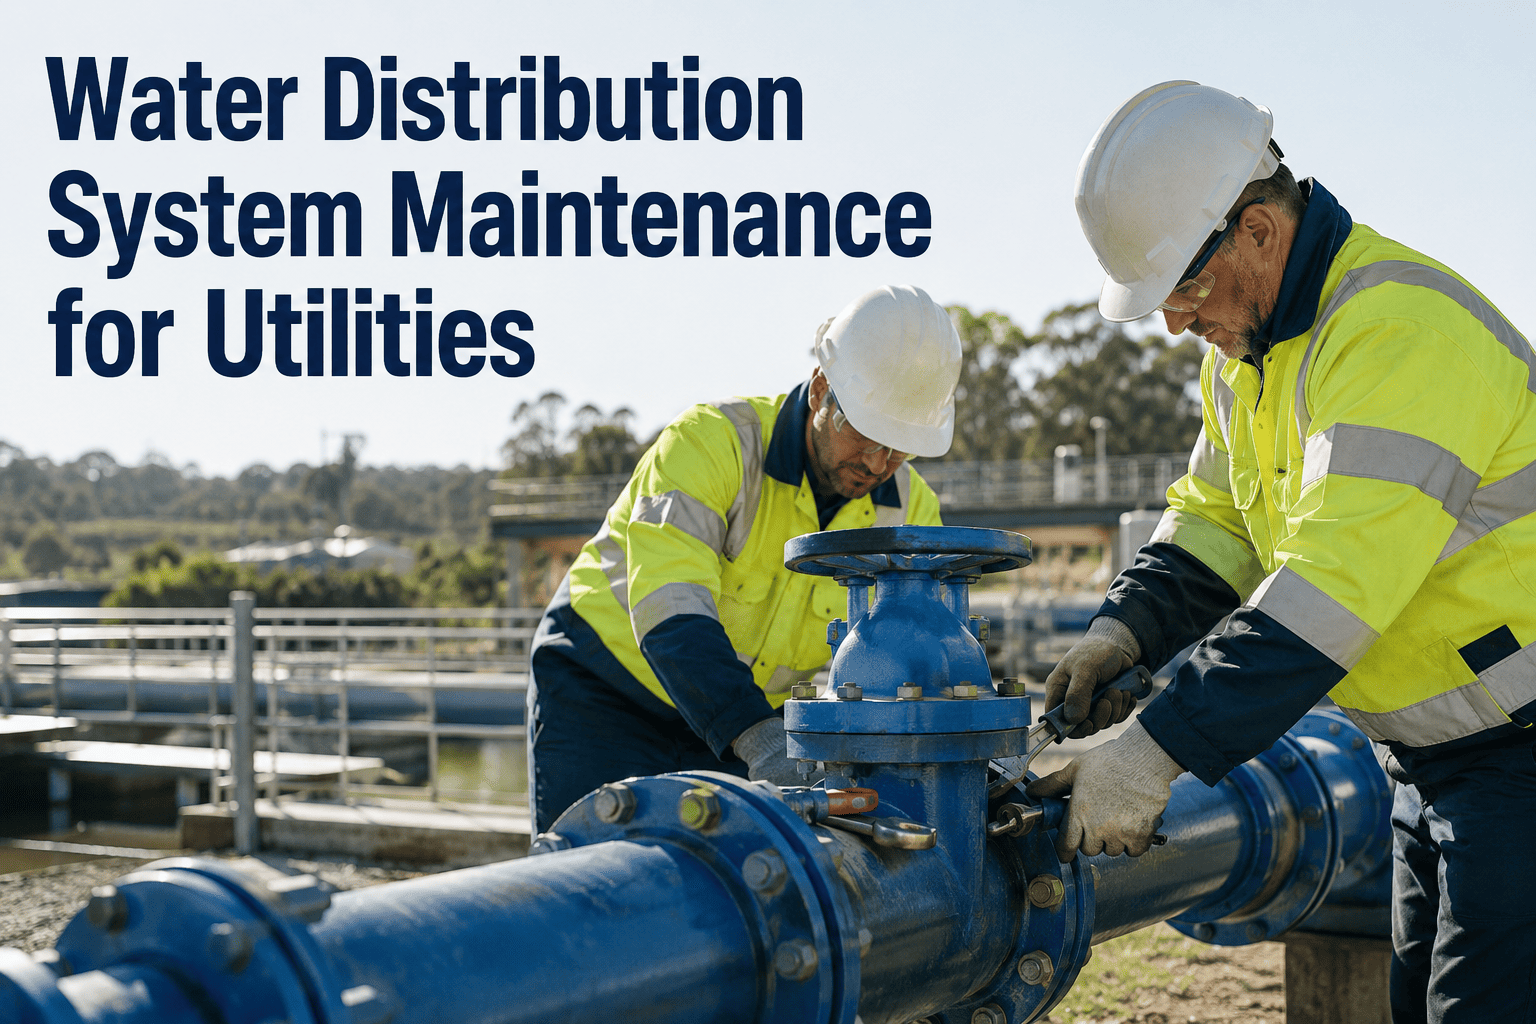
A valve that has not moved in five years is a valve that will not close during a break. Cycle every distribution valve on a 1–3 year rotation, log turns-to-open, torque, and condition, and flag any that exceed 25 ft-lbs. Hydrants follow the same rhythm with NFPA 1962 and AWWA M17 as the benchmark.
Pressure management & transient control
A 10% reduction in average system pressure cuts leak flow rate by roughly 10–15% and extends main life. Monitor SCADA for surge events above 1.5x steady-state pressure, install surge-relief where pump starts spike, and tune PRZ zones quarterly to keep static pressure inside a 40–80 psi envelope.
Compliance, sampling & boil-order readiness
Every valve closure, main break, and repair must generate a chlorine-residual sample, a bacteriological test, and a documented return-to-service. Tie work orders to Total Coliform Rule and Lead and Copper Rule requirements so the compliance record builds itself as crews close tickets in the field.
SAVINGS & PAYBACK
The economics of a CMMS-driven program
The value of moving from reactive to planned maintenance is measurable. Use the formula below to size the prize for your own system, then compare it to annual CMMS cost.
ANNUAL BREAK-AVOIDANCE SAVINGS
S = (B0 − B1) × Cb + (NRW0 − NRW1) × V × P
B0 = annual breaks before program · B1 = annual breaks after · Cb = cost per break ($8K–$15K) · NRW = non-revenue water % · V = annual volume produced · P = price per 1,000 gal
WORKED EXAMPLE — MID-SIZE MUNICIPAL UTILITY
A 12,000-connection utility running 180 miles of main records 42 breaks a year at an average $11K per break and loses 18% of treated water. By moving to a 2-year valve cycle, quarterly PRZ tuning, and CMMS-tracked condition scoring, breaks drop to 26 and NRW falls to 12% inside 18 months. Net annual savings: roughly $176K in repair costs plus $310K in recovered water revenue, against a $24K/yr CMMS subscription — a 7-month payback.
| Metric | Reactive Baseline | CMMS Program (Year 2) | Annual Impact |
|---|---|---|---|
| Main breaks per year | 42 | 26 | −38% |
| Non-revenue water | 18% | 12% | −33% |
| Emergency repair spend | $462K | $286K | +$176K |
| Recovered water revenue | — | $310K | +$310K |
| Mean time to isolate a break | 2.5 hrs | 45 min | −70% |
| Annual CMMS cost | — | $24K | −$24K |
Stop treating main breaks as inevitable.
Deploy a distribution reliability program in weeks, not quarters. See your asset register, valve cycle, and compliance log in one dashboard.
THE 90-DAY ROLLOUT
From spreadsheet to live CMMS in one quarter
A phased rollout keeps crews productive while the asset register, schedules, and compliance log come online in parallel.
Asset register & criticality scoring
Import GIS pipe data, valve inventories, and hydrant locations into the CMMS. Assign material, install year, diameter, and a 1–5 criticality score to every segment. Target: 80% of assets live by Day 30.
Build the preventive cycle
Generate valve-exercising routes, hydrant inspections, PRZ checks, and sample-site visits as recurring work orders. Map each task to AWWA standards and your state drinking-water rules so compliance is automatic.
Go mobile & measure
Crews close work orders on a mobile app, capturing photos, turns-to-open, chlorine residual, and return-to-service signatures. Dashboards populate with break rate, MTTR, NRW trend, and on-time PM %.
−70%
FASTER BREAK ISOLATION
95%
VALVE OPERABILITY
100%
AUDIT-READY LOGS
−33%
NON-REVENUE WATER
FREQUENTLY ASKED
Distribution maintenance, answered
How often should we exercise distribution valves?
Most systems target a 1-to-3-year cycle, with critical valves (large-diameter feeds, hospital loops, single-source zones) on the shorter end. The goal is not just cycling but logging turns-to-open, torque, and any packing leaks so deteriorating valves are flagged for replacement before a break makes them impossible to reach. You can set the rotation and auto-generate the routes when you Start Free Trial.
What is the fastest way to reduce non-revenue water?
Pressure management is usually the highest-ROI first move — a 10% drop in average pressure typically cuts leak volume by 10–15% without touching a pipe. Pair that with district-metered-area (DMA) flow monitoring to locate the loudest zones, then target those mains for acoustic leak detection and condition-based replacement.
How do we stay compliant during a main break repair?
Every break work order should auto-trigger a return-to-service checklist: isolate, excavate, repair, flush at 3x pipe volume, pull a chlorine-residual sample, pull a bacteriological sample, and document the return-to-service sign-off. Tying the checklist to the work order in the CMMS means the compliance record is built while crews work, not reconstructed afterward. Book a walkthrough at calendly.com/oxmaintapp/30min to see the flow.
Can a CMMS predict where the next main break will happen?
Not perfectly, but it can rank risk far better than instinct. By scoring material, age, soil, break history, and criticality, the CMMS produces a prioritized replacement and renewal list. Utilities that follow the list typically cut break frequency 25–40% within two years by replacing the worst 5% of pipe miles first.
How long does it take to stand up a distribution maintenance program?
A focused rollout takes one quarter: 30 days to import GIS and score assets, 30 days to build PM cycles and compliance rules, and 30 days to go mobile and start measuring. Most mid-size utilities see dashboards populate with break rate, MTTR, and NRW trend inside the first 60 days.
START YOUR DISTRIBUTION RELIABILITY PROGRAM
Run a defensible, audit-ready water network.
Asset register, valve cycles, pressure logs, compliance checklists — one platform, fully mobile, built for municipal water.
Free 14-day trial · No credit card